Cities with the Highest Percentage of Births to Unmarried Women over the Age of 35 in Washington
RELATED REPORTS & OPTIONS
Highest Illegitimacy | Women 35+
Washington
Compare Cities
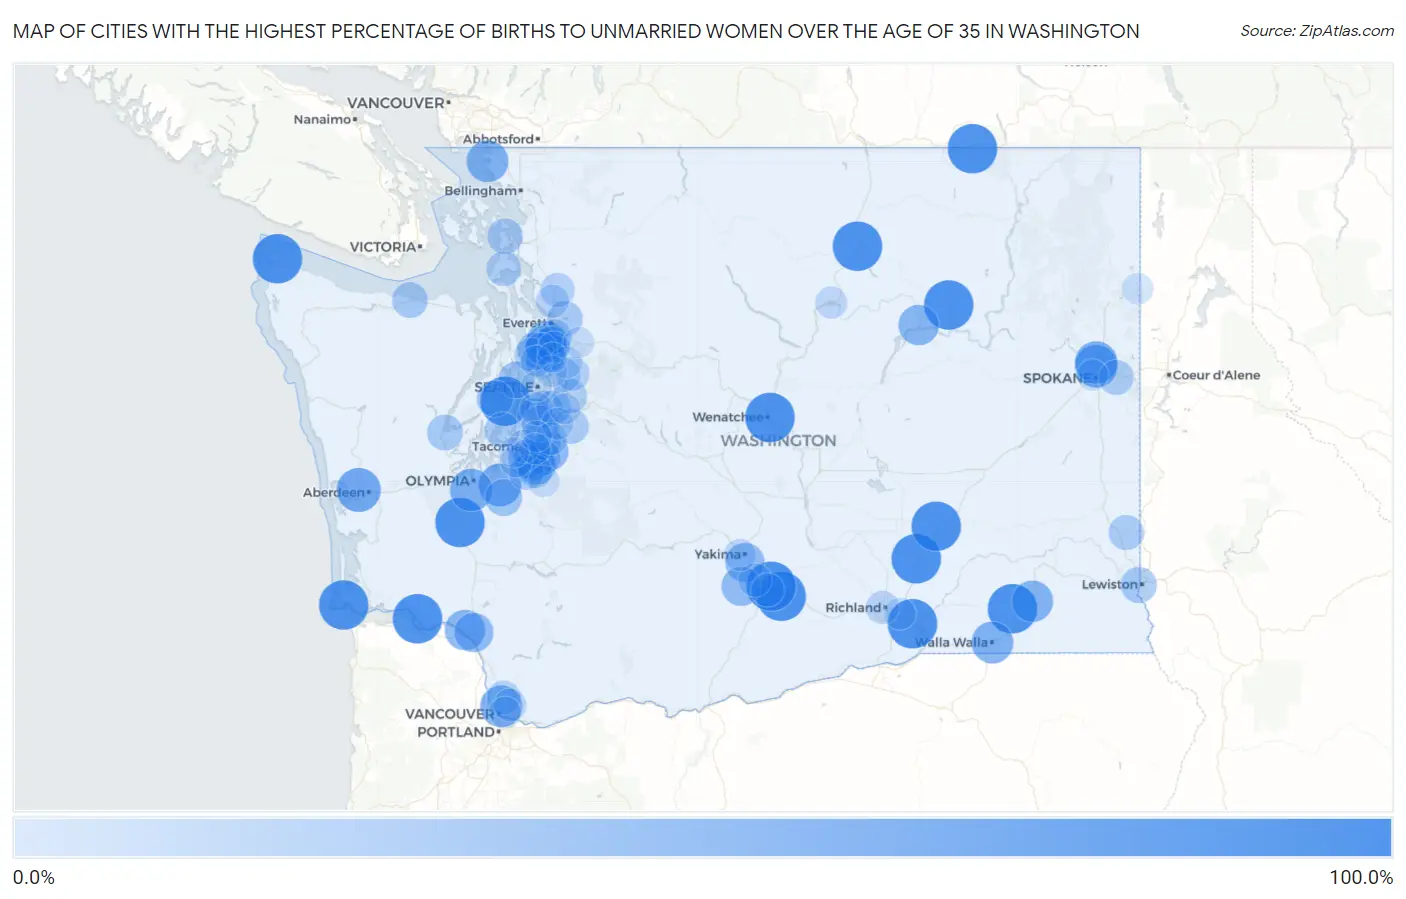
Map of Cities with the Highest Percentage of Births to Unmarried Women over the Age of 35 in Washington
0.0%
100.0%
Cities with the Highest Percentage of Births to Unmarried Women over the Age of 35 in Washington
| City | % Unmarried | vs State | vs National | |
| 1. | East Wenatchee | 100.0% | 15.4%(+84.6)#1 | 20.1%(+79.9)#98 |
| 2. | Finley | 100.0% | 15.4%(+84.6)#2 | 20.1%(+79.9)#330 |
| 3. | East Port Orchard | 100.0% | 15.4%(+84.6)#3 | 20.1%(+79.9)#353 |
| 4. | Omak | 100.0% | 15.4%(+84.6)#4 | 20.1%(+79.9)#390 |
| 5. | Granger | 100.0% | 15.4%(+84.6)#5 | 20.1%(+79.9)#483 |
| 6. | Grand Mound | 100.0% | 15.4%(+84.6)#6 | 20.1%(+79.9)#499 |
| 7. | Zillah | 100.0% | 15.4%(+84.6)#7 | 20.1%(+79.9)#529 |
| 8. | Ilwaco | 100.0% | 15.4%(+84.6)#8 | 20.1%(+79.9)#847 |
| 9. | Neah Bay | 100.0% | 15.4%(+84.6)#9 | 20.1%(+79.9)#950 |
| 10. | Waitsburg | 100.0% | 15.4%(+84.6)#10 | 20.1%(+79.9)#990 |
| 11. | Roche Harbor | 100.0% | 15.4%(+84.6)#11 | 20.1%(+79.9)#1,081 |
| 12. | Mesa | 100.0% | 15.4%(+84.6)#12 | 20.1%(+79.9)#1,103 |
| 13. | Cathlamet | 100.0% | 15.4%(+84.6)#13 | 20.1%(+79.9)#1,187 |
| 14. | Hatton | 100.0% | 15.4%(+84.6)#14 | 20.1%(+79.9)#1,218 |
| 15. | Keller | 100.0% | 15.4%(+84.6)#15 | 20.1%(+79.9)#1,343 |
| 16. | Danville | 100.0% | 15.4%(+84.6)#16 | 20.1%(+79.9)#1,439 |
| 17. | Hoquiam | 73.1% | 15.4%(+57.7)#17 | 20.1%(+53.0)#1,638 |
| 18. | Alderwood Manor | 67.2% | 15.4%(+51.8)#18 | 20.1%(+47.1)#1,713 |
| 19. | Nisqually Indian Community | 66.7% | 15.4%(+51.3)#19 | 20.1%(+46.6)#1,743 |
| 20. | Tumwater | 66.0% | 15.4%(+50.6)#20 | 20.1%(+45.9)#1,748 |
| 21. | Town And Country | 65.5% | 15.4%(+50.1)#21 | 20.1%(+45.4)#1,754 |
| 22. | Country Homes | 65.4% | 15.4%(+50.0)#22 | 20.1%(+45.3)#1,757 |
| 23. | Hazel Dell | 62.5% | 15.4%(+47.1)#23 | 20.1%(+42.4)#1,822 |
| 24. | Walla Walla | 62.3% | 15.4%(+46.9)#24 | 20.1%(+42.2)#1,834 |
| 25. | Birch Bay | 62.3% | 15.4%(+46.9)#25 | 20.1%(+42.2)#1,836 |
| 26. | Dayton | 60.0% | 15.4%(+44.6)#26 | 20.1%(+39.9)#1,889 |
| 27. | Longview | 55.6% | 15.4%(+40.2)#27 | 20.1%(+35.5)#1,983 |
| 28. | Coulee Dam | 55.6% | 15.4%(+40.2)#28 | 20.1%(+35.5)#1,990 |
| 29. | Lake Stickney | 52.8% | 15.4%(+37.4)#29 | 20.1%(+32.7)#2,044 |
| 30. | Summit | 51.5% | 15.4%(+36.1)#30 | 20.1%(+31.4)#2,082 |
| 31. | Sumner | 51.4% | 15.4%(+36.0)#31 | 20.1%(+31.3)#2,084 |
| 32. | Kelso | 50.0% | 15.4%(+34.6)#32 | 20.1%(+29.9)#2,119 |
| 33. | Summit View | 50.0% | 15.4%(+34.6)#33 | 20.1%(+29.9)#2,121 |
| 34. | Union Gap | 50.0% | 15.4%(+34.6)#34 | 20.1%(+29.9)#2,128 |
| 35. | Harrah | 50.0% | 15.4%(+34.6)#35 | 20.1%(+29.9)#2,154 |
| 36. | Midland | 47.6% | 15.4%(+32.2)#36 | 20.1%(+27.5)#2,208 |
| 37. | North Lynnwood | 43.1% | 15.4%(+27.7)#37 | 20.1%(+23.0)#2,342 |
| 38. | Lakeland South | 41.2% | 15.4%(+25.8)#38 | 20.1%(+21.1)#2,396 |
| 39. | Yelm | 39.0% | 15.4%(+23.6)#39 | 20.1%(+18.9)#2,476 |
| 40. | Fairwood Cdp King County | 38.6% | 15.4%(+23.2)#40 | 20.1%(+18.5)#2,482 |
| 41. | Bainbridge Island | 37.8% | 15.4%(+22.4)#41 | 20.1%(+17.7)#2,516 |
| 42. | Tukwila | 36.0% | 15.4%(+20.6)#42 | 20.1%(+15.9)#2,580 |
| 43. | Bremerton | 35.9% | 15.4%(+20.5)#43 | 20.1%(+15.8)#2,587 |
| 44. | Normandy Park | 35.3% | 15.4%(+19.9)#44 | 20.1%(+15.2)#2,609 |
| 45. | Puyallup | 35.2% | 15.4%(+19.8)#45 | 20.1%(+15.1)#2,613 |
| 46. | Des Moines | 35.0% | 15.4%(+19.6)#46 | 20.1%(+14.9)#2,622 |
| 47. | Clarkston | 34.7% | 15.4%(+19.3)#47 | 20.1%(+14.6)#2,640 |
| 48. | Martha Lake | 33.8% | 15.4%(+18.4)#48 | 20.1%(+13.7)#2,671 |
| 49. | Port Angeles | 33.3% | 15.4%(+17.9)#49 | 20.1%(+13.2)#2,686 |
| 50. | Skokomish | 33.3% | 15.4%(+17.9)#50 | 20.1%(+13.2)#2,724 |
| 51. | Mill Creek | 32.2% | 15.4%(+16.8)#51 | 20.1%(+12.1)#2,758 |
| 52. | Edmonds | 32.1% | 15.4%(+16.7)#52 | 20.1%(+12.0)#2,762 |
| 53. | Anacortes | 32.0% | 15.4%(+16.6)#53 | 20.1%(+11.9)#2,769 |
| 54. | Lake Stevens | 31.8% | 15.4%(+16.4)#54 | 20.1%(+11.7)#2,775 |
| 55. | Rosedale | 31.4% | 15.4%(+16.0)#55 | 20.1%(+11.3)#2,790 |
| 56. | Spokane Valley | 29.7% | 15.4%(+14.3)#56 | 20.1%(+9.60)#2,857 |
| 57. | Pullman | 29.6% | 15.4%(+14.2)#57 | 20.1%(+9.50)#2,862 |
| 58. | Maple Valley | 29.5% | 15.4%(+14.1)#58 | 20.1%(+9.40)#2,867 |
| 59. | Oak Harbor | 28.7% | 15.4%(+13.3)#59 | 20.1%(+8.60)#2,899 |
| 60. | Renton | 28.5% | 15.4%(+13.1)#60 | 20.1%(+8.40)#2,915 |
| 61. | Spanaway | 28.2% | 15.4%(+12.8)#61 | 20.1%(+8.10)#2,928 |
| 62. | Issaquah | 27.2% | 15.4%(+11.8)#62 | 20.1%(+7.10)#2,977 |
| 63. | Lake Forest Park | 26.0% | 15.4%(+10.6)#63 | 20.1%(+5.90)#3,029 |
| 64. | Arlington | 25.2% | 15.4%(+9.80)#64 | 20.1%(+5.10)#3,067 |
| 65. | Union Hill Novelty Hill | 25.0% | 15.4%(+9.60)#65 | 20.1%(+4.90)#3,072 |
| 66. | Woodway | 25.0% | 15.4%(+9.60)#66 | 20.1%(+4.90)#3,084 |
| 67. | Eastmont | 24.1% | 15.4%(+8.70)#67 | 20.1%(+4.00)#3,119 |
| 68. | Mount Vista | 23.7% | 15.4%(+8.30)#68 | 20.1%(+3.60)#3,129 |
| 69. | Redmond | 23.5% | 15.4%(+8.10)#69 | 20.1%(+3.40)#3,137 |
| 70. | Frederickson | 23.3% | 15.4%(+7.90)#70 | 20.1%(+3.20)#3,150 |
| 71. | Wapato | 22.2% | 15.4%(+6.80)#71 | 20.1%(+2.10)#3,195 |
| 72. | Toppenish | 21.4% | 15.4%(+6.00)#72 | 20.1%(+1.30)#3,237 |
| 73. | Richland | 20.8% | 15.4%(+5.40)#73 | 20.1%(+0.700)#3,262 |
| 74. | Marysville | 20.1% | 15.4%(+4.70)#74 | 20.1%(=0.000)#3,303 |
| 75. | Tacoma | 19.9% | 15.4%(+4.50)#75 | 20.1%(-0.200)#3,316 |
| 76. | Burien | 19.3% | 15.4%(+3.90)#76 | 20.1%(-0.800)#3,344 |
| 77. | Five Corners | 18.5% | 15.4%(+3.10)#77 | 20.1%(-1.60)#3,376 |
| 78. | Auburn | 17.6% | 15.4%(+2.20)#78 | 20.1%(-2.50)#3,424 |
| 79. | Yakima | 15.9% | 15.4%(+0.500)#79 | 20.1%(-4.20)#3,516 |
| 80. | Lakewood | 15.9% | 15.4%(+0.500)#80 | 20.1%(-4.20)#3,517 |
| 81. | Brewster | 15.4% | 15.4%(=0.000)#81 | 20.1%(-4.70)#3,549 |
| 82. | Lynnwood | 15.3% | 15.4%(-0.100)#82 | 20.1%(-4.80)#3,554 |
| 83. | Cottage Lake | 14.7% | 15.4%(-0.700)#83 | 20.1%(-5.40)#3,590 |
| 84. | Mill Creek East | 14.6% | 15.4%(-0.800)#84 | 20.1%(-5.50)#3,602 |
| 85. | Kent | 14.2% | 15.4%(-1.20)#85 | 20.1%(-5.90)#3,624 |
| 86. | Vancouver | 13.9% | 15.4%(-1.50)#86 | 20.1%(-6.20)#3,641 |
| 87. | Kirkland | 13.8% | 15.4%(-1.60)#87 | 20.1%(-6.30)#3,648 |
| 88. | Pasco | 13.7% | 15.4%(-1.70)#88 | 20.1%(-6.40)#3,653 |
| 89. | Tehaleh | 12.5% | 15.4%(-2.90)#89 | 20.1%(-7.60)#3,727 |
| 90. | Shoreline | 12.3% | 15.4%(-3.10)#90 | 20.1%(-7.80)#3,736 |
| 91. | Graham | 12.0% | 15.4%(-3.40)#91 | 20.1%(-8.10)#3,751 |
| 92. | Newport | 11.9% | 15.4%(-3.50)#92 | 20.1%(-8.20)#3,760 |
| 93. | Spokane | 11.6% | 15.4%(-3.80)#93 | 20.1%(-8.50)#3,766 |
| 94. | Federal Way | 11.5% | 15.4%(-3.90)#94 | 20.1%(-8.60)#3,771 |
| 95. | Fife | 11.3% | 15.4%(-4.10)#95 | 20.1%(-8.80)#3,787 |
| 96. | Monroe | 10.8% | 15.4%(-4.60)#96 | 20.1%(-9.30)#3,807 |
| 97. | Seattle | 10.7% | 15.4%(-4.70)#97 | 20.1%(-9.40)#3,808 |
| 98. | East Renton Highlands | 9.4% | 15.4%(-6.00)#98 | 20.1%(-10.7)#3,870 |
| 99. | University Place | 8.1% | 15.4%(-7.30)#99 | 20.1%(-12.0)#3,924 |
| 100. | Bothell | 6.5% | 15.4%(-8.90)#100 | 20.1%(-13.6)#4,001 |
Common Questions
What are the Top 10 Cities with the Highest Percentage of Births to Unmarried Women over the Age of 35 in Washington?
Top 10 Cities with the Highest Percentage of Births to Unmarried Women over the Age of 35 in Washington are:
#1
100.0%
#2
100.0%
#3
100.0%
#4
100.0%
#5
100.0%
#6
100.0%
#7
100.0%
#8
100.0%
#9
100.0%
#10
100.0%
What city has the Highest Percentage of Births to Unmarried Women over the Age of 35 in Washington?
East Wenatchee has the Highest Percentage of Births to Unmarried Women over the Age of 35 in Washington with 100.0%.
What is the Percentage of Births to Unmarried Women over the Age of 35 in the State of Washington?
Percentage of Births to Unmarried Women over the Age of 35 in Washington is 15.4%.
What is the Percentage of Births to Unmarried Women over the Age of 35 in the United States?
Percentage of Births to Unmarried Women over the Age of 35 in the United States is 20.1%.