Cities with the Highest Percentage of Immigrants from Belgium in Washington
RELATED REPORTS & OPTIONS
Belgium
Washington
Compare Cities
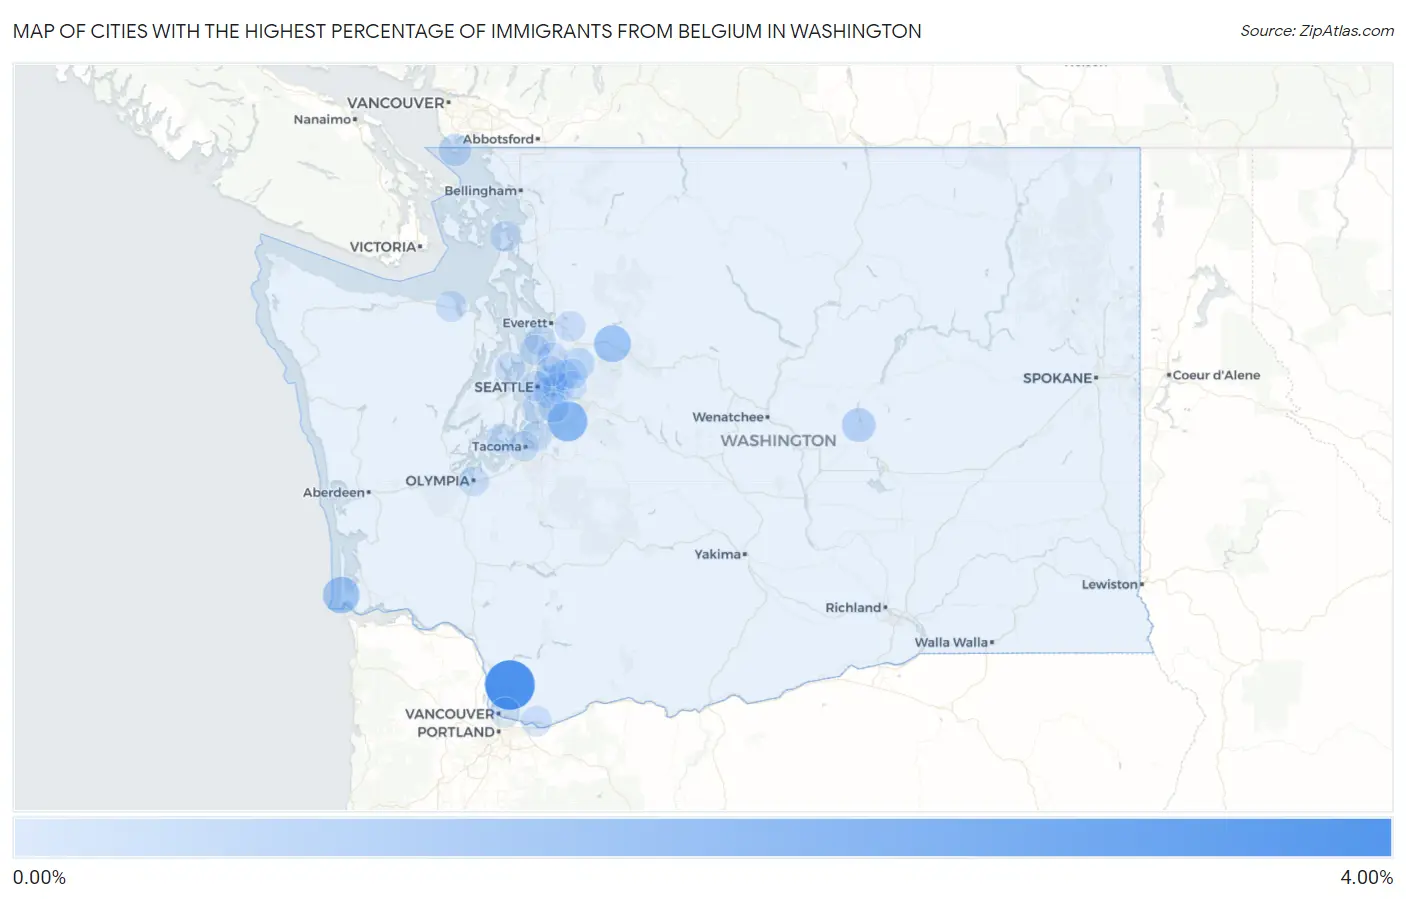
Map of Cities with the Highest Percentage of Immigrants from Belgium in Washington
0.00%
4.00%
Cities with the Highest Percentage of Immigrants from Belgium in Washington
| City | Belgium | vs State | vs National | |
| 1. | Cherry Grove | 3.73% | 0.011%(+3.72)#1 | 0.010%(+3.72)#9 |
| 2. | Shadow Lake | 1.84% | 0.011%(+1.83)#2 | 0.010%(+1.83)#20 |
| 3. | May Creek | 1.26% | 0.011%(+1.25)#3 | 0.010%(+1.25)#28 |
| 4. | Long Beach | 1.20% | 0.011%(+1.19)#4 | 0.010%(+1.19)#31 |
| 5. | Lakeview | 0.65% | 0.011%(+0.638)#5 | 0.010%(+0.639)#75 |
| 6. | Point Roberts | 0.40% | 0.011%(+0.389)#6 | 0.010%(+0.390)#122 |
| 7. | Clyde Hill | 0.32% | 0.011%(+0.311)#7 | 0.010%(+0.311)#144 |
| 8. | Duvall | 0.31% | 0.011%(+0.296)#8 | 0.010%(+0.297)#148 |
| 9. | Mercer Island | 0.17% | 0.011%(+0.158)#9 | 0.010%(+0.158)#258 |
| 10. | Picnic Point | 0.14% | 0.011%(+0.129)#10 | 0.010%(+0.130)#294 |
| 11. | Sequim | 0.14% | 0.011%(+0.125)#11 | 0.010%(+0.126)#301 |
| 12. | Bellevue | 0.089% | 0.011%(+0.078)#12 | 0.010%(+0.078)#389 |
| 13. | Washougal | 0.083% | 0.011%(+0.072)#13 | 0.010%(+0.073)#401 |
| 14. | Everett | 0.075% | 0.011%(+0.064)#14 | 0.010%(+0.064)#424 |
| 15. | Suquamish | 0.069% | 0.011%(+0.058)#15 | 0.010%(+0.059)#443 |
| 16. | Fairwood Cdp King County | 0.054% | 0.011%(+0.043)#16 | 0.010%(+0.043)#493 |
| 17. | Anacortes | 0.045% | 0.011%(+0.034)#17 | 0.010%(+0.035)#531 |
| 18. | Artondale | 0.043% | 0.011%(+0.032)#18 | 0.010%(+0.033)#545 |
| 19. | Federal Way | 0.037% | 0.011%(+0.026)#19 | 0.010%(+0.027)#576 |
| 20. | Bothell | 0.035% | 0.011%(+0.024)#20 | 0.010%(+0.025)#589 |
| 21. | Edmonds | 0.035% | 0.011%(+0.024)#21 | 0.010%(+0.025)#590 |
| 22. | Redmond | 0.030% | 0.011%(+0.019)#22 | 0.010%(+0.019)#625 |
| 23. | Sammamish | 0.027% | 0.011%(+0.016)#23 | 0.010%(+0.017)#648 |
| 24. | Union Hill Novelty Hill | 0.022% | 0.011%(+0.010)#24 | 0.010%(+0.011)#690 |
| 25. | Burien | 0.017% | 0.011%(+0.006)#25 | 0.010%(+0.007)#742 |
| 26. | Olympia | 0.016% | 0.011%(+0.005)#26 | 0.010%(+0.006)#754 |
| 27. | Kirkland | 0.015% | 0.011%(+0.004)#27 | 0.010%(+0.005)#775 |
| 28. | Seattle | 0.014% | 0.011%(+0.003)#28 | 0.010%(+0.004)#784 |
| 29. | Renton | 0.010% | 0.011%(-0.001)#29 | 0.010%(-0.000)#847 |
| 30. | Vancouver | 0.0052% | 0.011%(-0.006)#30 | 0.010%(-0.005)#925 |
| 31. | Tacoma | 0.0032% | 0.011%(-0.008)#31 | 0.010%(-0.007)#952 |
Common Questions
What are the Top 10 Cities with the Highest Percentage of Immigrants from Belgium in Washington?
Top 10 Cities with the Highest Percentage of Immigrants from Belgium in Washington are:
#1
3.73%
#2
1.84%
#3
1.26%
#4
1.20%
#5
0.65%
#6
0.40%
#7
0.32%
#8
0.31%
#9
0.17%
#10
0.14%
What city has the Highest Percentage of Immigrants from Belgium in Washington?
Cherry Grove has the Highest Percentage of Immigrants from Belgium in Washington with 3.73%.
What is the Percentage of Immigrants from Belgium in the State of Washington?
Percentage of Immigrants from Belgium in Washington is 0.011%.
What is the Percentage of Immigrants from Belgium in the United States?
Percentage of Immigrants from Belgium in the United States is 0.010%.