Cities with the Highest Percentage of Argentinean Population in Washington
RELATED REPORTS & OPTIONS
Argentinean
Washington
Compare Cities
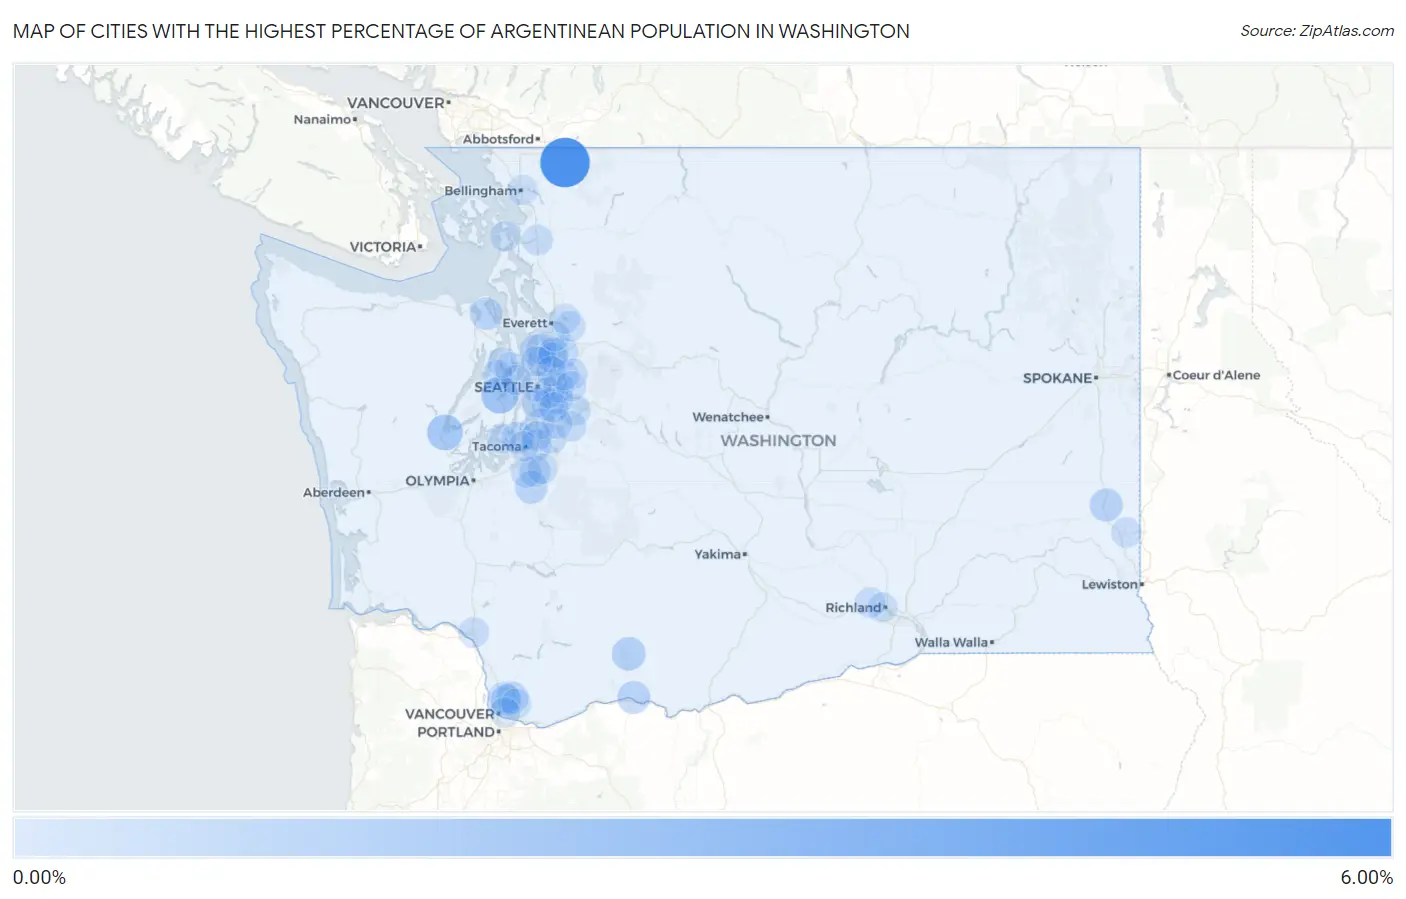
Map of Cities with the Highest Percentage of Argentinean Population in Washington
0.00%
6.00%

Cities with the Highest Percentage of Argentinean Population in Washington
| City | Argentinean | vs State | vs National | |
| 1. | Maple Falls | 5.63% | 0.049%(+5.58)#1 | 0.092%(+5.54)#17 |
| 2. | Navy Yard City | 1.93% | 0.049%(+1.88)#2 | 0.092%(+1.84)#109 |
| 3. | Skokomish | 1.55% | 0.049%(+1.50)#3 | 0.092%(+1.46)#140 |
| 4. | Trout Lake | 0.97% | 0.049%(+0.924)#4 | 0.092%(+0.881)#268 |
| 5. | Colfax | 0.79% | 0.049%(+0.737)#5 | 0.092%(+0.694)#321 |
| 6. | White Salmon | 0.76% | 0.049%(+0.709)#6 | 0.092%(+0.666)#339 |
| 7. | Port Hadlock Irondale | 0.69% | 0.049%(+0.642)#7 | 0.092%(+0.600)#384 |
| 8. | South Creek | 0.64% | 0.049%(+0.590)#8 | 0.092%(+0.547)#421 |
| 9. | Ruston | 0.47% | 0.049%(+0.423)#9 | 0.092%(+0.380)#579 |
| 10. | Brush Prairie | 0.46% | 0.049%(+0.408)#10 | 0.092%(+0.365)#593 |
| 11. | Maltby | 0.43% | 0.049%(+0.383)#11 | 0.092%(+0.340)#637 |
| 12. | Mount Vista | 0.40% | 0.049%(+0.355)#12 | 0.092%(+0.312)#681 |
| 13. | Roche Harbor | 0.40% | 0.049%(+0.349)#13 | 0.092%(+0.306)#690 |
| 14. | Barberton | 0.34% | 0.049%(+0.291)#14 | 0.092%(+0.248)#780 |
| 15. | Frederickson | 0.32% | 0.049%(+0.274)#15 | 0.092%(+0.231)#816 |
| 16. | Bryn Mawr Skyway | 0.31% | 0.049%(+0.261)#16 | 0.092%(+0.219)#848 |
| 17. | Mirrormont | 0.29% | 0.049%(+0.243)#17 | 0.092%(+0.201)#883 |
| 18. | Fife Heights | 0.25% | 0.049%(+0.205)#18 | 0.092%(+0.162)#991 |
| 19. | Edmonds | 0.23% | 0.049%(+0.185)#19 | 0.092%(+0.142)#1,054 |
| 20. | Burlington | 0.22% | 0.049%(+0.175)#20 | 0.092%(+0.132)#1,084 |
| 21. | Newcastle | 0.22% | 0.049%(+0.167)#21 | 0.092%(+0.125)#1,116 |
| 22. | Lynnwood | 0.18% | 0.049%(+0.126)#22 | 0.092%(+0.084)#1,255 |
| 23. | Spanaway | 0.17% | 0.049%(+0.121)#23 | 0.092%(+0.078)#1,281 |
| 24. | Mercer Island | 0.17% | 0.049%(+0.120)#24 | 0.092%(+0.077)#1,290 |
| 25. | West Richland | 0.15% | 0.049%(+0.096)#25 | 0.092%(+0.053)#1,403 |
| 26. | Fairwood Cdp King County | 0.14% | 0.049%(+0.090)#26 | 0.092%(+0.048)#1,436 |
| 27. | Everett | 0.14% | 0.049%(+0.090)#27 | 0.092%(+0.047)#1,442 |
| 28. | Union Hill Novelty Hill | 0.14% | 0.049%(+0.089)#28 | 0.092%(+0.046)#1,445 |
| 29. | Bellevue | 0.14% | 0.049%(+0.087)#29 | 0.092%(+0.045)#1,455 |
| 30. | Seattle | 0.14% | 0.049%(+0.087)#30 | 0.092%(+0.044)#1,458 |
| 31. | Auburn | 0.13% | 0.049%(+0.078)#31 | 0.092%(+0.035)#1,509 |
| 32. | Lake Forest Park | 0.13% | 0.049%(+0.077)#32 | 0.092%(+0.034)#1,517 |
| 33. | Artondale | 0.12% | 0.049%(+0.073)#33 | 0.092%(+0.031)#1,540 |
| 34. | Des Moines | 0.12% | 0.049%(+0.067)#34 | 0.092%(+0.024)#1,573 |
| 35. | Suquamish | 0.12% | 0.049%(+0.066)#35 | 0.092%(+0.023)#1,581 |
| 36. | Redmond | 0.12% | 0.049%(+0.066)#36 | 0.092%(+0.023)#1,583 |
| 37. | Bothell | 0.10% | 0.049%(+0.051)#37 | 0.092%(+0.008)#1,676 |
| 38. | White Center | 0.097% | 0.049%(+0.048)#38 | 0.092%(+0.005)#1,704 |
| 39. | Bothell East | 0.093% | 0.049%(+0.044)#39 | 0.092%(+0.001)#1,731 |
| 40. | Pullman | 0.088% | 0.049%(+0.038)#40 | 0.092%(-0.004)#1,776 |
| 41. | Kelso | 0.087% | 0.049%(+0.038)#41 | 0.092%(-0.005)#1,784 |
| 42. | Silverdale | 0.069% | 0.049%(+0.020)#42 | 0.092%(-0.023)#1,934 |
| 43. | Kirkland | 0.068% | 0.049%(+0.019)#43 | 0.092%(-0.024)#1,938 |
| 44. | Maple Valley | 0.068% | 0.049%(+0.019)#44 | 0.092%(-0.024)#1,939 |
| 45. | Shoreline | 0.066% | 0.049%(+0.017)#45 | 0.092%(-0.026)#1,956 |
| 46. | South Hill | 0.065% | 0.049%(+0.016)#46 | 0.092%(-0.027)#1,964 |
| 47. | Federal Way | 0.063% | 0.049%(+0.014)#47 | 0.092%(-0.029)#1,979 |
| 48. | Bainbridge Island | 0.061% | 0.049%(+0.011)#48 | 0.092%(-0.031)#1,997 |
| 49. | Poulsbo | 0.059% | 0.049%(+0.010)#49 | 0.092%(-0.033)#2,009 |
| 50. | Orchards | 0.058% | 0.049%(+0.009)#50 | 0.092%(-0.034)#2,020 |
| 51. | Bellingham | 0.055% | 0.049%(+0.005)#51 | 0.092%(-0.037)#2,058 |
| 52. | Anacortes | 0.045% | 0.049%(-0.004)#52 | 0.092%(-0.047)#2,138 |
| 53. | Eastmont | 0.043% | 0.049%(-0.006)#53 | 0.092%(-0.049)#2,164 |
| 54. | Richland | 0.043% | 0.049%(-0.007)#54 | 0.092%(-0.049)#2,169 |
| 55. | Kent | 0.040% | 0.049%(-0.009)#55 | 0.092%(-0.052)#2,201 |
| 56. | Lake Stevens | 0.039% | 0.049%(-0.011)#56 | 0.092%(-0.053)#2,218 |
| 57. | Vancouver | 0.029% | 0.049%(-0.020)#57 | 0.092%(-0.063)#2,300 |
| 58. | Sammamish | 0.027% | 0.049%(-0.022)#58 | 0.092%(-0.065)#2,324 |
| 59. | Renton | 0.026% | 0.049%(-0.024)#59 | 0.092%(-0.066)#2,339 |
| 60. | Tacoma | 0.011% | 0.049%(-0.038)#60 | 0.092%(-0.081)#2,504 |
Common Questions
What are the Top 10 Cities with the Highest Percentage of Argentinean Population in Washington?
Top 10 Cities with the Highest Percentage of Argentinean Population in Washington are:
#1
5.63%
#2
1.93%
#3
1.55%
#4
0.97%
#5
0.79%
#6
0.76%
#7
0.69%
#8
0.64%
#9
0.47%
#10
0.46%
What city has the Highest Percentage of Argentinean Population in Washington?
Maple Falls has the Highest Percentage of Argentinean Population in Washington with 5.63%.
What is the Percentage of Argentinean Population in the State of Washington?
Percentage of Argentinean Population in Washington is 0.049%.
What is the Percentage of Argentinean Population in the United States?
Percentage of Argentinean Population in the United States is 0.092%.