Cities with the Highest Percentage of Armenian Population in Washington
RELATED REPORTS & OPTIONS
Armenian
Washington
Compare Cities
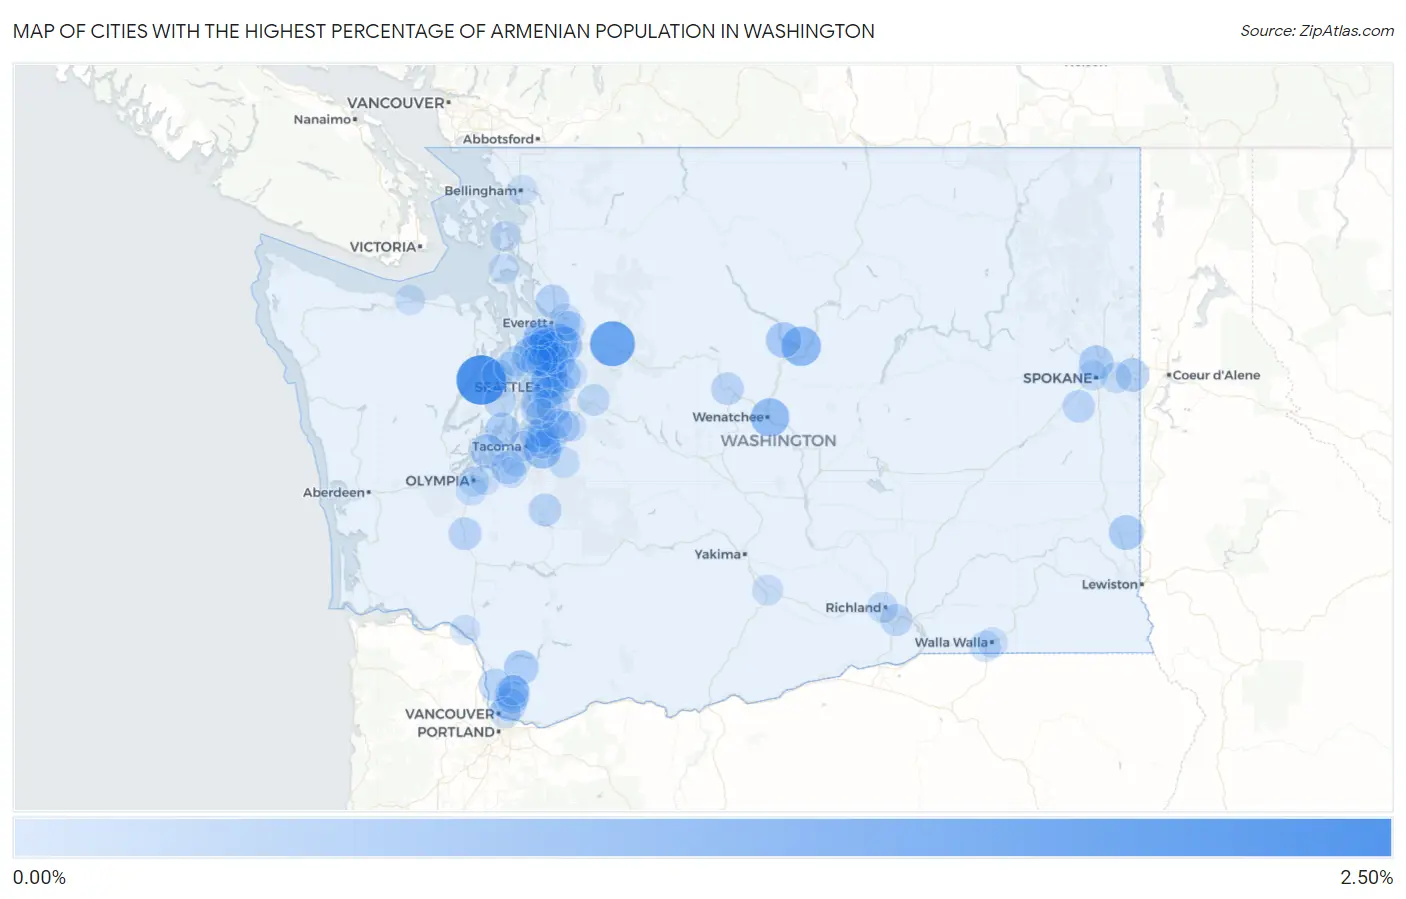
Map of Cities with the Highest Percentage of Armenian Population in Washington
0.00%
2.50%
Cities with the Highest Percentage of Armenian Population in Washington
| City | Armenian | vs State | vs National | |
| 1. | Seabeck | 2.12% | 0.090%(+2.03)#1 | 0.14%(+1.98)#105 |
| 2. | May Creek | 1.60% | 0.090%(+1.51)#2 | 0.14%(+1.47)#162 |
| 3. | Chelan | 0.98% | 0.090%(+0.893)#3 | 0.14%(+0.847)#324 |
| 4. | East Wenatchee | 0.90% | 0.090%(+0.805)#4 | 0.14%(+0.759)#365 |
| 5. | Silver Firs | 0.76% | 0.090%(+0.670)#5 | 0.14%(+0.623)#432 |
| 6. | Edgewood | 0.76% | 0.090%(+0.668)#6 | 0.14%(+0.621)#435 |
| 7. | Woodway | 0.72% | 0.090%(+0.625)#7 | 0.14%(+0.579)#467 |
| 8. | Cathcart | 0.71% | 0.090%(+0.622)#8 | 0.14%(+0.576)#474 |
| 9. | Yarrow Point | 0.63% | 0.090%(+0.535)#9 | 0.14%(+0.488)#546 |
| 10. | Manson | 0.58% | 0.090%(+0.487)#10 | 0.14%(+0.441)#600 |
| 11. | Picnic Point | 0.51% | 0.090%(+0.422)#11 | 0.14%(+0.376)#669 |
| 12. | Lakeland South | 0.50% | 0.090%(+0.409)#12 | 0.14%(+0.363)#684 |
| 13. | Pullman | 0.49% | 0.090%(+0.398)#13 | 0.14%(+0.351)#699 |
| 14. | Kenmore | 0.48% | 0.090%(+0.392)#14 | 0.14%(+0.346)#702 |
| 15. | Amboy | 0.48% | 0.090%(+0.386)#15 | 0.14%(+0.339)#714 |
| 16. | Meadow Glade | 0.46% | 0.090%(+0.370)#16 | 0.14%(+0.323)#737 |
| 17. | Country Homes | 0.45% | 0.090%(+0.358)#17 | 0.14%(+0.311)#759 |
| 18. | Lynnwood | 0.45% | 0.090%(+0.356)#18 | 0.14%(+0.309)#761 |
| 19. | Rosedale | 0.44% | 0.090%(+0.354)#19 | 0.14%(+0.308)#764 |
| 20. | Longbranch | 0.42% | 0.090%(+0.326)#20 | 0.14%(+0.280)#815 |
| 21. | Redmond | 0.40% | 0.090%(+0.314)#21 | 0.14%(+0.267)#845 |
| 22. | Martha Lake | 0.37% | 0.090%(+0.279)#22 | 0.14%(+0.233)#928 |
| 23. | Marysville | 0.37% | 0.090%(+0.277)#23 | 0.14%(+0.230)#934 |
| 24. | Liberty Lake | 0.35% | 0.090%(+0.259)#24 | 0.14%(+0.212)#977 |
| 25. | Medina | 0.34% | 0.090%(+0.252)#25 | 0.14%(+0.205)#988 |
| 26. | Renton | 0.33% | 0.090%(+0.241)#26 | 0.14%(+0.194)#1,014 |
| 27. | Lake Stickney | 0.31% | 0.090%(+0.216)#27 | 0.14%(+0.170)#1,077 |
| 28. | Fairwood Cdp King County | 0.30% | 0.090%(+0.210)#28 | 0.14%(+0.164)#1,093 |
| 29. | Centralia | 0.29% | 0.090%(+0.200)#29 | 0.14%(+0.154)#1,118 |
| 30. | Five Corners | 0.29% | 0.090%(+0.196)#30 | 0.14%(+0.150)#1,134 |
| 31. | Eatonville | 0.28% | 0.090%(+0.191)#31 | 0.14%(+0.144)#1,151 |
| 32. | Woodinville | 0.27% | 0.090%(+0.180)#32 | 0.14%(+0.134)#1,179 |
| 33. | Leavenworth | 0.27% | 0.090%(+0.177)#33 | 0.14%(+0.130)#1,193 |
| 34. | Brush Prairie | 0.27% | 0.090%(+0.176)#34 | 0.14%(+0.130)#1,197 |
| 35. | North Fort Lewis | 0.27% | 0.090%(+0.175)#35 | 0.14%(+0.129)#1,204 |
| 36. | Ridgefield | 0.26% | 0.090%(+0.171)#36 | 0.14%(+0.124)#1,214 |
| 37. | Cheney | 0.26% | 0.090%(+0.166)#37 | 0.14%(+0.120)#1,234 |
| 38. | Federal Way | 0.26% | 0.090%(+0.166)#38 | 0.14%(+0.119)#1,239 |
| 39. | Covington | 0.23% | 0.090%(+0.140)#39 | 0.14%(+0.094)#1,329 |
| 40. | Port Orchard | 0.21% | 0.090%(+0.125)#40 | 0.14%(+0.078)#1,400 |
| 41. | Lakeland North | 0.21% | 0.090%(+0.124)#41 | 0.14%(+0.077)#1,404 |
| 42. | Kirkland | 0.21% | 0.090%(+0.123)#42 | 0.14%(+0.076)#1,408 |
| 43. | Kennewick | 0.20% | 0.090%(+0.112)#43 | 0.14%(+0.066)#1,442 |
| 44. | Bellevue | 0.20% | 0.090%(+0.107)#44 | 0.14%(+0.061)#1,470 |
| 45. | Auburn | 0.19% | 0.090%(+0.103)#45 | 0.14%(+0.057)#1,490 |
| 46. | Brier | 0.18% | 0.090%(+0.093)#46 | 0.14%(+0.047)#1,545 |
| 47. | Snoqualmie | 0.18% | 0.090%(+0.091)#47 | 0.14%(+0.045)#1,563 |
| 48. | Burien | 0.17% | 0.090%(+0.080)#48 | 0.14%(+0.034)#1,625 |
| 49. | Vancouver | 0.16% | 0.090%(+0.069)#49 | 0.14%(+0.022)#1,697 |
| 50. | Mercer Island | 0.15% | 0.090%(+0.063)#50 | 0.14%(+0.016)#1,743 |
| 51. | North Lynnwood | 0.15% | 0.090%(+0.062)#51 | 0.14%(+0.016)#1,747 |
| 52. | Edmonds | 0.15% | 0.090%(+0.062)#52 | 0.14%(+0.015)#1,751 |
| 53. | Seattle | 0.15% | 0.090%(+0.055)#53 | 0.14%(+0.008)#1,803 |
| 54. | Prairie Heights | 0.14% | 0.090%(+0.054)#54 | 0.14%(+0.007)#1,808 |
| 55. | Silverdale | 0.14% | 0.090%(+0.052)#55 | 0.14%(+0.005)#1,821 |
| 56. | Indianola | 0.14% | 0.090%(+0.050)#56 | 0.14%(+0.004)#1,829 |
| 57. | Suquamish | 0.14% | 0.090%(+0.048)#57 | 0.14%(+0.002)#1,842 |
| 58. | Mill Creek East | 0.13% | 0.090%(+0.040)#58 | 0.14%(-0.007)#1,885 |
| 59. | College Place | 0.12% | 0.090%(+0.032)#59 | 0.14%(-0.015)#1,946 |
| 60. | Richland | 0.12% | 0.090%(+0.031)#60 | 0.14%(-0.015)#1,955 |
| 61. | Spokane Valley | 0.12% | 0.090%(+0.025)#61 | 0.14%(-0.021)#2,010 |
| 62. | Tumwater | 0.11% | 0.090%(+0.015)#62 | 0.14%(-0.032)#2,084 |
| 63. | Bothell | 0.10% | 0.090%(+0.014)#63 | 0.14%(-0.033)#2,094 |
| 64. | Bryn Mawr Skyway | 0.100% | 0.090%(+0.009)#64 | 0.14%(-0.037)#2,131 |
| 65. | Lakewood | 0.090% | 0.090%(-0.000)#65 | 0.14%(-0.047)#2,200 |
| 66. | Bunk Foss | 0.082% | 0.090%(-0.008)#66 | 0.14%(-0.055)#2,271 |
| 67. | Lake Forest Park | 0.082% | 0.090%(-0.009)#67 | 0.14%(-0.055)#2,275 |
| 68. | Olympia | 0.082% | 0.090%(-0.009)#68 | 0.14%(-0.055)#2,278 |
| 69. | Toppenish | 0.079% | 0.090%(-0.011)#69 | 0.14%(-0.058)#2,296 |
| 70. | Shoreline | 0.077% | 0.090%(-0.014)#70 | 0.14%(-0.060)#2,331 |
| 71. | Fort Lewis | 0.067% | 0.090%(-0.023)#71 | 0.14%(-0.070)#2,412 |
| 72. | Spokane | 0.065% | 0.090%(-0.025)#72 | 0.14%(-0.072)#2,427 |
| 73. | White Center | 0.065% | 0.090%(-0.026)#73 | 0.14%(-0.072)#2,441 |
| 74. | Battle Ground | 0.062% | 0.090%(-0.028)#74 | 0.14%(-0.075)#2,476 |
| 75. | Lake Stevens | 0.062% | 0.090%(-0.029)#75 | 0.14%(-0.075)#2,480 |
| 76. | Everett | 0.056% | 0.090%(-0.034)#76 | 0.14%(-0.081)#2,545 |
| 77. | Maple Valley | 0.054% | 0.090%(-0.037)#77 | 0.14%(-0.083)#2,576 |
| 78. | Walla Walla | 0.053% | 0.090%(-0.037)#78 | 0.14%(-0.084)#2,585 |
| 79. | Mukilteo | 0.047% | 0.090%(-0.044)#79 | 0.14%(-0.090)#2,665 |
| 80. | Oak Harbor | 0.037% | 0.090%(-0.054)#80 | 0.14%(-0.100)#2,775 |
| 81. | Anacortes | 0.034% | 0.090%(-0.056)#81 | 0.14%(-0.103)#2,806 |
| 82. | Tacoma | 0.033% | 0.090%(-0.057)#82 | 0.14%(-0.104)#2,815 |
| 83. | Kent | 0.033% | 0.090%(-0.057)#83 | 0.14%(-0.104)#2,816 |
| 84. | Seatac | 0.026% | 0.090%(-0.065)#84 | 0.14%(-0.111)#2,930 |
| 85. | Port Angeles | 0.025% | 0.090%(-0.065)#85 | 0.14%(-0.112)#2,939 |
| 86. | Longview | 0.021% | 0.090%(-0.069)#86 | 0.14%(-0.116)#2,994 |
| 87. | Bellingham | 0.016% | 0.090%(-0.074)#87 | 0.14%(-0.121)#3,055 |
| 88. | Union Hill Novelty Hill | 0.0043% | 0.090%(-0.086)#88 | 0.14%(-0.133)#3,175 |
| 89. | Lacey | 0.0018% | 0.090%(-0.089)#89 | 0.14%(-0.135)#3,180 |
Common Questions
What are the Top 10 Cities with the Highest Percentage of Armenian Population in Washington?
Top 10 Cities with the Highest Percentage of Armenian Population in Washington are:
#1
2.12%
#2
1.60%
#3
0.98%
#4
0.90%
#5
0.76%
#6
0.76%
#7
0.72%
#8
0.71%
#9
0.63%
#10
0.58%
What city has the Highest Percentage of Armenian Population in Washington?
Seabeck has the Highest Percentage of Armenian Population in Washington with 2.12%.
What is the Percentage of Armenian Population in the State of Washington?
Percentage of Armenian Population in Washington is 0.090%.
What is the Percentage of Armenian Population in the United States?
Percentage of Armenian Population in the United States is 0.14%.