Lebam, WA Map & Demographics
Lebam Map
Lebam Overview
$43,618
PER CAPITA INCOME
$124,625
AVG FAMILY INCOME
54.4%
WAGE / INCOME GAP [ % ]
45.6¢/ $1
WAGE / INCOME GAP [ $ ]
0.38
INEQUALITY / GINI INDEX
168
TOTAL POPULATION
88
MALE POPULATION
80
FEMALE POPULATION
110.00
MALES / 100 FEMALES
90.91
FEMALES / 100 MALES
57.7
MEDIAN AGE
2.5
AVG FAMILY SIZE
2.0
AVG HOUSEHOLD SIZE
68
LABOR FORCE [ PEOPLE ]
45.6%
PERCENT IN LABOR FORCE
Lebam Area Codes
Income in Lebam
Income Overview in Lebam
| Characteristic | Number | Measure |
| Per Capita Income | 168 | $43,618 |
| Median Family Income | 57 | $124,625 |
| Mean Family Income | 57 | $116,119 |
| Median Household Income | 82 | $0 |
| Mean Household Income | 82 | $91,374 |
| Income Deficit | 57 | $0 |
| Wage / Income Gap (%) | 168 | 54.40% |
| Wage / Income Gap ($) | 168 | 45.60¢ per $1 |
| Gini / Inequality Index | 168 | 0.38 |
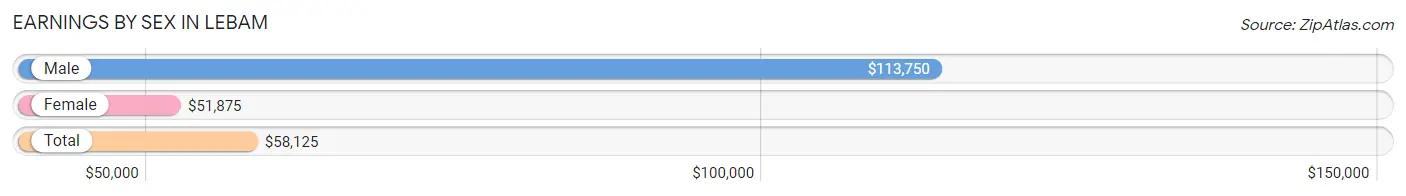
Earnings by Sex in Lebam
Average Earnings in Lebam are $58,125, $113,750 for men and $51,875 for women, a difference of 54.4%.
| Sex | Number | Average Earnings |
| Male | 26 (34.2%) | $113,750 |
| Female | 50 (65.8%) | $51,875 |
| Total | 76 (100.0%) | $58,125 |
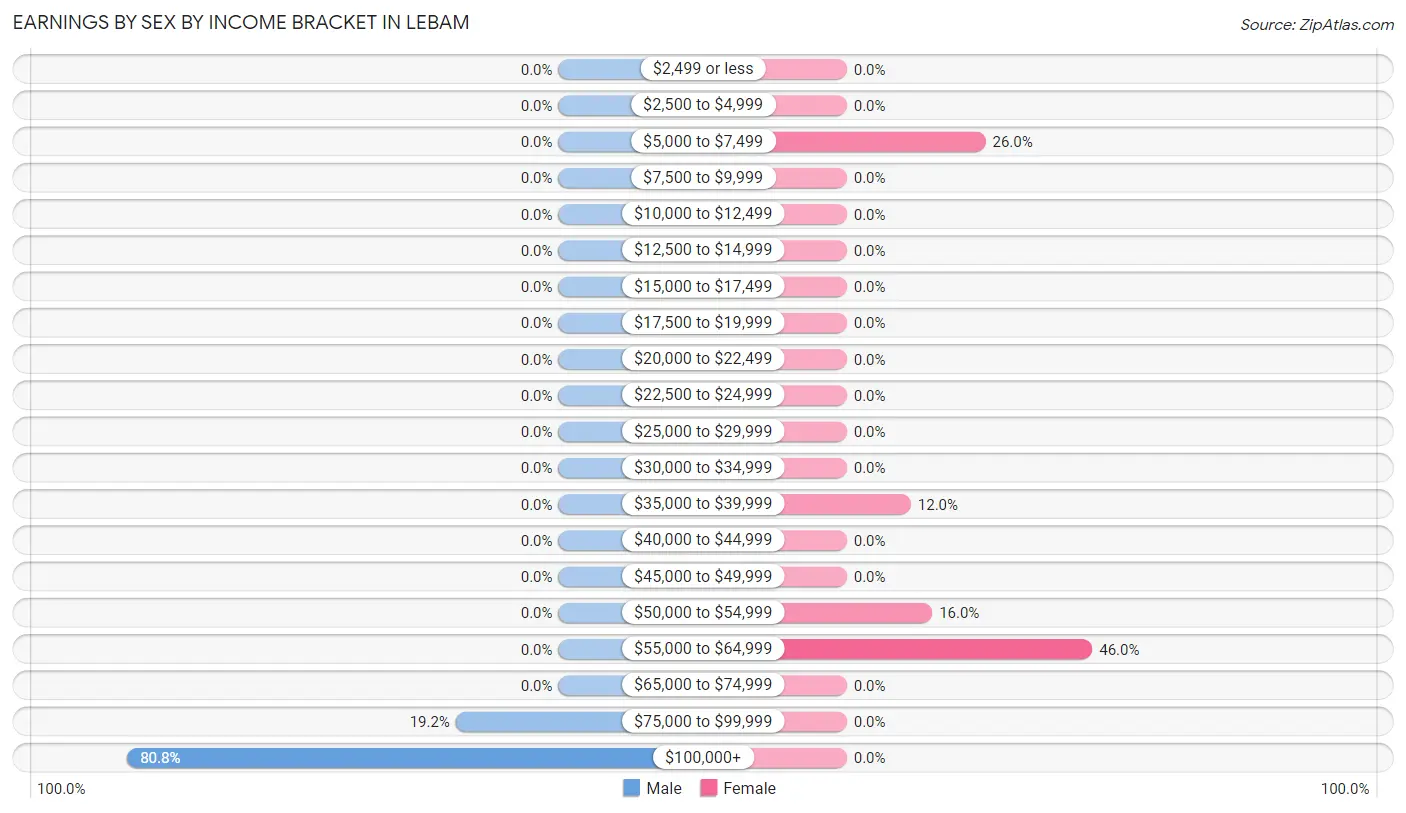
Earnings by Sex by Income Bracket in Lebam
The most common earnings brackets in Lebam are $100,000+ for men (21 | 80.8%) and $55,000 to $64,999 for women (23 | 46.0%).
| Income | Male | Female |
| $2,499 or less | 0 (0.0%) | 0 (0.0%) |
| $2,500 to $4,999 | 0 (0.0%) | 0 (0.0%) |
| $5,000 to $7,499 | 0 (0.0%) | 13 (26.0%) |
| $7,500 to $9,999 | 0 (0.0%) | 0 (0.0%) |
| $10,000 to $12,499 | 0 (0.0%) | 0 (0.0%) |
| $12,500 to $14,999 | 0 (0.0%) | 0 (0.0%) |
| $15,000 to $17,499 | 0 (0.0%) | 0 (0.0%) |
| $17,500 to $19,999 | 0 (0.0%) | 0 (0.0%) |
| $20,000 to $22,499 | 0 (0.0%) | 0 (0.0%) |
| $22,500 to $24,999 | 0 (0.0%) | 0 (0.0%) |
| $25,000 to $29,999 | 0 (0.0%) | 0 (0.0%) |
| $30,000 to $34,999 | 0 (0.0%) | 0 (0.0%) |
| $35,000 to $39,999 | 0 (0.0%) | 6 (12.0%) |
| $40,000 to $44,999 | 0 (0.0%) | 0 (0.0%) |
| $45,000 to $49,999 | 0 (0.0%) | 0 (0.0%) |
| $50,000 to $54,999 | 0 (0.0%) | 8 (16.0%) |
| $55,000 to $64,999 | 0 (0.0%) | 23 (46.0%) |
| $65,000 to $74,999 | 0 (0.0%) | 0 (0.0%) |
| $75,000 to $99,999 | 5 (19.2%) | 0 (0.0%) |
| $100,000+ | 21 (80.8%) | 0 (0.0%) |
| Total | 26 (100.0%) | 50 (100.0%) |
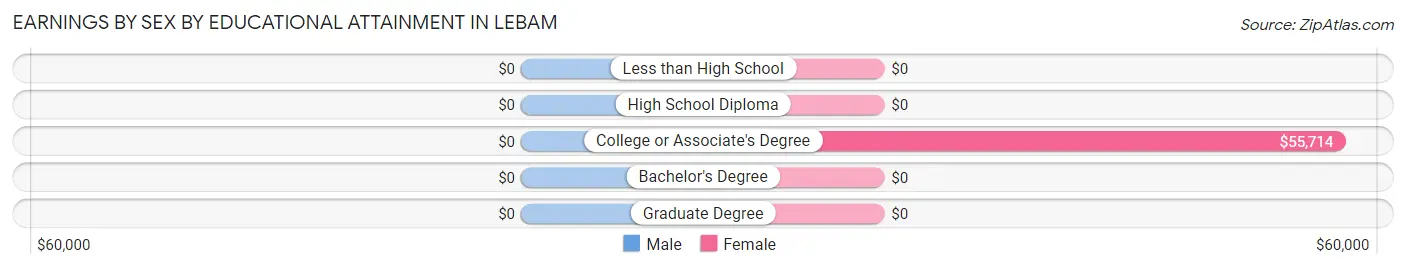
Earnings by Sex by Educational Attainment in Lebam
| Educational Attainment | Male Income | Female Income |
| Less than High School | - | - |
| High School Diploma | - | - |
| College or Associate's Degree | - | - |
| Bachelor's Degree | - | - |
| Graduate Degree | - | - |
| Total | $113,750 | $51,875 |
Family Income in Lebam
Family Income Brackets in Lebam
According to the Lebam family income data, there are 22 families falling into the $150,000 to $199,999 income range, which is the most common income bracket and makes up 38.6% of all families.
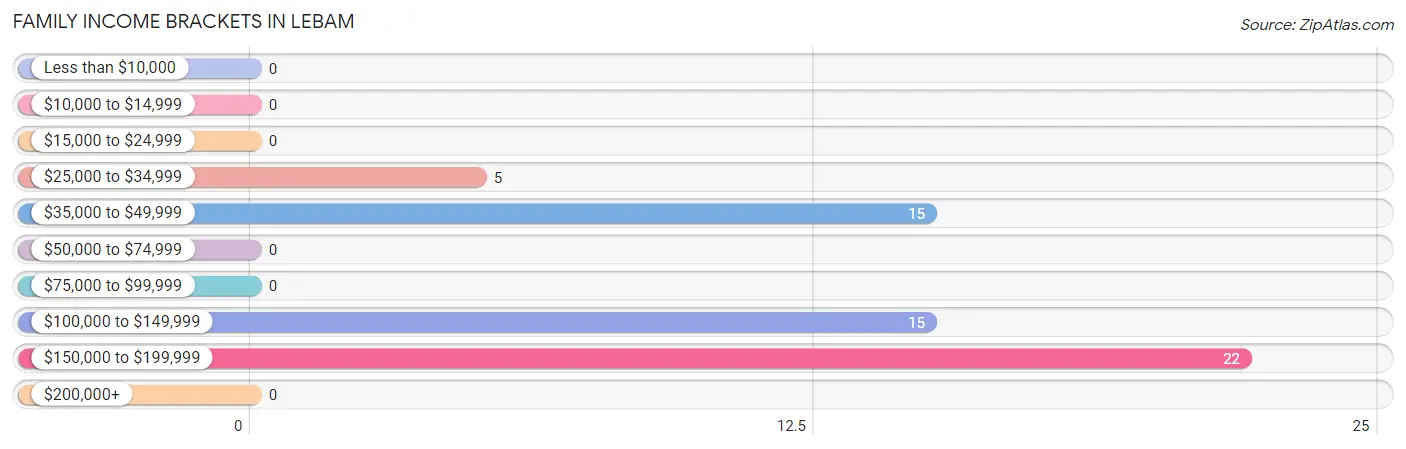
| Income Bracket | # Families | % Families |
| Less than $10,000 | 0 | 0.0% |
| $10,000 to $14,999 | 0 | 0.0% |
| $15,000 to $24,999 | 0 | 0.0% |
| $25,000 to $34,999 | 5 | 8.8% |
| $35,000 to $49,999 | 15 | 26.3% |
| $50,000 to $74,999 | 0 | 0.0% |
| $75,000 to $99,999 | 0 | 0.0% |
| $100,000 to $149,999 | 15 | 26.3% |
| $150,000 to $199,999 | 22 | 38.6% |
| $200,000+ | 0 | 0.0% |
Family Income by Famaliy Size in Lebam
2-person families (31 | 54.4%) account for the highest median family income in Lebam with $172,578 per family, while 2-person families (31 | 54.4%) have the highest median income of $86,289 per family member.
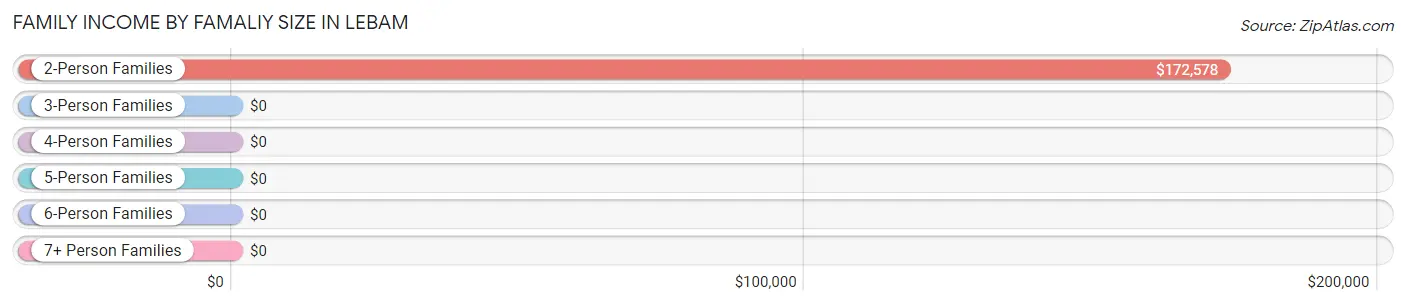
| Income Bracket | # Families | Median Income |
| 2-Person Families | 31 (54.4%) | $172,578 |
| 3-Person Families | 20 (35.1%) | $0 |
| 4-Person Families | 0 (0.0%) | $0 |
| 5-Person Families | 6 (10.5%) | $0 |
| 6-Person Families | 0 (0.0%) | $0 |
| 7+ Person Families | 0 (0.0%) | $0 |
| Total | 57 (100.0%) | $124,625 |
Family Income by Number of Earners in Lebam
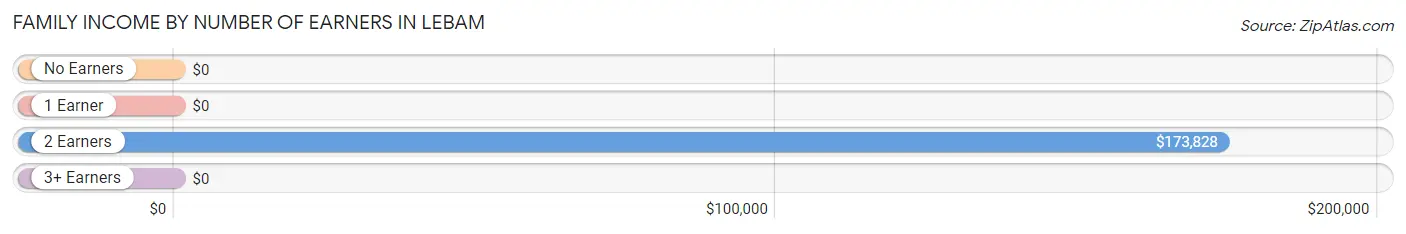
| Number of Earners | # Families | Median Income |
| No Earners | 5 (8.8%) | $0 |
| 1 Earner | 25 (43.9%) | $0 |
| 2 Earners | 27 (47.4%) | $173,828 |
| 3+ Earners | 0 (0.0%) | $0 |
| Total | 57 (100.0%) | $124,625 |
Household Income in Lebam
Household Income Brackets in Lebam
With 22 households falling in the category, the $150,000 to $199,999 income range is the most frequent in Lebam, accounting for 26.8% of all households.
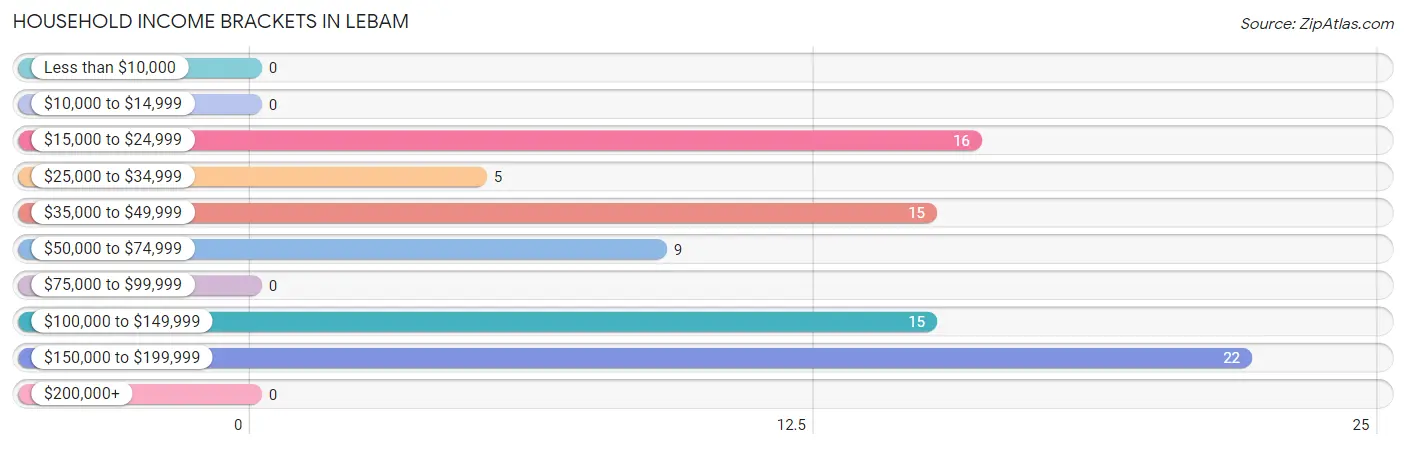
| Income Bracket | # Households | % Households |
| Less than $10,000 | 0 | 0.0% |
| $10,000 to $14,999 | 0 | 0.0% |
| $15,000 to $24,999 | 16 | 19.5% |
| $25,000 to $34,999 | 5 | 6.1% |
| $35,000 to $49,999 | 15 | 18.3% |
| $50,000 to $74,999 | 9 | 11.0% |
| $75,000 to $99,999 | 0 | 0.0% |
| $100,000 to $149,999 | 15 | 18.3% |
| $150,000 to $199,999 | 22 | 26.8% |
| $200,000+ | 0 | 0.0% |
Household Income by Householder Age in Lebam
The median household income in Lebam is $0, with the highest median household income of $124,625 found in the 45 to 64 years age bracket for the primary householder. A total of 35 households (42.7%) fall into this category.
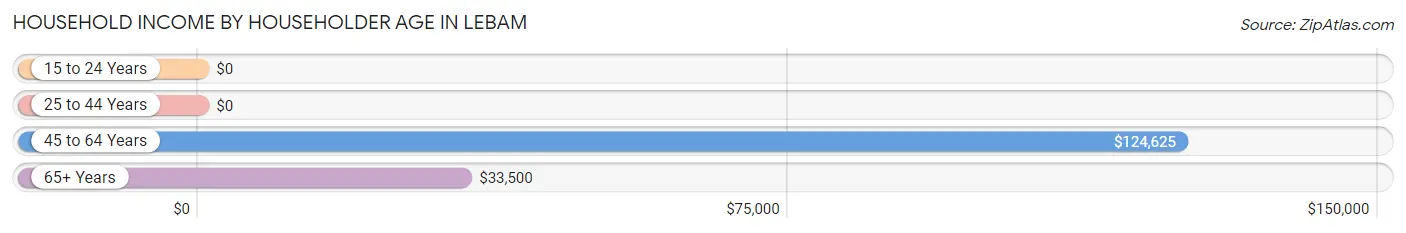
| Income Bracket | # Households | Median Income |
| 15 to 24 Years | 0 (0.0%) | $0 |
| 25 to 44 Years | 11 (13.4%) | $0 |
| 45 to 64 Years | 35 (42.7%) | $124,625 |
| 65+ Years | 36 (43.9%) | $33,500 |
| Total | 82 (100.0%) | $0 |
Poverty in Lebam
Income Below Poverty by Sex and Age in Lebam
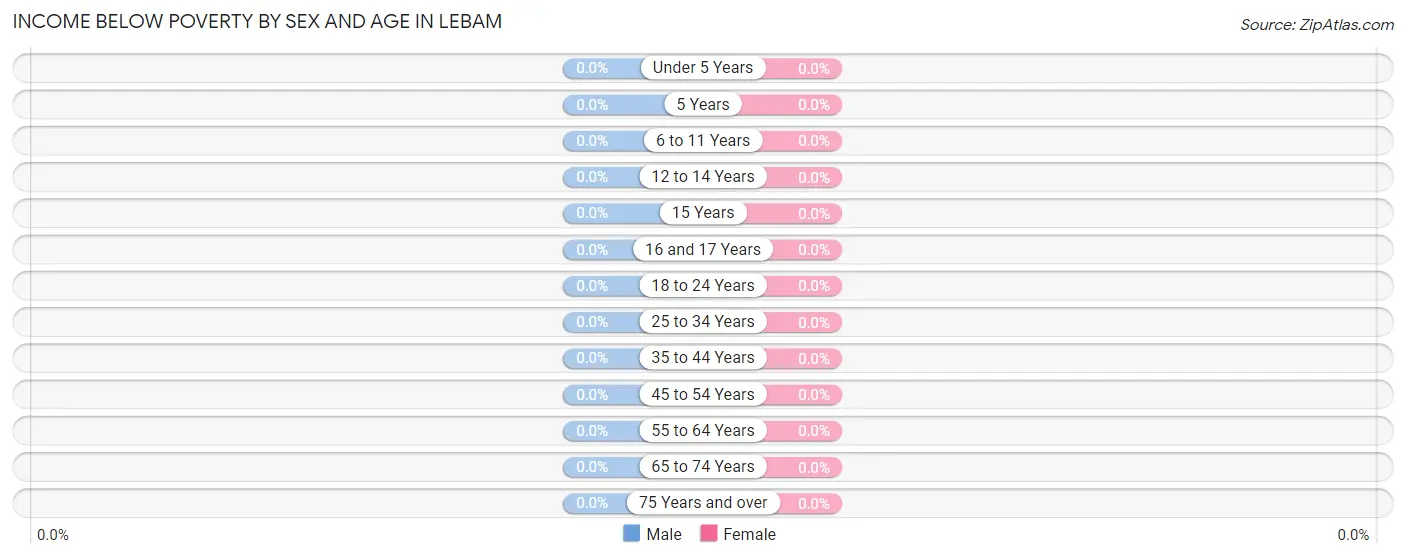
| Age Bracket | Male | Female |
| Under 5 Years | 0 (0.0%) | 0 (0.0%) |
| 5 Years | 0 (0.0%) | 0 (0.0%) |
| 6 to 11 Years | 0 (0.0%) | 0 (0.0%) |
| 12 to 14 Years | 0 (0.0%) | 0 (0.0%) |
| 15 Years | 0 (0.0%) | 0 (0.0%) |
| 16 and 17 Years | 0 (0.0%) | 0 (0.0%) |
| 18 to 24 Years | 0 (0.0%) | 0 (0.0%) |
| 25 to 34 Years | 0 (0.0%) | 0 (0.0%) |
| 35 to 44 Years | 0 (0.0%) | 0 (0.0%) |
| 45 to 54 Years | 0 (0.0%) | 0 (0.0%) |
| 55 to 64 Years | 0 (0.0%) | 0 (0.0%) |
| 65 to 74 Years | 0 (0.0%) | 0 (0.0%) |
| 75 Years and over | 0 (0.0%) | 0 (0.0%) |
| Total | 0 (0.0%) | 0 (0.0%) |
Income Above Poverty by Sex and Age in Lebam
According to the poverty statistics in Lebam, males aged 6 to 11 years and females aged 6 to 11 years are the age groups that are most secure financially, with 100.0% of males and 100.0% of females in these age groups living above the poverty line.
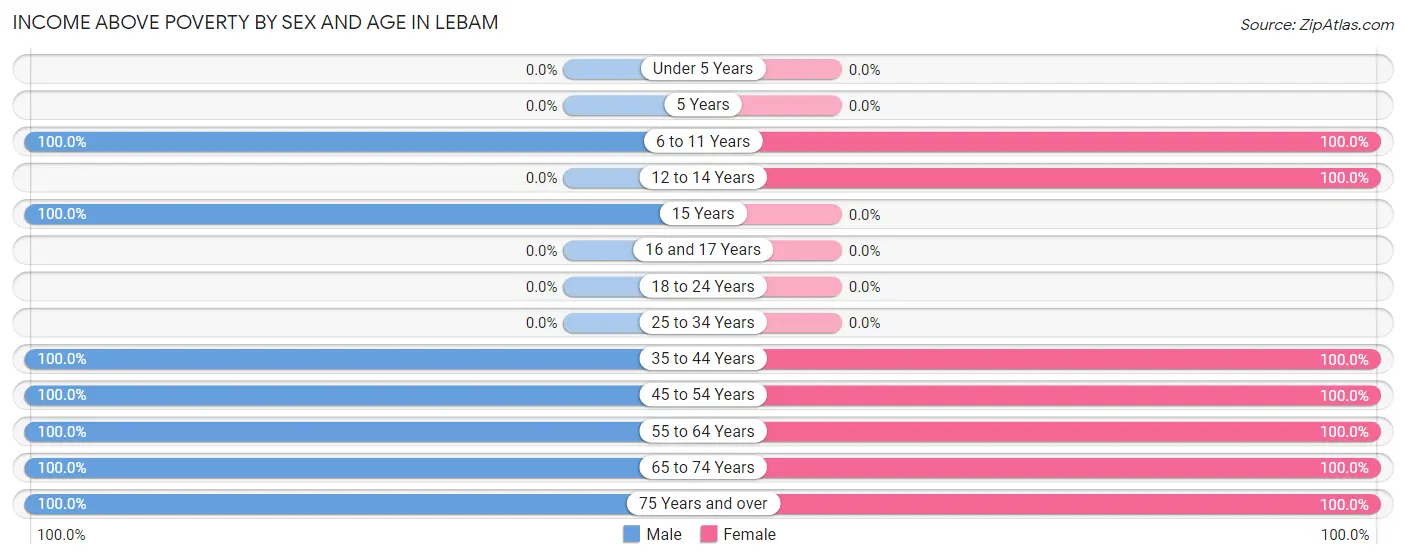
| Age Bracket | Male | Female |
| Under 5 Years | 0 (0.0%) | 0 (0.0%) |
| 5 Years | 0 (0.0%) | 0 (0.0%) |
| 6 to 11 Years | 3 (100.0%) | 8 (100.0%) |
| 12 to 14 Years | 0 (0.0%) | 4 (100.0%) |
| 15 Years | 4 (100.0%) | 0 (0.0%) |
| 16 and 17 Years | 0 (0.0%) | 0 (0.0%) |
| 18 to 24 Years | 0 (0.0%) | 0 (0.0%) |
| 25 to 34 Years | 0 (0.0%) | 0 (0.0%) |
| 35 to 44 Years | 5 (100.0%) | 13 (100.0%) |
| 45 to 54 Years | 5 (100.0%) | 16 (100.0%) |
| 55 to 64 Years | 35 (100.0%) | 21 (100.0%) |
| 65 to 74 Years | 5 (100.0%) | 4 (100.0%) |
| 75 Years and over | 31 (100.0%) | 14 (100.0%) |
| Total | 88 (100.0%) | 80 (100.0%) |
Income Below Poverty Among Married-Couple Families in Lebam
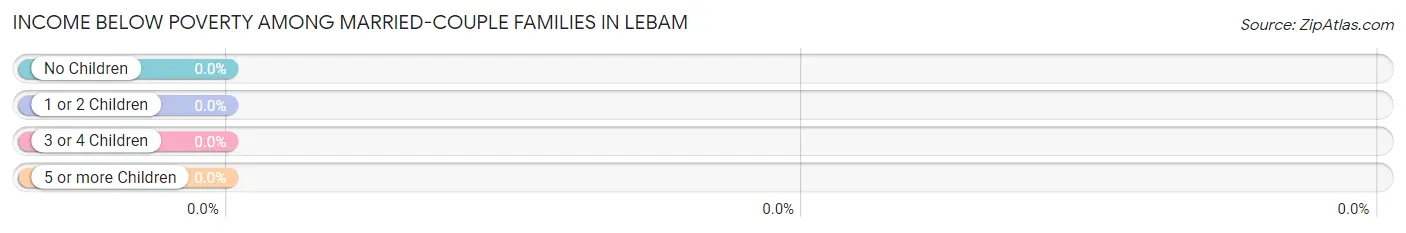
| Children | Above Poverty | Below Poverty |
| No Children | 46 (100.0%) | 0 (0.0%) |
| 1 or 2 Children | 5 (100.0%) | 0 (0.0%) |
| 3 or 4 Children | 6 (100.0%) | 0 (0.0%) |
| 5 or more Children | 0 (0.0%) | 0 (0.0%) |
| Total | 57 (100.0%) | 0 (0.0%) |
Income Below Poverty Among Single-Parent Households in Lebam
| Children | Single Father | Single Mother |
| No Children | 0 (0.0%) | 0 (0.0%) |
| 1 or 2 Children | 0 (0.0%) | 0 (0.0%) |
| 3 or 4 Children | 0 (0.0%) | 0 (0.0%) |
| 5 or more Children | 0 (0.0%) | 0 (0.0%) |
| Total | 0 (0.0%) | 0 (0.0%) |
Income Below Poverty Among Married-Couple vs Single-Parent Households in Lebam
| Children | Married-Couple Families | Single-Parent Households |
| No Children | 0 (0.0%) | 0 (0.0%) |
| 1 or 2 Children | 0 (0.0%) | 0 (0.0%) |
| 3 or 4 Children | 0 (0.0%) | 0 (0.0%) |
| 5 or more Children | 0 (0.0%) | 0 (0.0%) |
| Total | 0 (0.0%) | 0 (0.0%) |
Race in Lebam
The most populous races in Lebam are White / Caucasian (153 | 91.1%), and Two or more Races (15 | 8.9%).
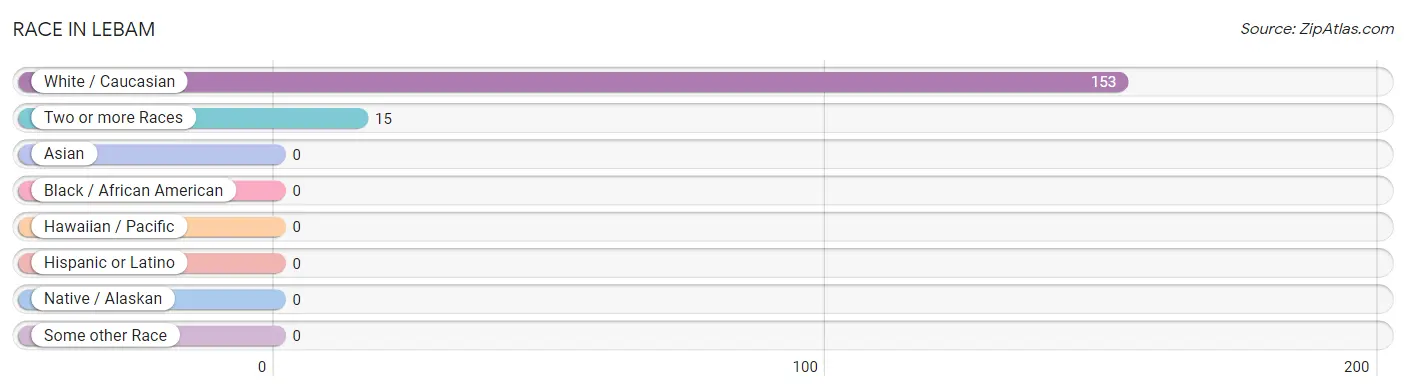
| Race | # Population | % Population |
| Asian | 0 | 0.0% |
| Black / African American | 0 | 0.0% |
| Hawaiian / Pacific | 0 | 0.0% |
| Hispanic or Latino | 0 | 0.0% |
| Native / Alaskan | 0 | 0.0% |
| White / Caucasian | 153 | 91.1% |
| Two or more Races | 15 | 8.9% |
| Some other Race | 0 | 0.0% |
| Total | 168 | 100.0% |
Ancestry in Lebam
The most populous ancestries reported in Lebam are German (57 | 33.9%), Italian (19 | 11.3%), English (16 | 9.5%), Scotch-Irish (16 | 9.5%), and Indian (Asian) (15 | 8.9%), together accounting for 73.2% of all Lebam residents.
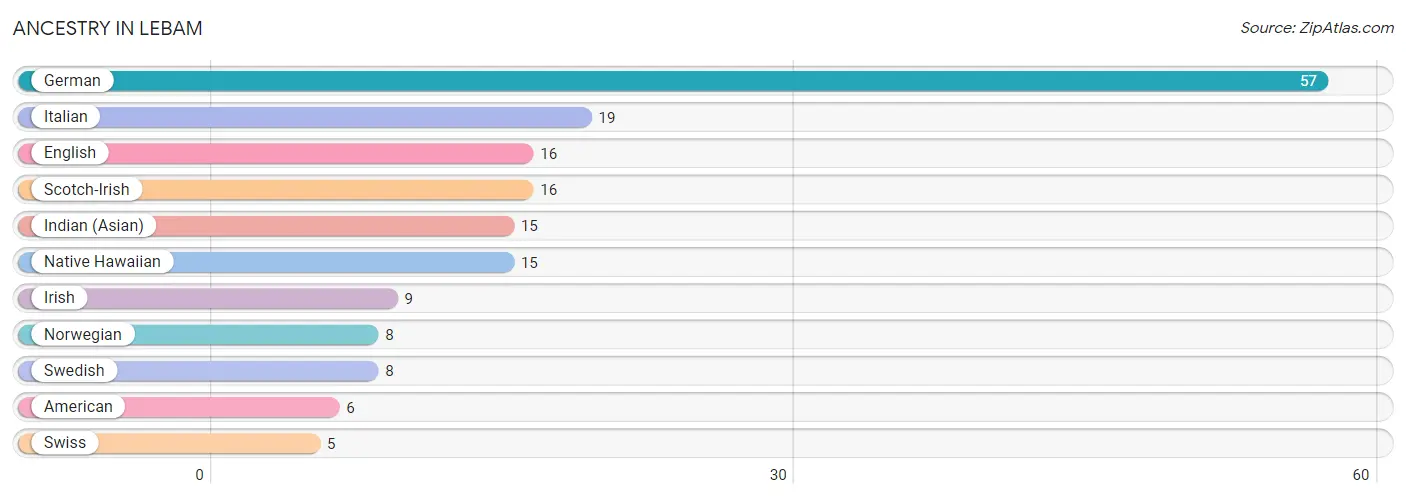
| Ancestry | # Population | % Population |
| American | 6 | 3.6% |
| English | 16 | 9.5% |
| German | 57 | 33.9% |
| Indian (Asian) | 15 | 8.9% |
| Irish | 9 | 5.4% |
| Italian | 19 | 11.3% |
| Native Hawaiian | 15 | 8.9% |
| Norwegian | 8 | 4.8% |
| Scotch-Irish | 16 | 9.5% |
| Swedish | 8 | 4.8% |
| Swiss | 5 | 3.0% | View All 11 Rows |
Immigrants in Lebam

| Immigration Origin | # Population | % Population | View All 0 Rows |
Sex and Age in Lebam
Sex and Age in Lebam
The most populous age groups in Lebam are 60 to 64 Years (19 | 21.6%) for men and 55 to 59 Years (21 | 26.3%) for women.
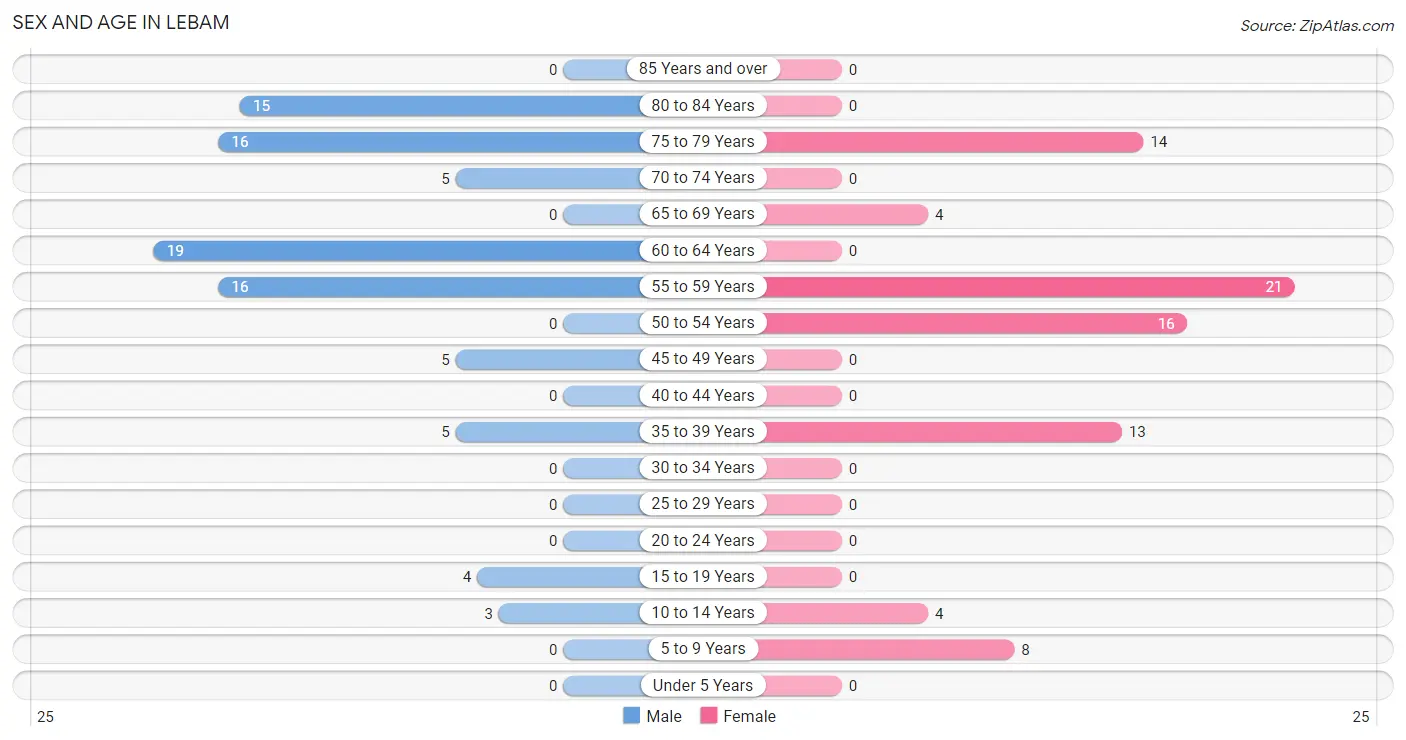
| Age Bracket | Male | Female |
| Under 5 Years | 0 (0.0%) | 0 (0.0%) |
| 5 to 9 Years | 0 (0.0%) | 8 (10.0%) |
| 10 to 14 Years | 3 (3.4%) | 4 (5.0%) |
| 15 to 19 Years | 4 (4.5%) | 0 (0.0%) |
| 20 to 24 Years | 0 (0.0%) | 0 (0.0%) |
| 25 to 29 Years | 0 (0.0%) | 0 (0.0%) |
| 30 to 34 Years | 0 (0.0%) | 0 (0.0%) |
| 35 to 39 Years | 5 (5.7%) | 13 (16.3%) |
| 40 to 44 Years | 0 (0.0%) | 0 (0.0%) |
| 45 to 49 Years | 5 (5.7%) | 0 (0.0%) |
| 50 to 54 Years | 0 (0.0%) | 16 (20.0%) |
| 55 to 59 Years | 16 (18.2%) | 21 (26.3%) |
| 60 to 64 Years | 19 (21.6%) | 0 (0.0%) |
| 65 to 69 Years | 0 (0.0%) | 4 (5.0%) |
| 70 to 74 Years | 5 (5.7%) | 0 (0.0%) |
| 75 to 79 Years | 16 (18.2%) | 14 (17.5%) |
| 80 to 84 Years | 15 (17.1%) | 0 (0.0%) |
| 85 Years and over | 0 (0.0%) | 0 (0.0%) |
| Total | 88 (100.0%) | 80 (100.0%) |
Families and Households in Lebam
Median Family Size in Lebam
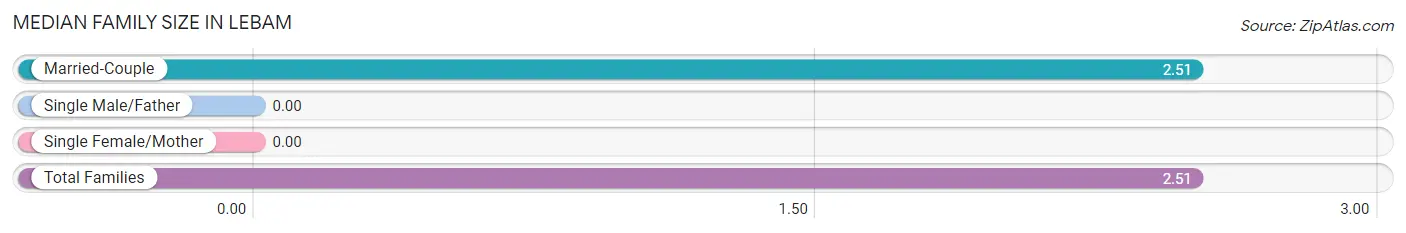
| Family Type | # Families | Family Size |
| Married-Couple | 57 (100.0%) | 2.51 |
| Single Male/Father | 0 (0.0%) | - |
| Single Female/Mother | 0 (0.0%) | - |
| Total Families | 57 (100.0%) | 2.51 |
Median Household Size in Lebam
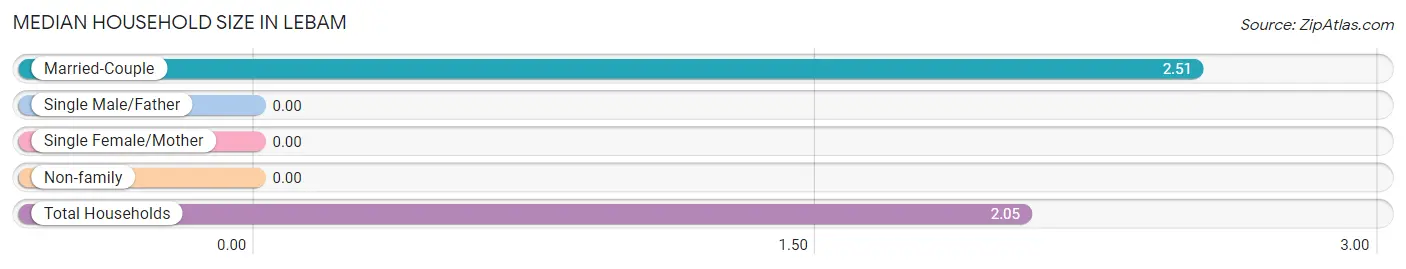
| Household Type | # Households | Household Size |
| Married-Couple | 57 (69.5%) | 2.51 |
| Single Male/Father | 0 (0.0%) | - |
| Single Female/Mother | 0 (0.0%) | - |
| Non-family | 25 (30.5%) | - |
| Total Households | 82 (100.0%) | 2.05 |
Household Size by Marriage Status in Lebam
Out of a total of 82 households in Lebam, 57 (69.5%) are family households, while 25 (30.5%) are nonfamily households. The most numerous type of family households are 2-person households, comprising 31, and the most common type of nonfamily households are 1-person households, comprising 25.
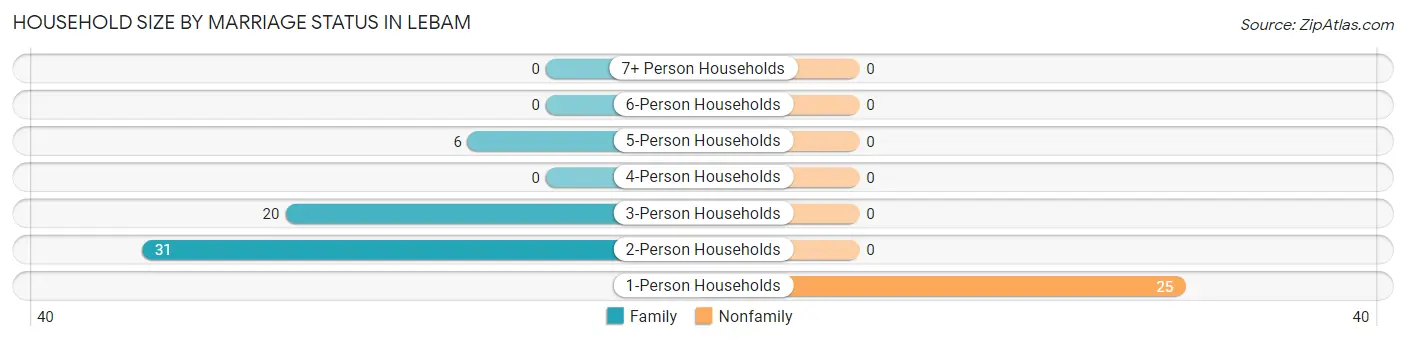
| Household Size | Family Households | Nonfamily Households |
| 1-Person Households | - | 25 (30.5%) |
| 2-Person Households | 31 (37.8%) | 0 (0.0%) |
| 3-Person Households | 20 (24.4%) | 0 (0.0%) |
| 4-Person Households | 0 (0.0%) | 0 (0.0%) |
| 5-Person Households | 6 (7.3%) | 0 (0.0%) |
| 6-Person Households | 0 (0.0%) | 0 (0.0%) |
| 7+ Person Households | 0 (0.0%) | 0 (0.0%) |
| Total | 57 (69.5%) | 25 (30.5%) |
Female Fertility in Lebam
Fertility by Age in Lebam
| Age Bracket | Women with Births | Births / 1,000 Women |
| 15 to 19 years | 0 (0.0%) | 0.0 |
| 20 to 34 years | 0 (0.0%) | 0.0 |
| 35 to 50 years | 0 (0.0%) | 0.0 |
| Total | 0 (0.0%) | 0.0 |
Fertility by Age by Marriage Status in Lebam
| Age Bracket | Married | Unmarried |
| 15 to 19 years | 0 (0.0%) | 0 (0.0%) |
| 20 to 34 years | 0 (0.0%) | 0 (0.0%) |
| 35 to 50 years | 0 (0.0%) | 0 (0.0%) |
| Total | 0 (0.0%) | 0 (0.0%) |
Fertility by Education in Lebam
| Educational Attainment | Women with Births | Births / 1,000 Women |
| Less than High School | 0 (0.0%) | 0.0 |
| High School Diploma | 0 (0.0%) | 0.0 |
| College or Associate's Degree | 0 (0.0%) | 0.0 |
| Bachelor's Degree | 0 (0.0%) | 0.0 |
| Graduate Degree | 0 (0.0%) | 0.0 |
| Total | 0 (0.0%) | 0.0 |
Fertility by Education by Marriage Status in Lebam
| Educational Attainment | Married | Unmarried |
| Less than High School | 0 (0.0%) | 0 (0.0%) |
| High School Diploma | 0 (0.0%) | 0 (0.0%) |
| College or Associate's Degree | 0 (0.0%) | 0 (0.0%) |
| Bachelor's Degree | 0 (0.0%) | 0 (0.0%) |
| Graduate Degree | 0 (0.0%) | 0 (0.0%) |
| Total | 0 (0.0%) | 0 (0.0%) |
Employment Characteristics in Lebam
Employment by Class of Employer in Lebam
Among the 68 employed individuals in Lebam, private company employees (36 | 52.9%), not-for-profit organizations (16 | 23.5%), and federal government employees (16 | 23.5%) make up the most common classes of employment.
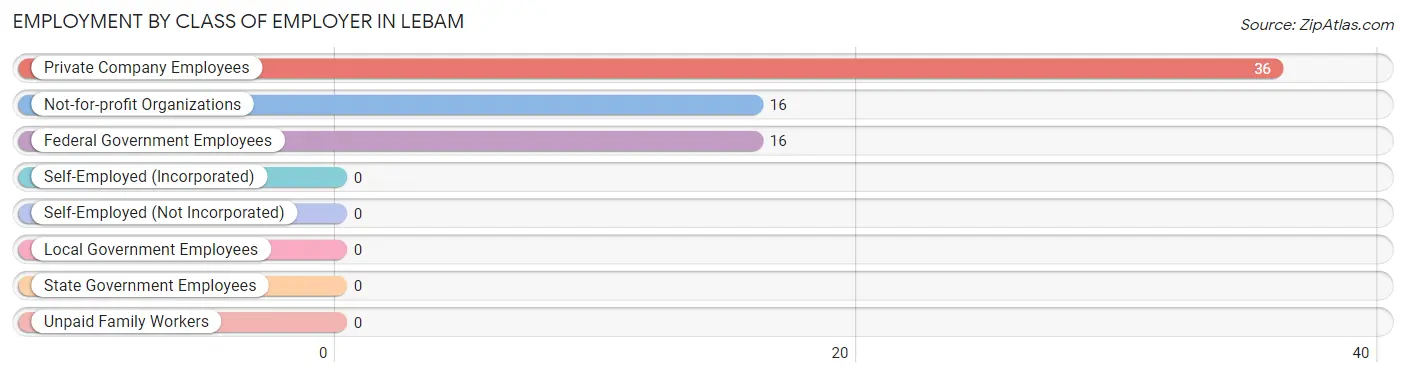
| Employer Class | # Employees | % Employees |
| Private Company Employees | 36 | 52.9% |
| Self-Employed (Incorporated) | 0 | 0.0% |
| Self-Employed (Not Incorporated) | 0 | 0.0% |
| Not-for-profit Organizations | 16 | 23.5% |
| Local Government Employees | 0 | 0.0% |
| State Government Employees | 0 | 0.0% |
| Federal Government Employees | 16 | 23.5% |
| Unpaid Family Workers | 0 | 0.0% |
| Total | 68 | 100.0% |
Employment Status by Age in Lebam
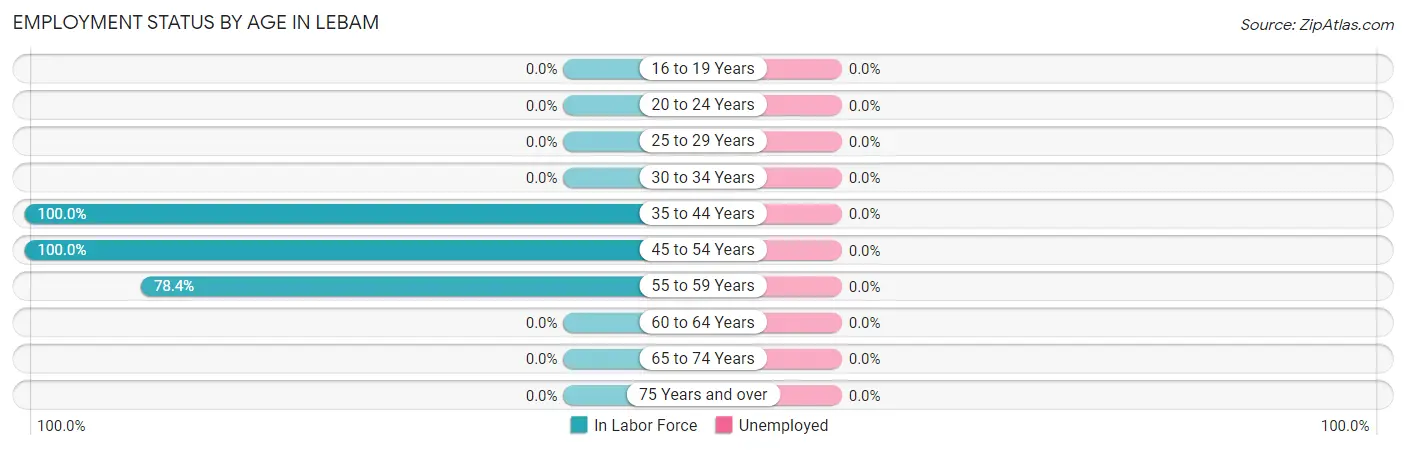
| Age Bracket | In Labor Force | Unemployed |
| 16 to 19 Years | 0 (0.0%) | 0 (0.0%) |
| 20 to 24 Years | 0 (0.0%) | 0 (0.0%) |
| 25 to 29 Years | 0 (0.0%) | 0 (0.0%) |
| 30 to 34 Years | 0 (0.0%) | 0 (0.0%) |
| 35 to 44 Years | 18 (100.0%) | 0 (0.0%) |
| 45 to 54 Years | 21 (100.0%) | 0 (0.0%) |
| 55 to 59 Years | 29 (78.4%) | 0 (0.0%) |
| 60 to 64 Years | 0 (0.0%) | 0 (0.0%) |
| 65 to 74 Years | 0 (0.0%) | 0 (0.0%) |
| 75 Years and over | 0 (0.0%) | 0 (0.0%) |
| Total | 68 (45.6%) | 0 (0.0%) |
Employment Status by Educational Attainment in Lebam
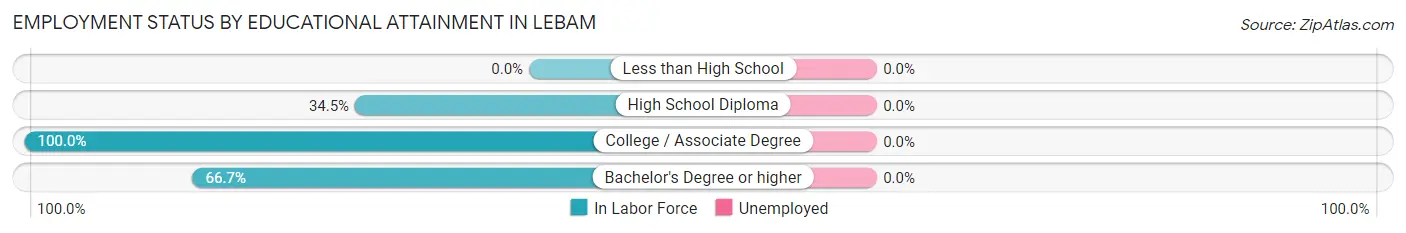
| Educational Attainment | In Labor Force | Unemployed |
| Less than High School | 0 (0.0%) | 0 (0.0%) |
| High School Diploma | 10 (34.5%) | 0 (0.0%) |
| College / Associate Degree | 42 (100.0%) | 0 (0.0%) |
| Bachelor's Degree or higher | 16 (66.7%) | 0 (0.0%) |
| Total | 68 (71.6%) | 0 (0.0%) |
Employment Occupations by Sex in Lebam
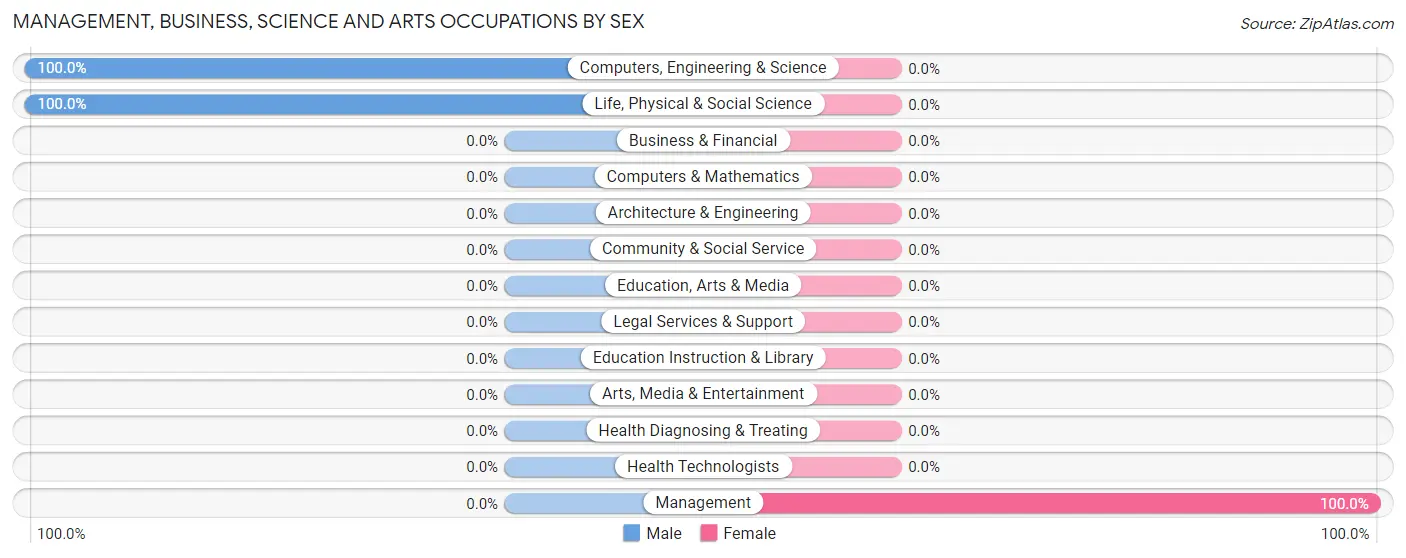
Management, Business, Science and Arts Occupations
The most common Management, Business, Science and Arts occupations in Lebam are Management (16 | 23.5%), Computers, Engineering & Science (16 | 23.5%), and Life, Physical & Social Science (16 | 23.5%).
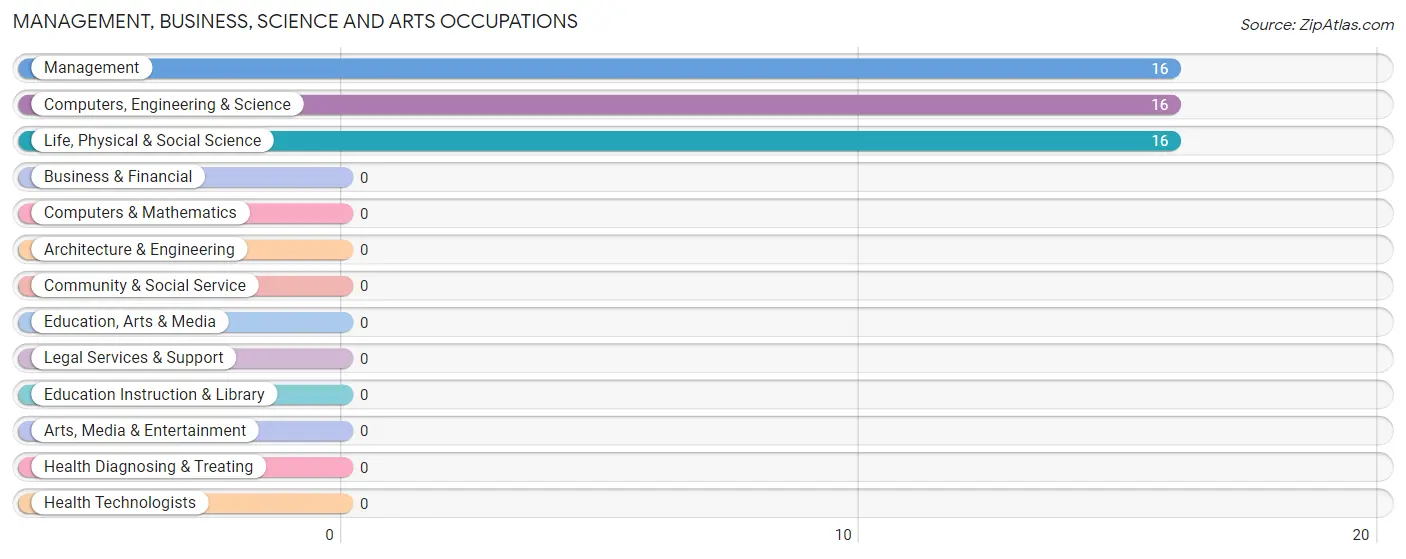
Management, Business, Science and Arts Occupations by Sex
| Occupation | Male | Female |
| Management | 0 (0.0%) | 16 (100.0%) |
| Business & Financial | 0 (0.0%) | 0 (0.0%) |
| Computers, Engineering & Science | 16 (100.0%) | 0 (0.0%) |
| Computers & Mathematics | 0 (0.0%) | 0 (0.0%) |
| Architecture & Engineering | 0 (0.0%) | 0 (0.0%) |
| Life, Physical & Social Science | 16 (100.0%) | 0 (0.0%) |
| Community & Social Service | 0 (0.0%) | 0 (0.0%) |
| Education, Arts & Media | 0 (0.0%) | 0 (0.0%) |
| Legal Services & Support | 0 (0.0%) | 0 (0.0%) |
| Education Instruction & Library | 0 (0.0%) | 0 (0.0%) |
| Arts, Media & Entertainment | 0 (0.0%) | 0 (0.0%) |
| Health Diagnosing & Treating | 0 (0.0%) | 0 (0.0%) |
| Health Technologists | 0 (0.0%) | 0 (0.0%) |
| Total (Category) | 16 (50.0%) | 16 (50.0%) |
| Total (Overall) | 26 (38.2%) | 42 (61.8%) |
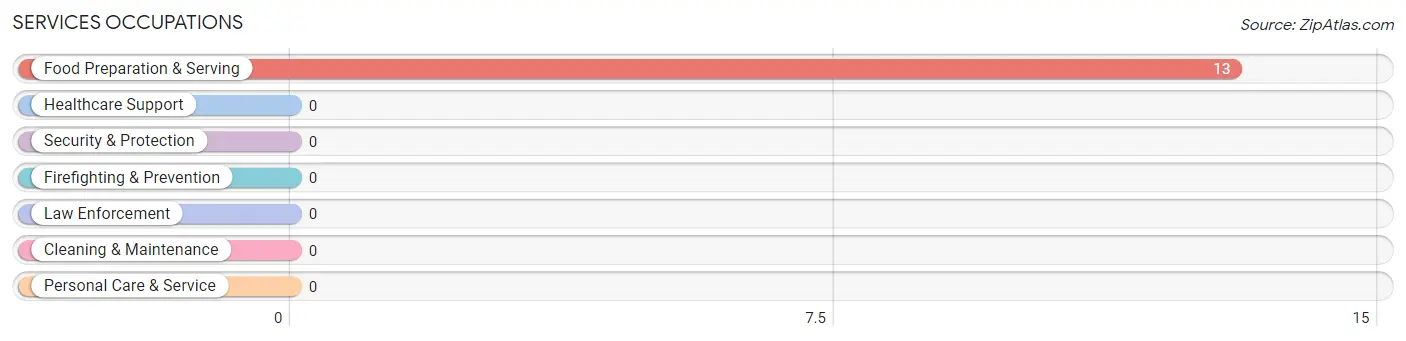
Services Occupations
The most common Services occupations in Lebam are , and Food Preparation & Serving (13 | 19.1%).
Services Occupations by Sex
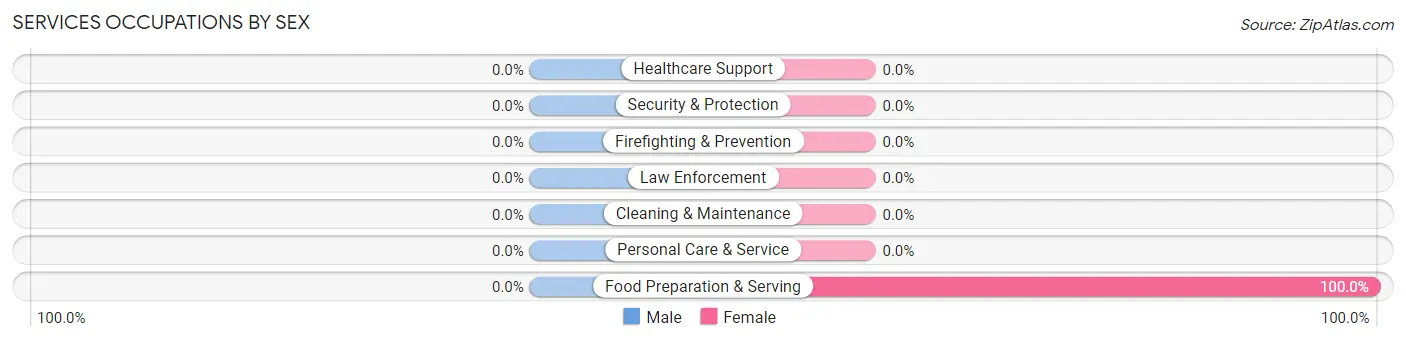
| Occupation | Male | Female |
| Healthcare Support | 0 (0.0%) | 0 (0.0%) |
| Security & Protection | 0 (0.0%) | 0 (0.0%) |
| Firefighting & Prevention | 0 (0.0%) | 0 (0.0%) |
| Law Enforcement | 0 (0.0%) | 0 (0.0%) |
| Food Preparation & Serving | 0 (0.0%) | 13 (100.0%) |
| Cleaning & Maintenance | 0 (0.0%) | 0 (0.0%) |
| Personal Care & Service | 0 (0.0%) | 0 (0.0%) |
| Total (Category) | 0 (0.0%) | 13 (100.0%) |
| Total (Overall) | 26 (38.2%) | 42 (61.8%) |
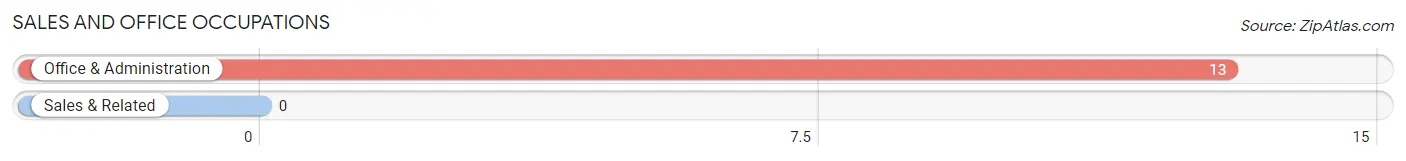
Sales and Office Occupations
The most common Sales and Office occupations in Lebam are , and Office & Administration (13 | 19.1%).
Sales and Office Occupations by Sex
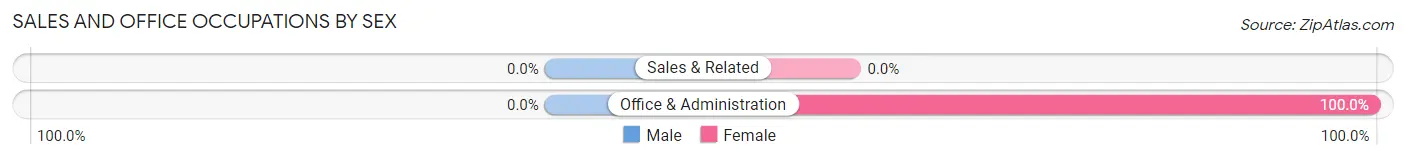
| Occupation | Male | Female |
| Sales & Related | 0 (0.0%) | 0 (0.0%) |
| Office & Administration | 0 (0.0%) | 13 (100.0%) |
| Total (Category) | 0 (0.0%) | 13 (100.0%) |
| Total (Overall) | 26 (38.2%) | 42 (61.8%) |
Natural Resources, Construction and Maintenance Occupations
The most common Natural Resources, Construction and Maintenance occupations in Lebam are Construction & Extraction (5 | 7.3%), and Installation, Maintenance & Repair (5 | 7.3%).
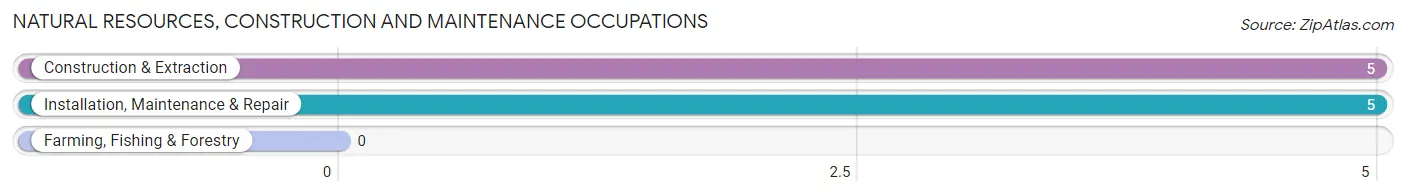
Natural Resources, Construction and Maintenance Occupations by Sex
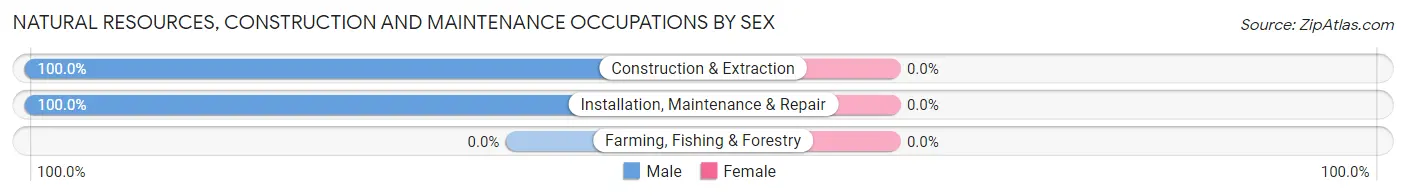
| Occupation | Male | Female |
| Farming, Fishing & Forestry | 0 (0.0%) | 0 (0.0%) |
| Construction & Extraction | 5 (100.0%) | 0 (0.0%) |
| Installation, Maintenance & Repair | 5 (100.0%) | 0 (0.0%) |
| Total (Category) | 10 (100.0%) | 0 (0.0%) |
| Total (Overall) | 26 (38.2%) | 42 (61.8%) |
Production, Transportation and Moving Occupations
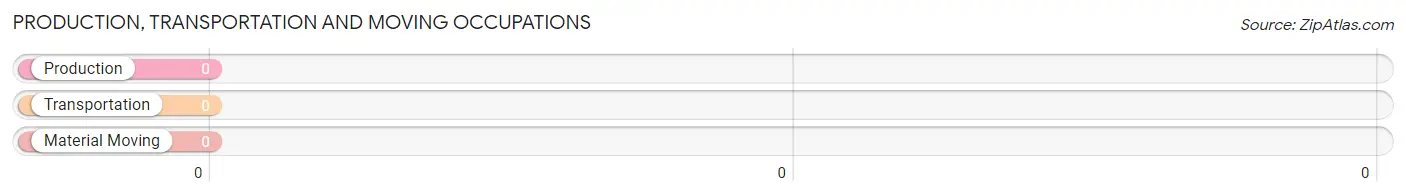
Production, Transportation and Moving Occupations by Sex
| Occupation | Male | Female |
| Production | 0 (0.0%) | 0 (0.0%) |
| Transportation | 0 (0.0%) | 0 (0.0%) |
| Material Moving | 0 (0.0%) | 0 (0.0%) |
| Total (Category) | 0 (0.0%) | 0 (0.0%) |
| Total (Overall) | 26 (38.2%) | 42 (61.8%) |
Employment Industries by Sex in Lebam
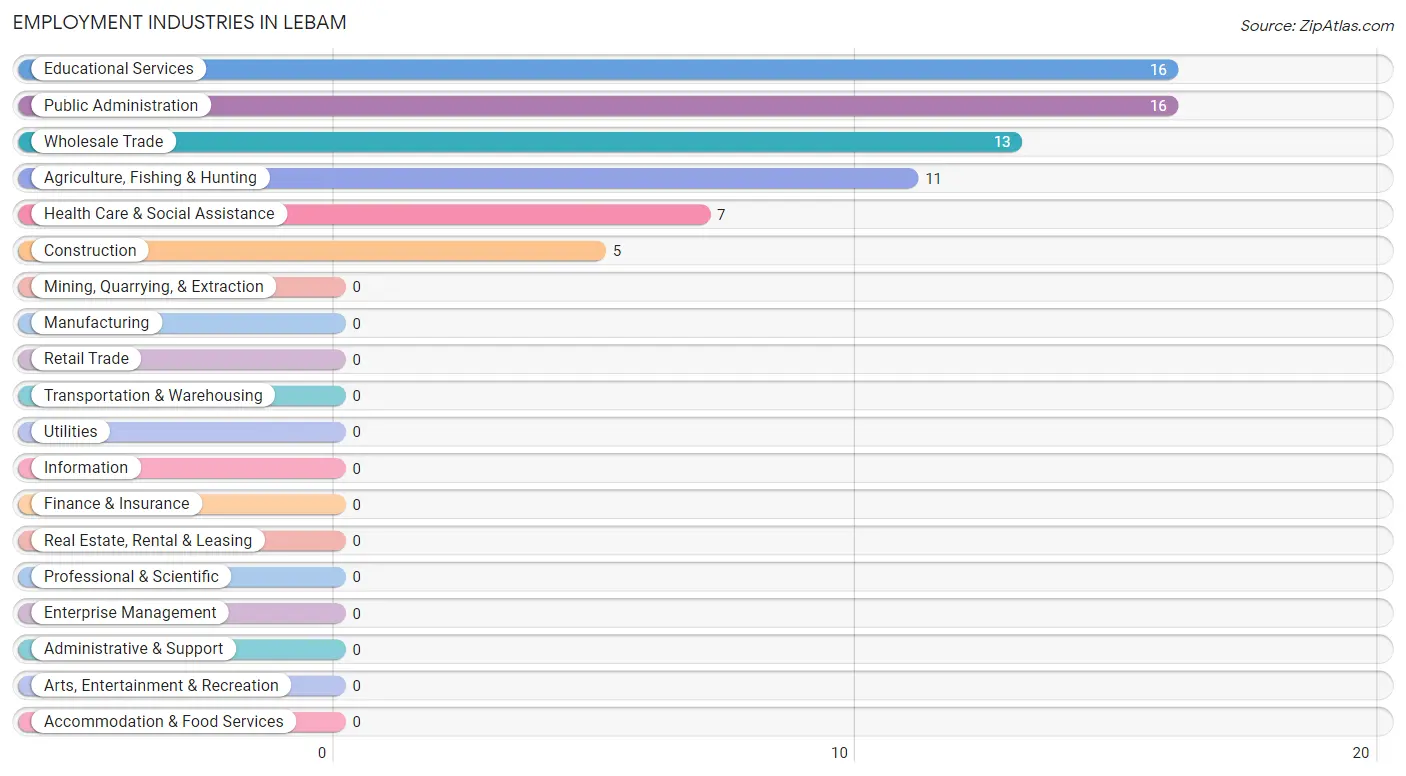
Employment Industries in Lebam
The major employment industries in Lebam include Educational Services (16 | 23.5%), Public Administration (16 | 23.5%), Wholesale Trade (13 | 19.1%), Agriculture, Fishing & Hunting (11 | 16.2%), and Health Care & Social Assistance (7 | 10.3%).
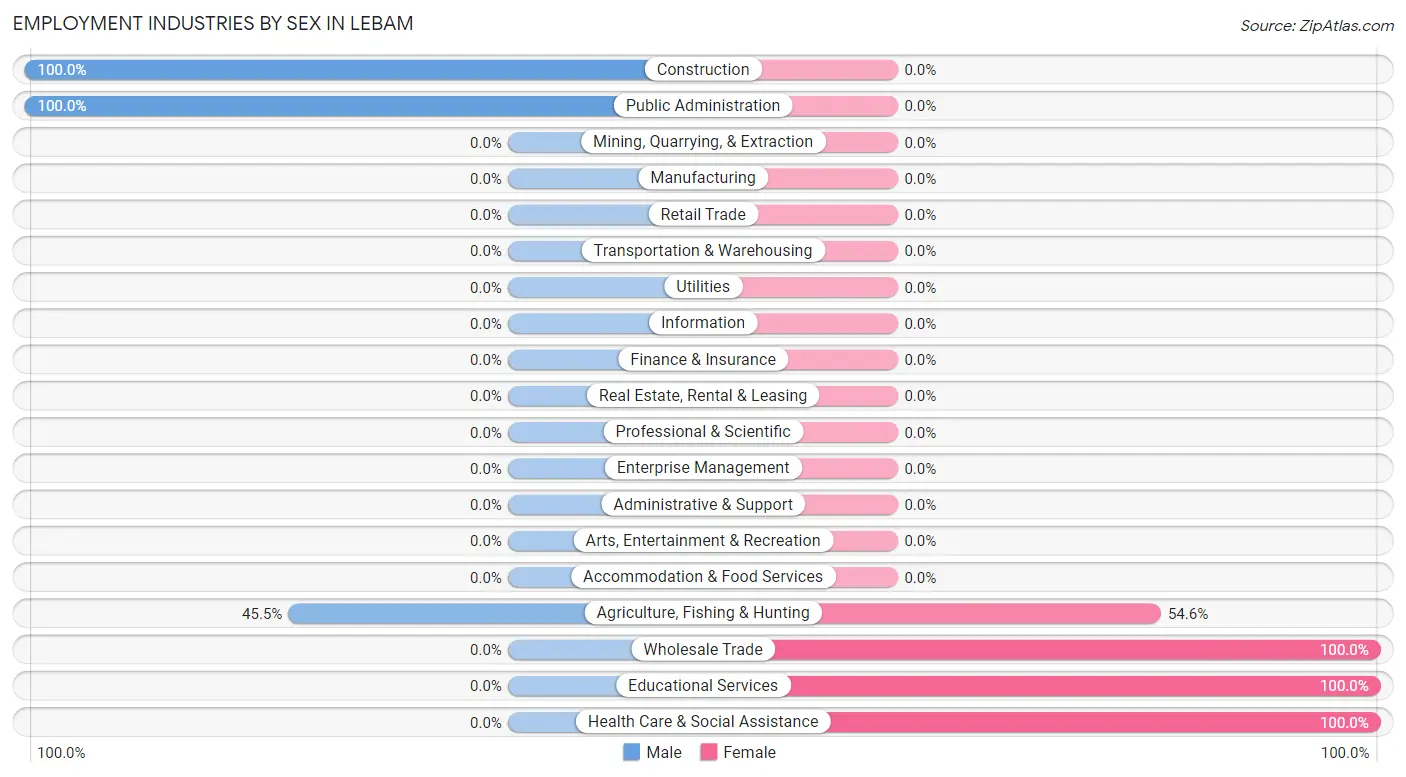
Employment Industries by Sex in Lebam
The Lebam industries that see more men than women are Construction (100.0%), Public Administration (100.0%), and Agriculture, Fishing & Hunting (45.5%), whereas the industries that tend to have a higher number of women are Wholesale Trade (100.0%), Educational Services (100.0%), and Health Care & Social Assistance (100.0%).
| Industry | Male | Female |
| Agriculture, Fishing & Hunting | 5 (45.5%) | 6 (54.5%) |
| Mining, Quarrying, & Extraction | 0 (0.0%) | 0 (0.0%) |
| Construction | 5 (100.0%) | 0 (0.0%) |
| Manufacturing | 0 (0.0%) | 0 (0.0%) |
| Wholesale Trade | 0 (0.0%) | 13 (100.0%) |
| Retail Trade | 0 (0.0%) | 0 (0.0%) |
| Transportation & Warehousing | 0 (0.0%) | 0 (0.0%) |
| Utilities | 0 (0.0%) | 0 (0.0%) |
| Information | 0 (0.0%) | 0 (0.0%) |
| Finance & Insurance | 0 (0.0%) | 0 (0.0%) |
| Real Estate, Rental & Leasing | 0 (0.0%) | 0 (0.0%) |
| Professional & Scientific | 0 (0.0%) | 0 (0.0%) |
| Enterprise Management | 0 (0.0%) | 0 (0.0%) |
| Administrative & Support | 0 (0.0%) | 0 (0.0%) |
| Educational Services | 0 (0.0%) | 16 (100.0%) |
| Health Care & Social Assistance | 0 (0.0%) | 7 (100.0%) |
| Arts, Entertainment & Recreation | 0 (0.0%) | 0 (0.0%) |
| Accommodation & Food Services | 0 (0.0%) | 0 (0.0%) |
| Public Administration | 16 (100.0%) | 0 (0.0%) |
| Total | 26 (38.2%) | 42 (61.8%) |
Education in Lebam
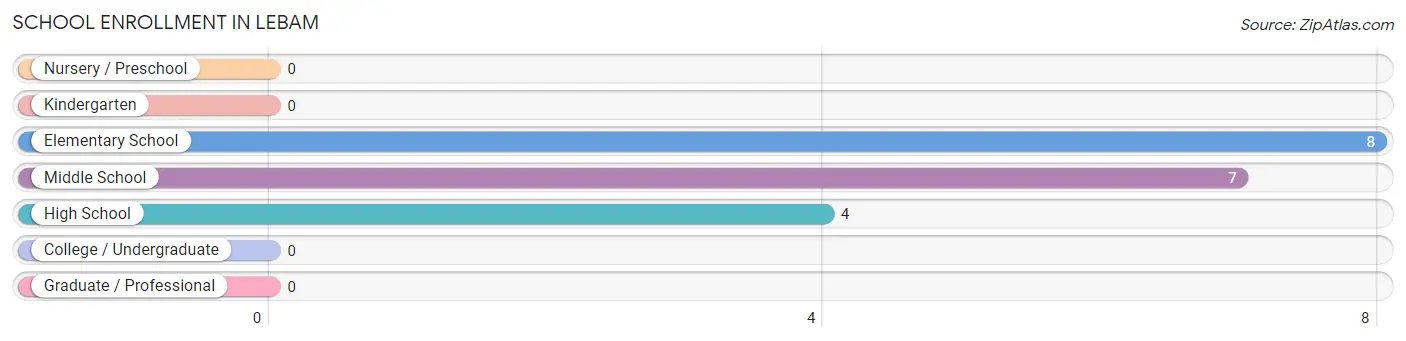
School Enrollment in Lebam
The most common levels of schooling among the 19 students in Lebam are elementary school (8 | 42.1%), middle school (7 | 36.8%), and high school (4 | 21.0%).
| School Level | # Students | % Students |
| Nursery / Preschool | 0 | 0.0% |
| Kindergarten | 0 | 0.0% |
| Elementary School | 8 | 42.1% |
| Middle School | 7 | 36.8% |
| High School | 4 | 21.0% |
| College / Undergraduate | 0 | 0.0% |
| Graduate / Professional | 0 | 0.0% |
| Total | 19 | 100.0% |
School Enrollment by Age by Funding Source in Lebam
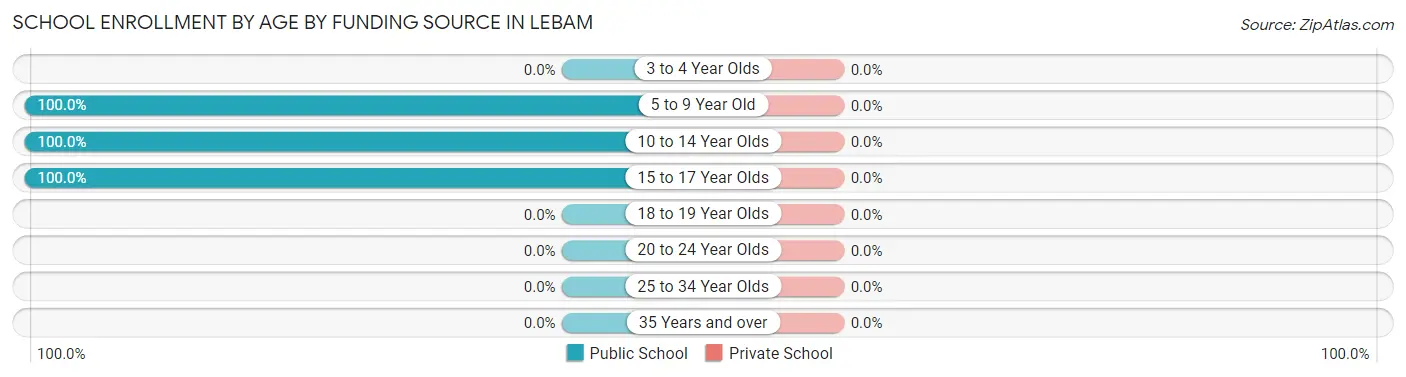
| Age Bracket | Public School | Private School |
| 3 to 4 Year Olds | 0 (0.0%) | 0 (0.0%) |
| 5 to 9 Year Old | 8 (100.0%) | 0 (0.0%) |
| 10 to 14 Year Olds | 7 (100.0%) | 0 (0.0%) |
| 15 to 17 Year Olds | 4 (100.0%) | 0 (0.0%) |
| 18 to 19 Year Olds | 0 (0.0%) | 0 (0.0%) |
| 20 to 24 Year Olds | 0 (0.0%) | 0 (0.0%) |
| 25 to 34 Year Olds | 0 (0.0%) | 0 (0.0%) |
| 35 Years and over | 0 (0.0%) | 0 (0.0%) |
| Total | 19 (100.0%) | 0 (0.0%) |
Educational Attainment by Field of Study in Lebam
Business (16 | 66.7%), and education (8 | 33.3%) are the most common fields of study among 24 individuals in Lebam who have obtained a bachelor's degree or higher.
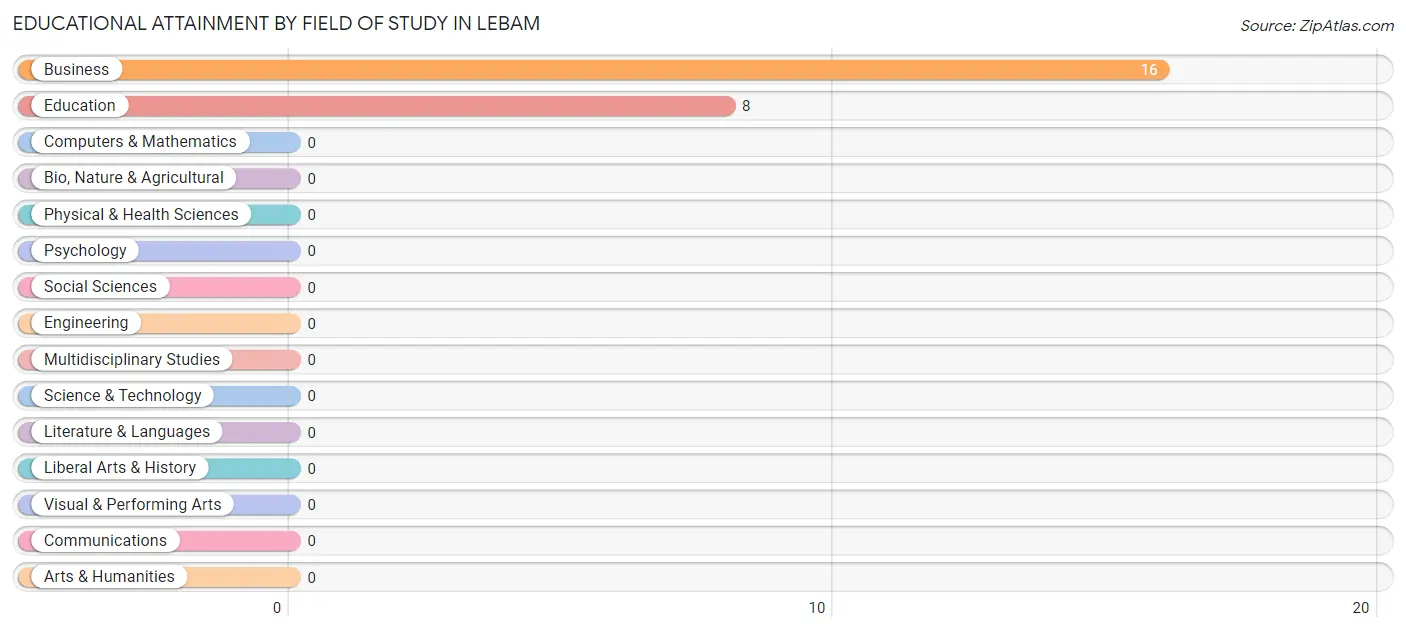
| Field of Study | # Graduates | % Graduates |
| Computers & Mathematics | 0 | 0.0% |
| Bio, Nature & Agricultural | 0 | 0.0% |
| Physical & Health Sciences | 0 | 0.0% |
| Psychology | 0 | 0.0% |
| Social Sciences | 0 | 0.0% |
| Engineering | 0 | 0.0% |
| Multidisciplinary Studies | 0 | 0.0% |
| Science & Technology | 0 | 0.0% |
| Business | 16 | 66.7% |
| Education | 8 | 33.3% |
| Literature & Languages | 0 | 0.0% |
| Liberal Arts & History | 0 | 0.0% |
| Visual & Performing Arts | 0 | 0.0% |
| Communications | 0 | 0.0% |
| Arts & Humanities | 0 | 0.0% |
| Total | 24 | 100.0% |
Transportation & Commute in Lebam
Vehicle Availability by Sex in Lebam
The most prevalent vehicle ownership categories in Lebam are males with 3 vehicles (16, accounting for 61.5%) and females with 3 vehicles (16, making up 38.1%).
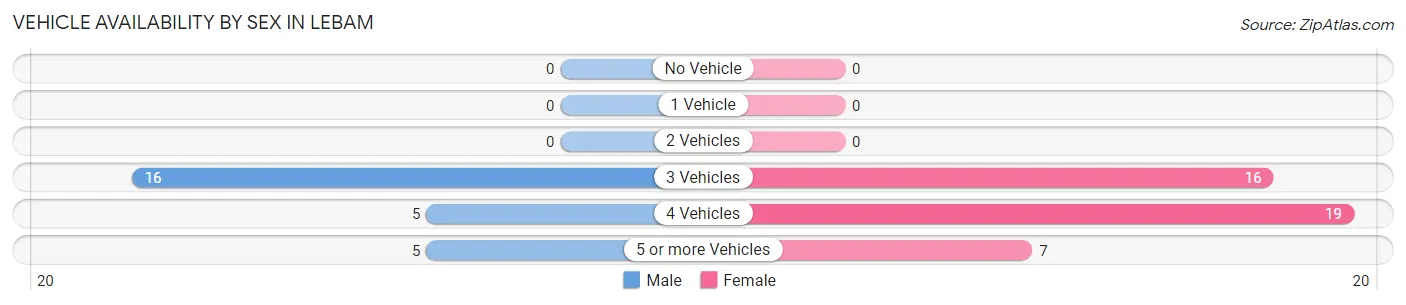
| Vehicles Available | Male | Female |
| No Vehicle | 0 (0.0%) | 0 (0.0%) |
| 1 Vehicle | 0 (0.0%) | 0 (0.0%) |
| 2 Vehicles | 0 (0.0%) | 0 (0.0%) |
| 3 Vehicles | 16 (61.5%) | 16 (38.1%) |
| 4 Vehicles | 5 (19.2%) | 19 (45.2%) |
| 5 or more Vehicles | 5 (19.2%) | 7 (16.7%) |
| Total | 26 (100.0%) | 42 (100.0%) |
Commute Time in Lebam
The most frequently occuring commute durations in Lebam are 30 to 34 minutes (23 commuters, 33.8%), 15 to 19 minutes (21 commuters, 30.9%), and less than 5 minutes (18 commuters, 26.5%).
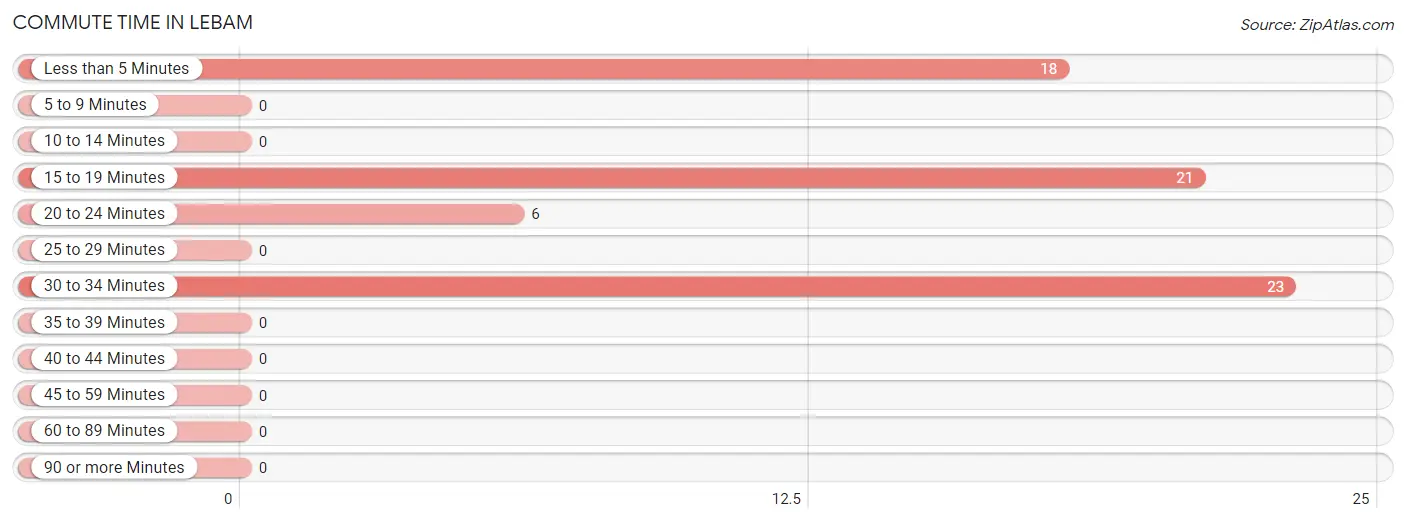
| Commute Time | # Commuters | % Commuters |
| Less than 5 Minutes | 18 | 26.5% |
| 5 to 9 Minutes | 0 | 0.0% |
| 10 to 14 Minutes | 0 | 0.0% |
| 15 to 19 Minutes | 21 | 30.9% |
| 20 to 24 Minutes | 6 | 8.8% |
| 25 to 29 Minutes | 0 | 0.0% |
| 30 to 34 Minutes | 23 | 33.8% |
| 35 to 39 Minutes | 0 | 0.0% |
| 40 to 44 Minutes | 0 | 0.0% |
| 45 to 59 Minutes | 0 | 0.0% |
| 60 to 89 Minutes | 0 | 0.0% |
| 90 or more Minutes | 0 | 0.0% |
Commute Time by Sex in Lebam
The most common commute times in Lebam are 15 to 19 minutes (21 commuters, 80.8%) for males and 30 to 34 minutes (23 commuters, 54.8%) for females.
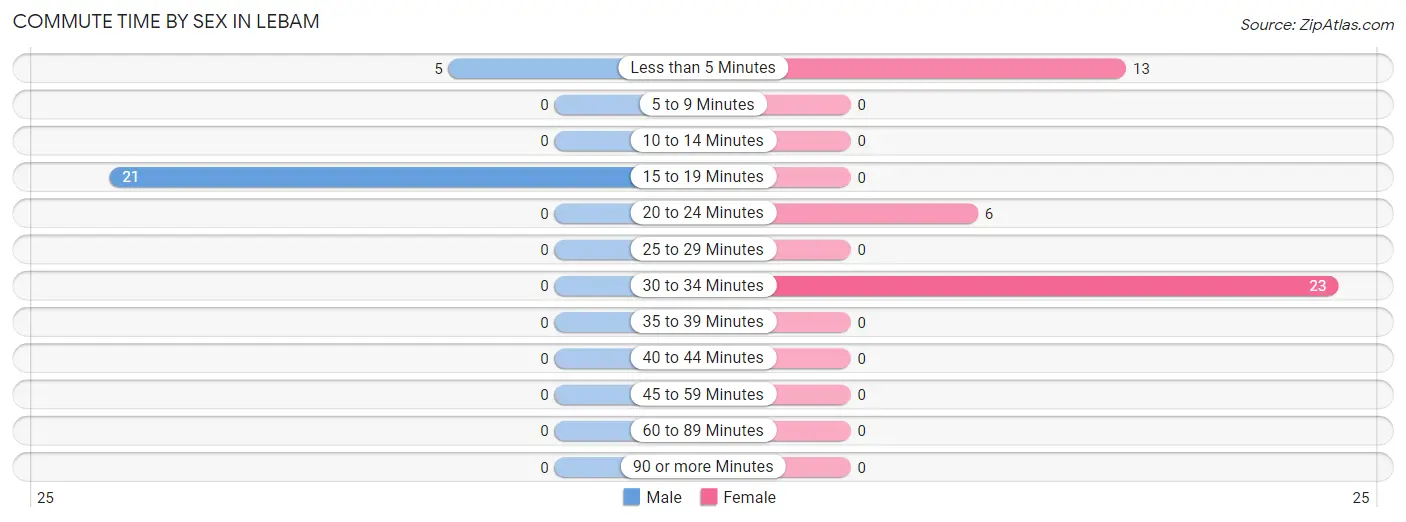
| Commute Time | Male | Female |
| Less than 5 Minutes | 5 (19.2%) | 13 (30.9%) |
| 5 to 9 Minutes | 0 (0.0%) | 0 (0.0%) |
| 10 to 14 Minutes | 0 (0.0%) | 0 (0.0%) |
| 15 to 19 Minutes | 21 (80.8%) | 0 (0.0%) |
| 20 to 24 Minutes | 0 (0.0%) | 6 (14.3%) |
| 25 to 29 Minutes | 0 (0.0%) | 0 (0.0%) |
| 30 to 34 Minutes | 0 (0.0%) | 23 (54.8%) |
| 35 to 39 Minutes | 0 (0.0%) | 0 (0.0%) |
| 40 to 44 Minutes | 0 (0.0%) | 0 (0.0%) |
| 45 to 59 Minutes | 0 (0.0%) | 0 (0.0%) |
| 60 to 89 Minutes | 0 (0.0%) | 0 (0.0%) |
| 90 or more Minutes | 0 (0.0%) | 0 (0.0%) |
Time of Departure to Work by Sex in Lebam
The most frequent times of departure to work in Lebam are 6:30 AM to 6:59 AM (16, 61.5%) for males and 7:00 AM to 7:29 AM (16, 38.1%) for females.
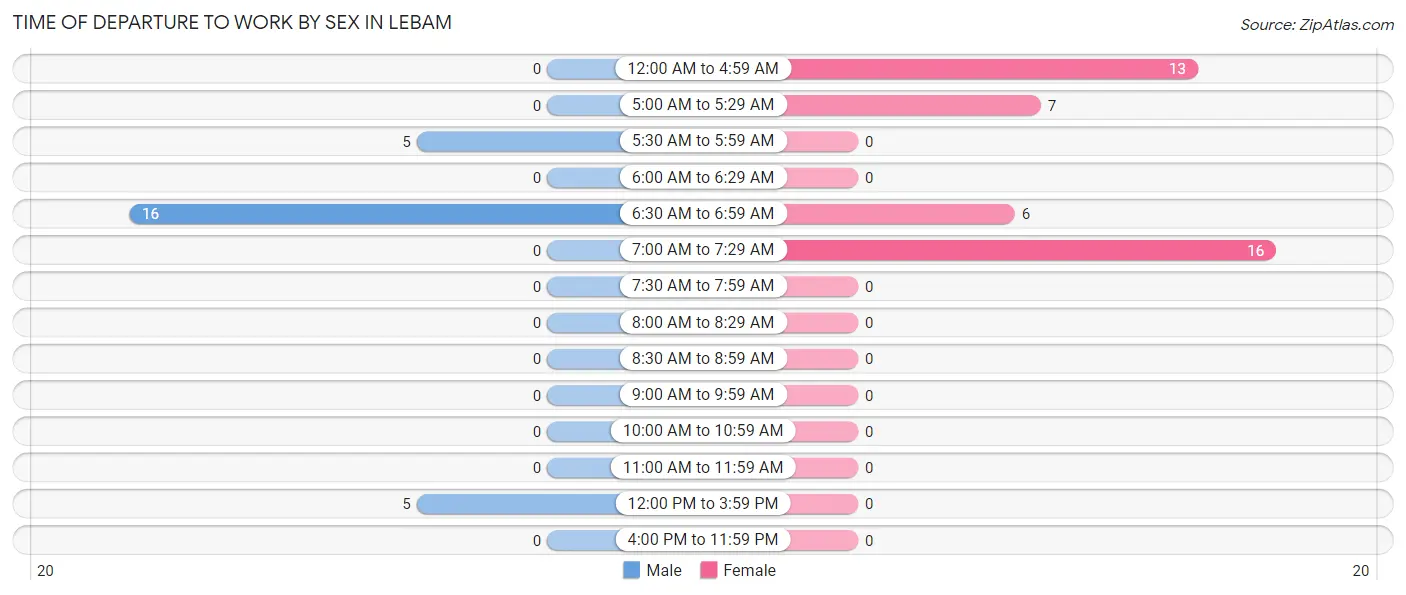
| Time of Departure | Male | Female |
| 12:00 AM to 4:59 AM | 0 (0.0%) | 13 (30.9%) |
| 5:00 AM to 5:29 AM | 0 (0.0%) | 7 (16.7%) |
| 5:30 AM to 5:59 AM | 5 (19.2%) | 0 (0.0%) |
| 6:00 AM to 6:29 AM | 0 (0.0%) | 0 (0.0%) |
| 6:30 AM to 6:59 AM | 16 (61.5%) | 6 (14.3%) |
| 7:00 AM to 7:29 AM | 0 (0.0%) | 16 (38.1%) |
| 7:30 AM to 7:59 AM | 0 (0.0%) | 0 (0.0%) |
| 8:00 AM to 8:29 AM | 0 (0.0%) | 0 (0.0%) |
| 8:30 AM to 8:59 AM | 0 (0.0%) | 0 (0.0%) |
| 9:00 AM to 9:59 AM | 0 (0.0%) | 0 (0.0%) |
| 10:00 AM to 10:59 AM | 0 (0.0%) | 0 (0.0%) |
| 11:00 AM to 11:59 AM | 0 (0.0%) | 0 (0.0%) |
| 12:00 PM to 3:59 PM | 5 (19.2%) | 0 (0.0%) |
| 4:00 PM to 11:59 PM | 0 (0.0%) | 0 (0.0%) |
| Total | 26 (100.0%) | 42 (100.0%) |
Housing Occupancy in Lebam
Occupancy by Ownership in Lebam
Of the total 82 dwellings in Lebam, owner-occupied units account for 82 (100.0%), while renter-occupied units make up 0 (0.0%).
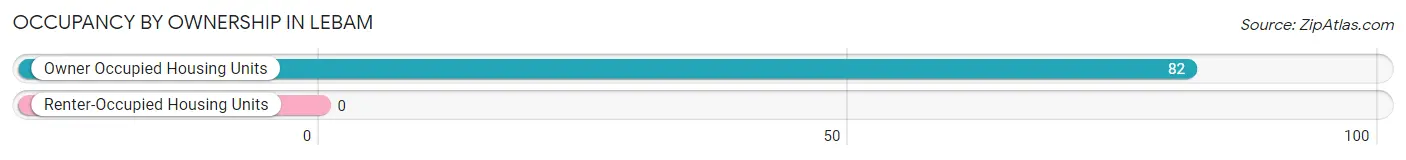
| Occupancy | # Housing Units | % Housing Units |
| Owner Occupied Housing Units | 82 | 100.0% |
| Renter-Occupied Housing Units | 0 | 0.0% |
| Total Occupied Housing Units | 82 | 100.0% |
Occupancy by Household Size in Lebam
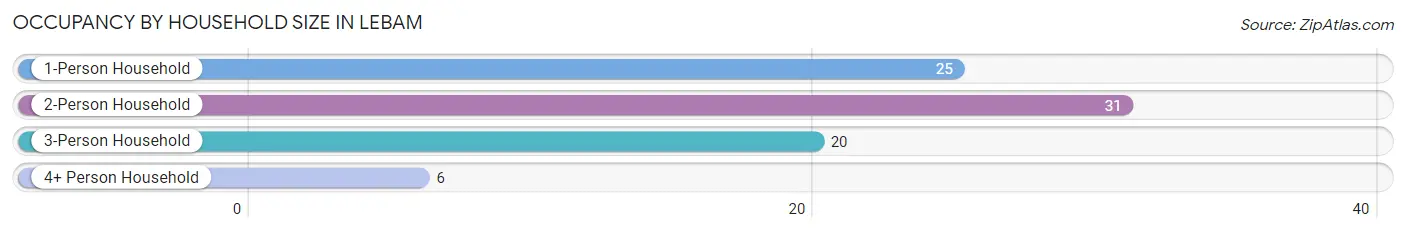
| Household Size | # Housing Units | % Housing Units |
| 1-Person Household | 25 | 30.5% |
| 2-Person Household | 31 | 37.8% |
| 3-Person Household | 20 | 24.4% |
| 4+ Person Household | 6 | 7.3% |
| Total Housing Units | 82 | 100.0% |
Occupancy by Ownership by Household Size in Lebam
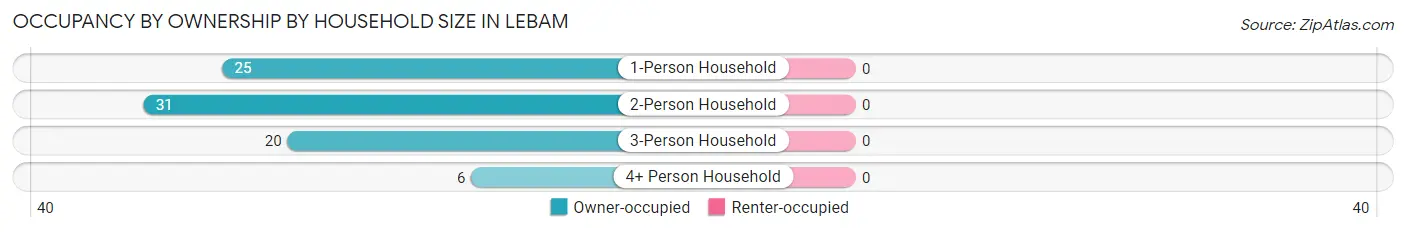
| Household Size | Owner-occupied | Renter-occupied |
| 1-Person Household | 25 (100.0%) | 0 (0.0%) |
| 2-Person Household | 31 (100.0%) | 0 (0.0%) |
| 3-Person Household | 20 (100.0%) | 0 (0.0%) |
| 4+ Person Household | 6 (100.0%) | 0 (0.0%) |
| Total Housing Units | 82 (100.0%) | 0 (0.0%) |
Occupancy by Educational Attainment in Lebam
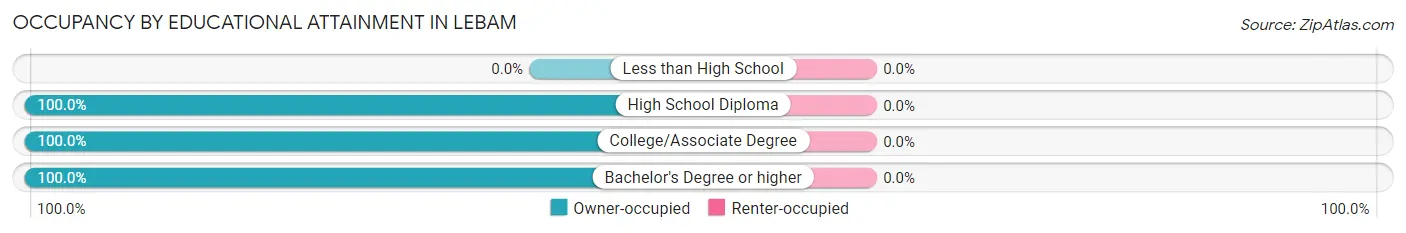
| Household Size | Owner-occupied | Renter-occupied |
| Less than High School | 0 (0.0%) | 0 (0.0%) |
| High School Diploma | 29 (100.0%) | 0 (0.0%) |
| College/Associate Degree | 37 (100.0%) | 0 (0.0%) |
| Bachelor's Degree or higher | 16 (100.0%) | 0 (0.0%) |
Occupancy by Age of Householder in Lebam
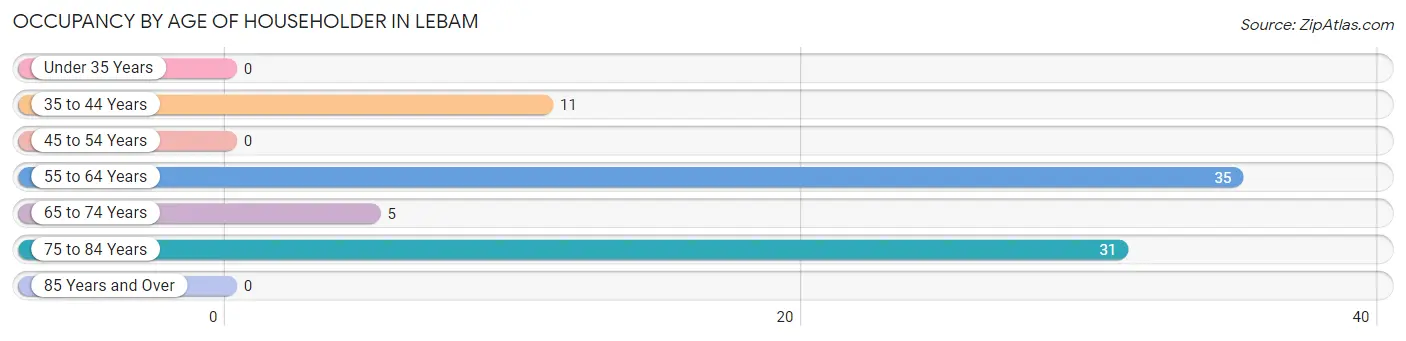
| Age Bracket | # Households | % Households |
| Under 35 Years | 0 | 0.0% |
| 35 to 44 Years | 11 | 13.4% |
| 45 to 54 Years | 0 | 0.0% |
| 55 to 64 Years | 35 | 42.7% |
| 65 to 74 Years | 5 | 6.1% |
| 75 to 84 Years | 31 | 37.8% |
| 85 Years and Over | 0 | 0.0% |
| Total | 82 | 100.0% |
Housing Finances in Lebam
Median Income by Occupancy in Lebam
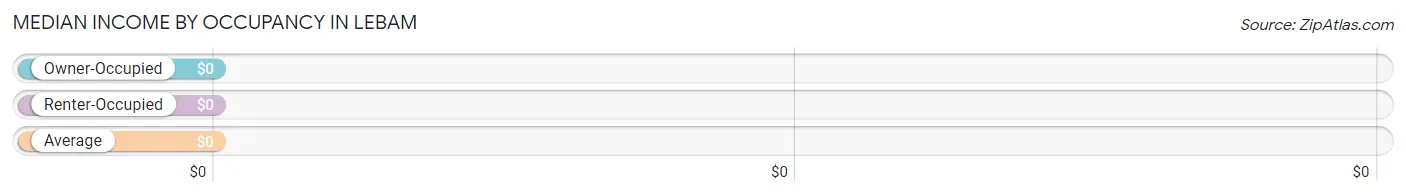
| Occupancy Type | # Households | Median Income |
| Owner-Occupied | 82 (100.0%) | $0 |
| Renter-Occupied | 0 (0.0%) | $0 |
| Average | 82 (100.0%) | $0 |
Occupancy by Householder Income Bracket in Lebam
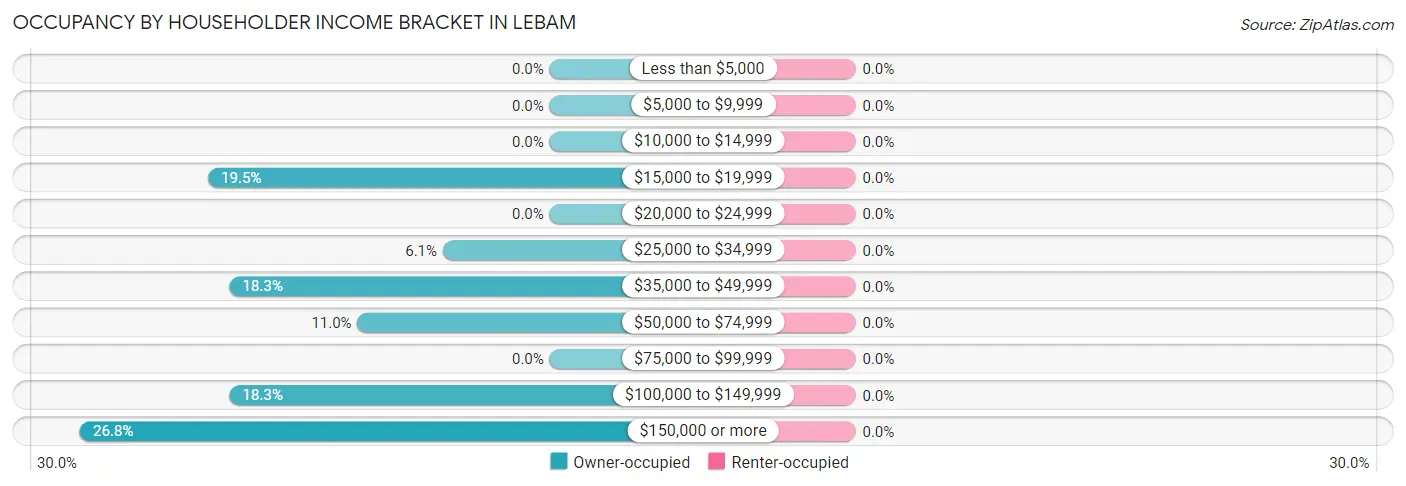
| Income Bracket | Owner-occupied | Renter-occupied |
| Less than $5,000 | 0 (0.0%) | 0 (0.0%) |
| $5,000 to $9,999 | 0 (0.0%) | 0 (0.0%) |
| $10,000 to $14,999 | 0 (0.0%) | 0 (0.0%) |
| $15,000 to $19,999 | 16 (19.5%) | 0 (0.0%) |
| $20,000 to $24,999 | 0 (0.0%) | 0 (0.0%) |
| $25,000 to $34,999 | 5 (6.1%) | 0 (0.0%) |
| $35,000 to $49,999 | 15 (18.3%) | 0 (0.0%) |
| $50,000 to $74,999 | 9 (11.0%) | 0 (0.0%) |
| $75,000 to $99,999 | 0 (0.0%) | 0 (0.0%) |
| $100,000 to $149,999 | 15 (18.3%) | 0 (0.0%) |
| $150,000 or more | 22 (26.8%) | 0 (0.0%) |
| Total | 82 (100.0%) | 0 (0.0%) |
Monthly Housing Cost Tiers in Lebam
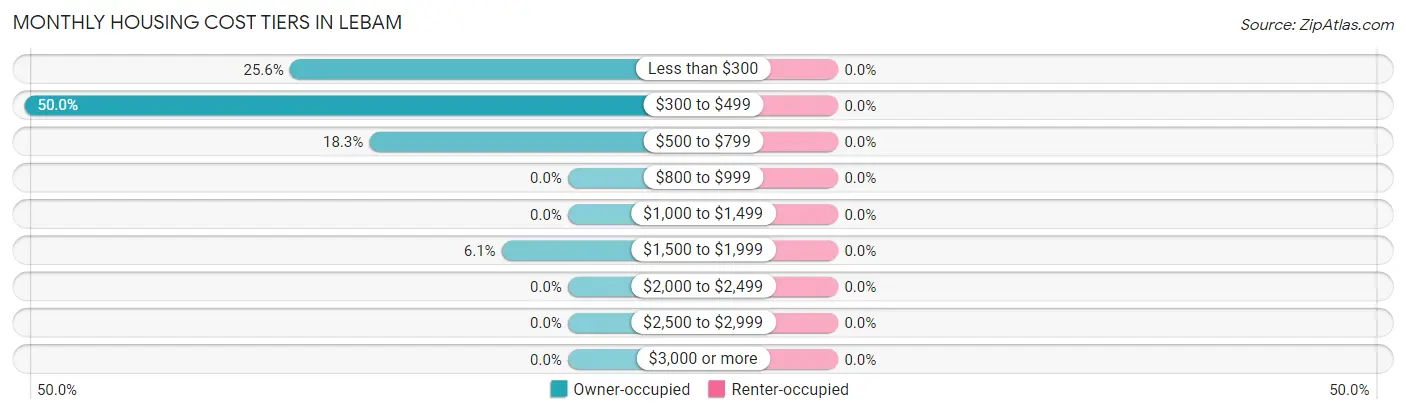
| Monthly Cost | Owner-occupied | Renter-occupied |
| Less than $300 | 21 (25.6%) | 0 (0.0%) |
| $300 to $499 | 41 (50.0%) | 0 (0.0%) |
| $500 to $799 | 15 (18.3%) | 0 (0.0%) |
| $800 to $999 | 0 (0.0%) | 0 (0.0%) |
| $1,000 to $1,499 | 0 (0.0%) | 0 (0.0%) |
| $1,500 to $1,999 | 5 (6.1%) | 0 (0.0%) |
| $2,000 to $2,499 | 0 (0.0%) | 0 (0.0%) |
| $2,500 to $2,999 | 0 (0.0%) | 0 (0.0%) |
| $3,000 or more | 0 (0.0%) | 0 (0.0%) |
| Total | 82 (100.0%) | 0 (0.0%) |
Physical Housing Characteristics in Lebam
Housing Structures in Lebam
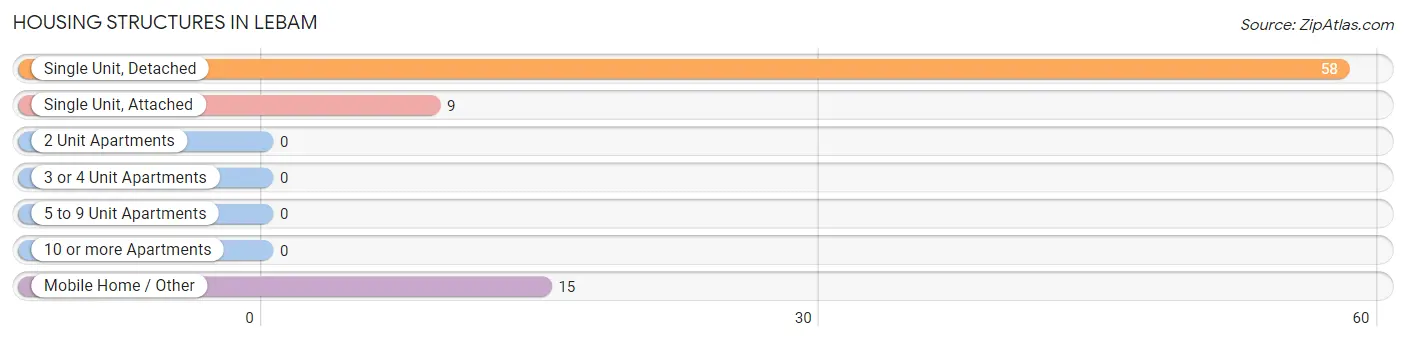
| Structure Type | # Housing Units | % Housing Units |
| Single Unit, Detached | 58 | 70.7% |
| Single Unit, Attached | 9 | 11.0% |
| 2 Unit Apartments | 0 | 0.0% |
| 3 or 4 Unit Apartments | 0 | 0.0% |
| 5 to 9 Unit Apartments | 0 | 0.0% |
| 10 or more Apartments | 0 | 0.0% |
| Mobile Home / Other | 15 | 18.3% |
| Total | 82 | 100.0% |
Housing Structures by Occupancy in Lebam
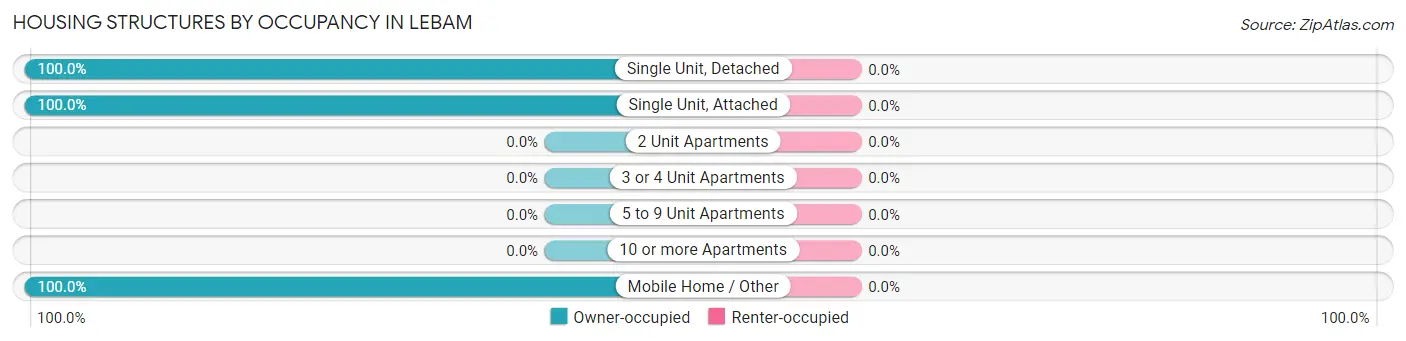
| Structure Type | Owner-occupied | Renter-occupied |
| Single Unit, Detached | 58 (100.0%) | 0 (0.0%) |
| Single Unit, Attached | 9 (100.0%) | 0 (0.0%) |
| 2 Unit Apartments | 0 (0.0%) | 0 (0.0%) |
| 3 or 4 Unit Apartments | 0 (0.0%) | 0 (0.0%) |
| 5 to 9 Unit Apartments | 0 (0.0%) | 0 (0.0%) |
| 10 or more Apartments | 0 (0.0%) | 0 (0.0%) |
| Mobile Home / Other | 15 (100.0%) | 0 (0.0%) |
| Total | 82 (100.0%) | 0 (0.0%) |
Housing Structures by Number of Rooms in Lebam
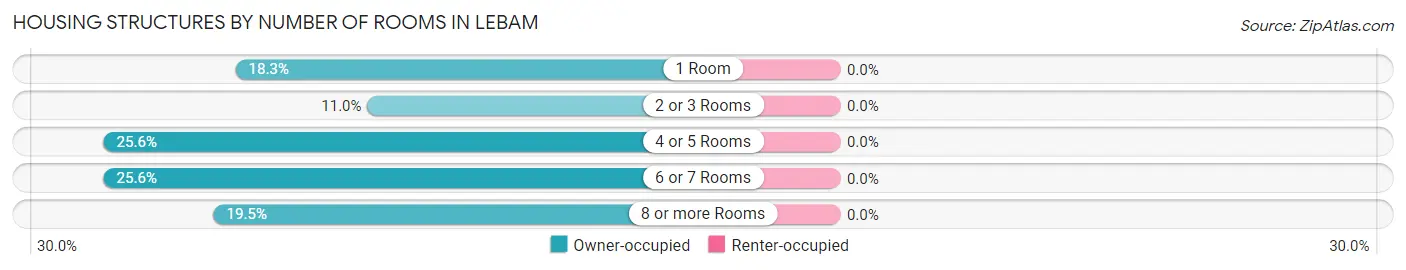
| Number of Rooms | Owner-occupied | Renter-occupied |
| 1 Room | 15 (18.3%) | 0 (0.0%) |
| 2 or 3 Rooms | 9 (11.0%) | 0 (0.0%) |
| 4 or 5 Rooms | 21 (25.6%) | 0 (0.0%) |
| 6 or 7 Rooms | 21 (25.6%) | 0 (0.0%) |
| 8 or more Rooms | 16 (19.5%) | 0 (0.0%) |
| Total | 82 (100.0%) | 0 (0.0%) |
Housing Structure by Heating Type in Lebam
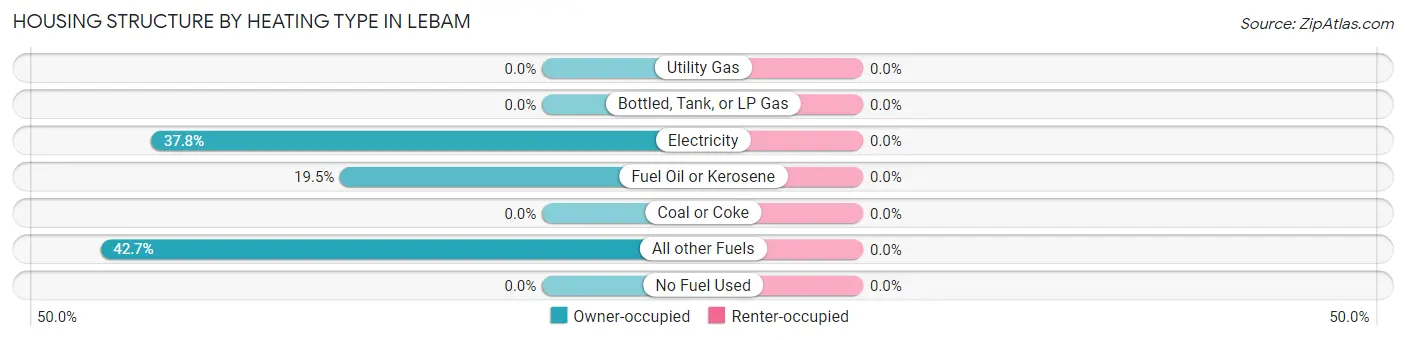
| Heating Type | Owner-occupied | Renter-occupied |
| Utility Gas | 0 (0.0%) | 0 (0.0%) |
| Bottled, Tank, or LP Gas | 0 (0.0%) | 0 (0.0%) |
| Electricity | 31 (37.8%) | 0 (0.0%) |
| Fuel Oil or Kerosene | 16 (19.5%) | 0 (0.0%) |
| Coal or Coke | 0 (0.0%) | 0 (0.0%) |
| All other Fuels | 35 (42.7%) | 0 (0.0%) |
| No Fuel Used | 0 (0.0%) | 0 (0.0%) |
| Total | 82 (100.0%) | 0 (0.0%) |
Household Vehicle Usage in Lebam
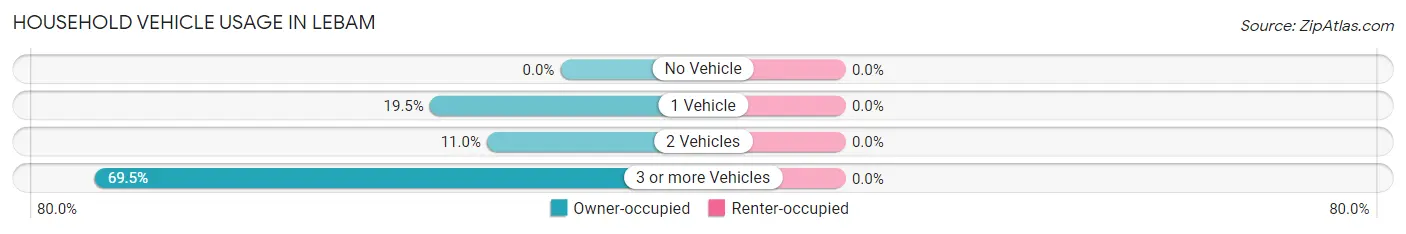
| Vehicles per Household | Owner-occupied | Renter-occupied |
| No Vehicle | 0 (0.0%) | 0 (0.0%) |
| 1 Vehicle | 16 (19.5%) | 0 (0.0%) |
| 2 Vehicles | 9 (11.0%) | 0 (0.0%) |
| 3 or more Vehicles | 57 (69.5%) | 0 (0.0%) |
| Total | 82 (100.0%) | 0 (0.0%) |
Real Estate & Mortgages in Lebam
Real Estate and Mortgage Overview in Lebam
| Characteristic | Without Mortgage | With Mortgage |
| Housing Units | 77 | 5 |
| Median Property Value | $129,200 | $0 |
| Median Household Income | - | - |
| Monthly Housing Costs | $358 | $0 |
| Real Estate Taxes | $1,242 | $0 |
Property Value by Mortgage Status in Lebam
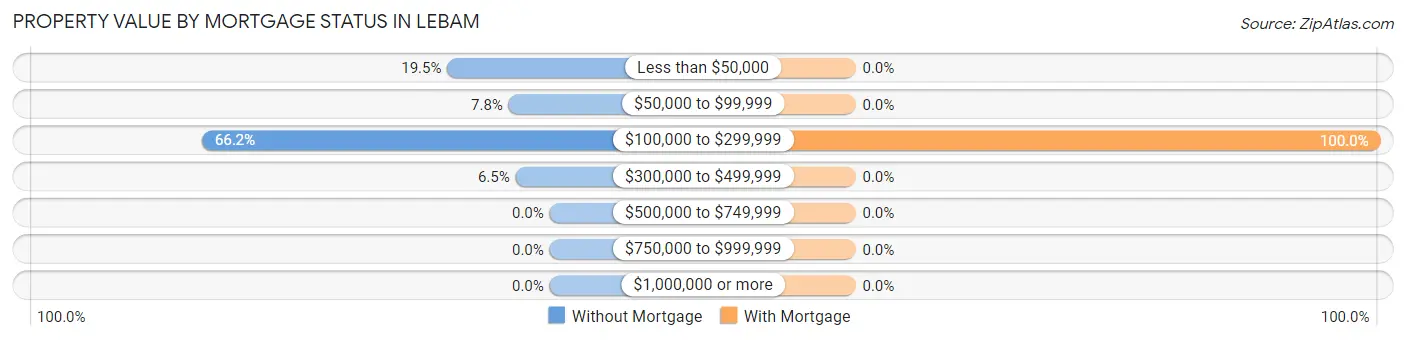
| Property Value | Without Mortgage | With Mortgage |
| Less than $50,000 | 15 (19.5%) | 0 (0.0%) |
| $50,000 to $99,999 | 6 (7.8%) | 0 (0.0%) |
| $100,000 to $299,999 | 51 (66.2%) | 5 (100.0%) |
| $300,000 to $499,999 | 5 (6.5%) | 0 (0.0%) |
| $500,000 to $749,999 | 0 (0.0%) | 0 (0.0%) |
| $750,000 to $999,999 | 0 (0.0%) | 0 (0.0%) |
| $1,000,000 or more | 0 (0.0%) | 0 (0.0%) |
| Total | 77 (100.0%) | 5 (100.0%) |
Household Income by Mortgage Status in Lebam
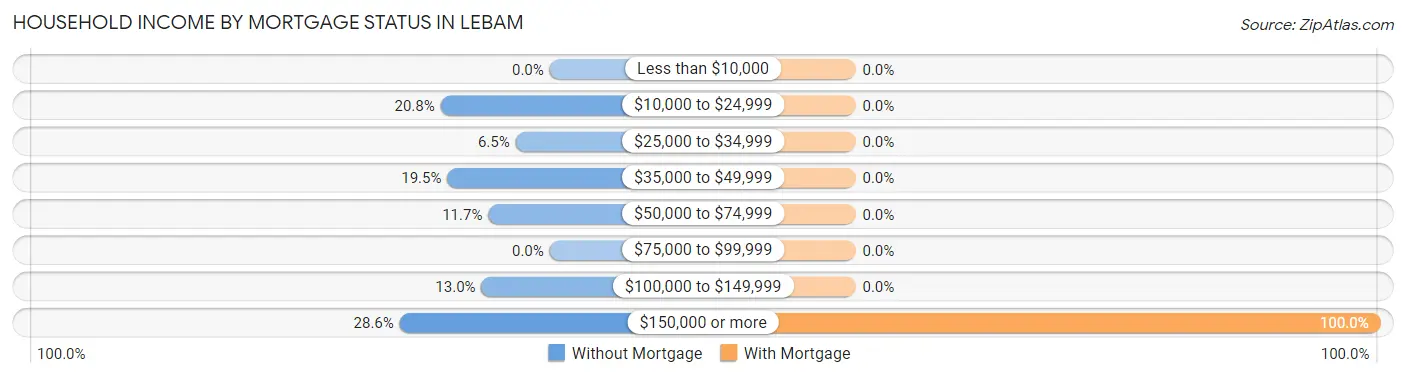
| Household Income | Without Mortgage | With Mortgage |
| Less than $10,000 | 0 (0.0%) | 0 (0.0%) |
| $10,000 to $24,999 | 16 (20.8%) | 0 (0.0%) |
| $25,000 to $34,999 | 5 (6.5%) | 0 (0.0%) |
| $35,000 to $49,999 | 15 (19.5%) | 0 (0.0%) |
| $50,000 to $74,999 | 9 (11.7%) | 0 (0.0%) |
| $75,000 to $99,999 | 0 (0.0%) | 0 (0.0%) |
| $100,000 to $149,999 | 10 (13.0%) | 0 (0.0%) |
| $150,000 or more | 22 (28.6%) | 5 (100.0%) |
| Total | 77 (100.0%) | 5 (100.0%) |
Property Value to Household Income Ratio in Lebam
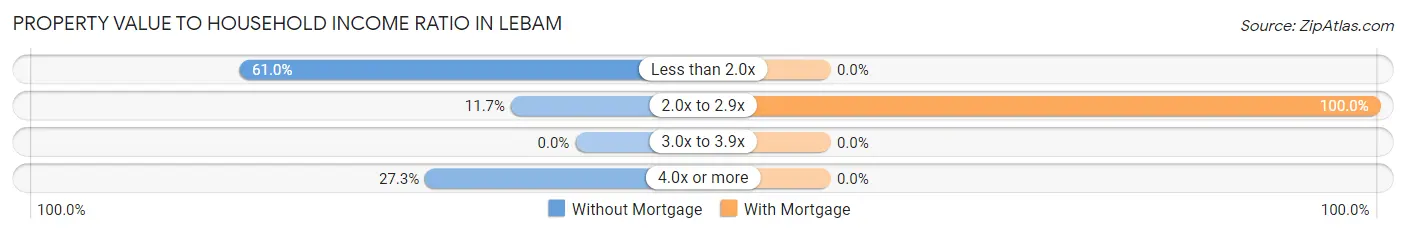
| Value-to-Income Ratio | Without Mortgage | With Mortgage |
| Less than 2.0x | 47 (61.0%) | 0 (0.0%) |
| 2.0x to 2.9x | 9 (11.7%) | 5 (100.0%) |
| 3.0x to 3.9x | 0 (0.0%) | 0 (0.0%) |
| 4.0x or more | 21 (27.3%) | 0 (0.0%) |
| Total | 77 (100.0%) | 5 (100.0%) |
Real Estate Taxes by Mortgage Status in Lebam
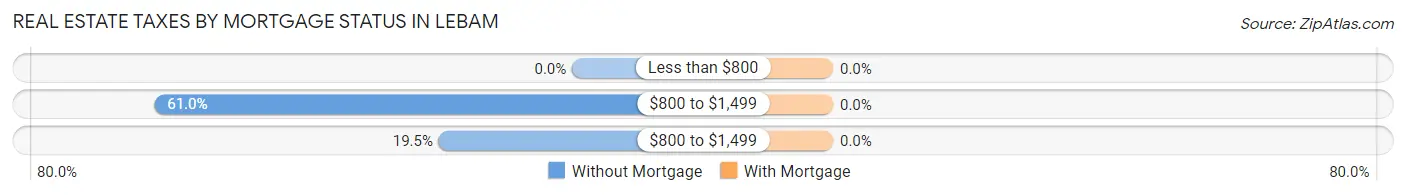
| Property Taxes | Without Mortgage | With Mortgage |
| Less than $800 | 0 (0.0%) | 0 (0.0%) |
| $800 to $1,499 | 47 (61.0%) | 0 (0.0%) |
| $800 to $1,499 | 15 (19.5%) | 0 (0.0%) |
| Total | 77 (100.0%) | 5 (100.0%) |
Health & Disability in Lebam
Health Insurance Coverage by Age in Lebam
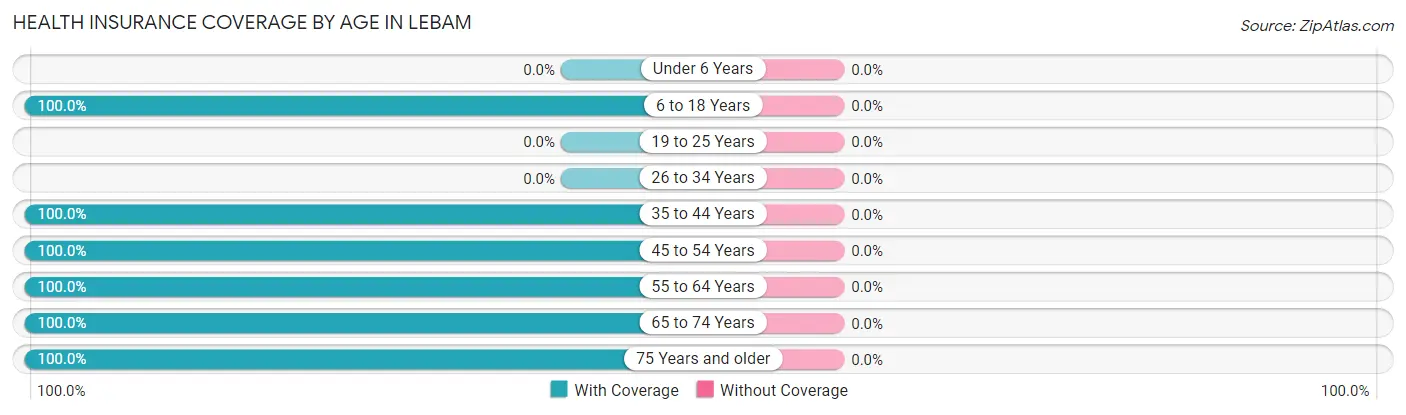
| Age Bracket | With Coverage | Without Coverage |
| Under 6 Years | 0 (0.0%) | 0 (0.0%) |
| 6 to 18 Years | 19 (100.0%) | 0 (0.0%) |
| 19 to 25 Years | 0 (0.0%) | 0 (0.0%) |
| 26 to 34 Years | 0 (0.0%) | 0 (0.0%) |
| 35 to 44 Years | 18 (100.0%) | 0 (0.0%) |
| 45 to 54 Years | 21 (100.0%) | 0 (0.0%) |
| 55 to 64 Years | 56 (100.0%) | 0 (0.0%) |
| 65 to 74 Years | 9 (100.0%) | 0 (0.0%) |
| 75 Years and older | 45 (100.0%) | 0 (0.0%) |
| Total | 168 (100.0%) | 0 (0.0%) |
Health Insurance Coverage by Citizenship Status in Lebam
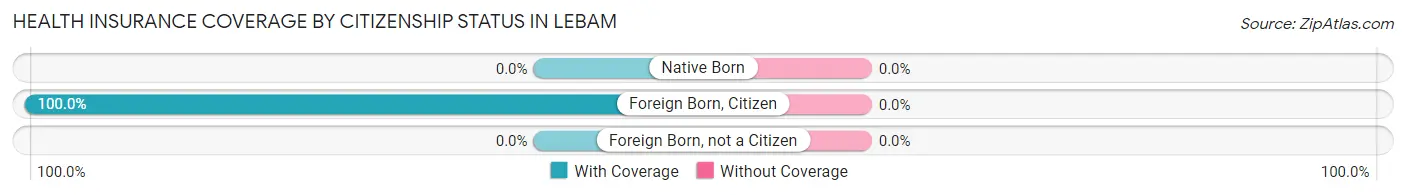
| Citizenship Status | With Coverage | Without Coverage |
| Native Born | 0 (0.0%) | 0 (0.0%) |
| Foreign Born, Citizen | 19 (100.0%) | 0 (0.0%) |
| Foreign Born, not a Citizen | 0 (0.0%) | 0 (0.0%) |
Health Insurance Coverage by Household Income in Lebam
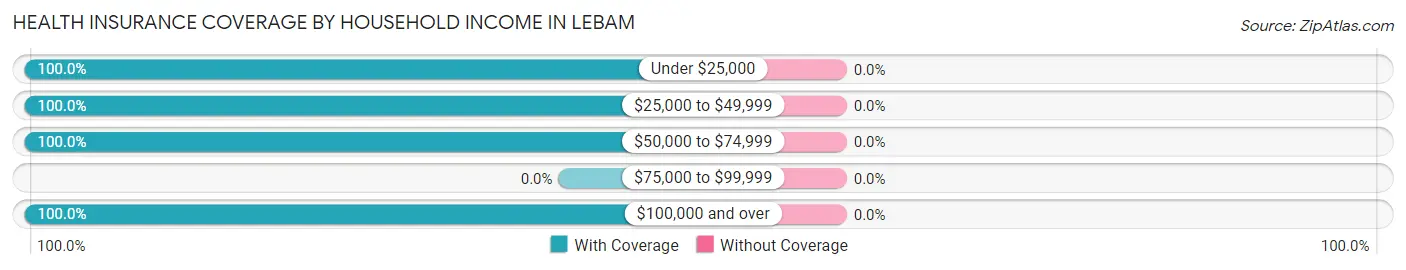
| Household Income | With Coverage | Without Coverage |
| Under $25,000 | 16 (100.0%) | 0 (0.0%) |
| $25,000 to $49,999 | 51 (100.0%) | 0 (0.0%) |
| $50,000 to $74,999 | 9 (100.0%) | 0 (0.0%) |
| $75,000 to $99,999 | 0 (0.0%) | 0 (0.0%) |
| $100,000 and over | 92 (100.0%) | 0 (0.0%) |
Public vs Private Health Insurance Coverage by Age in Lebam
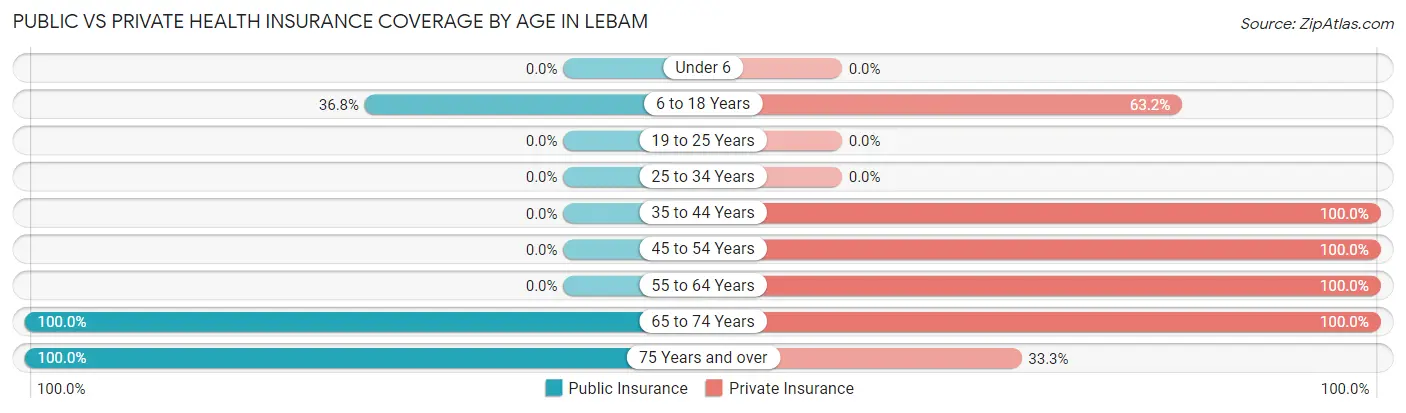
| Age Bracket | Public Insurance | Private Insurance |
| Under 6 | 0 (0.0%) | 0 (0.0%) |
| 6 to 18 Years | 7 (36.8%) | 12 (63.2%) |
| 19 to 25 Years | 0 (0.0%) | 0 (0.0%) |
| 25 to 34 Years | 0 (0.0%) | 0 (0.0%) |
| 35 to 44 Years | 0 (0.0%) | 18 (100.0%) |
| 45 to 54 Years | 0 (0.0%) | 21 (100.0%) |
| 55 to 64 Years | 0 (0.0%) | 56 (100.0%) |
| 65 to 74 Years | 9 (100.0%) | 9 (100.0%) |
| 75 Years and over | 45 (100.0%) | 15 (33.3%) |
| Total | 61 (36.3%) | 131 (78.0%) |
Disability Status by Sex by Age in Lebam
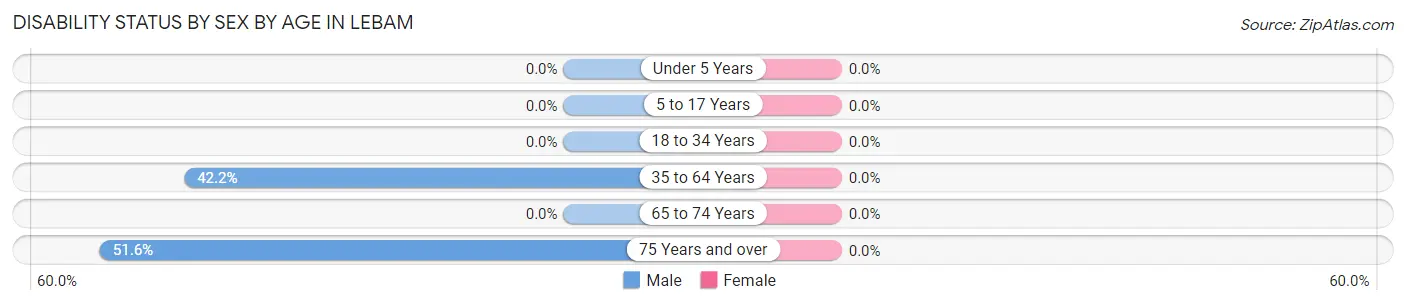
| Age Bracket | Male | Female |
| Under 5 Years | 0 (0.0%) | 0 (0.0%) |
| 5 to 17 Years | 0 (0.0%) | 0 (0.0%) |
| 18 to 34 Years | 0 (0.0%) | 0 (0.0%) |
| 35 to 64 Years | 19 (42.2%) | 0 (0.0%) |
| 65 to 74 Years | 0 (0.0%) | 0 (0.0%) |
| 75 Years and over | 16 (51.6%) | 0 (0.0%) |
Disability Class by Sex by Age in Lebam
Disability Class: Hearing Difficulty
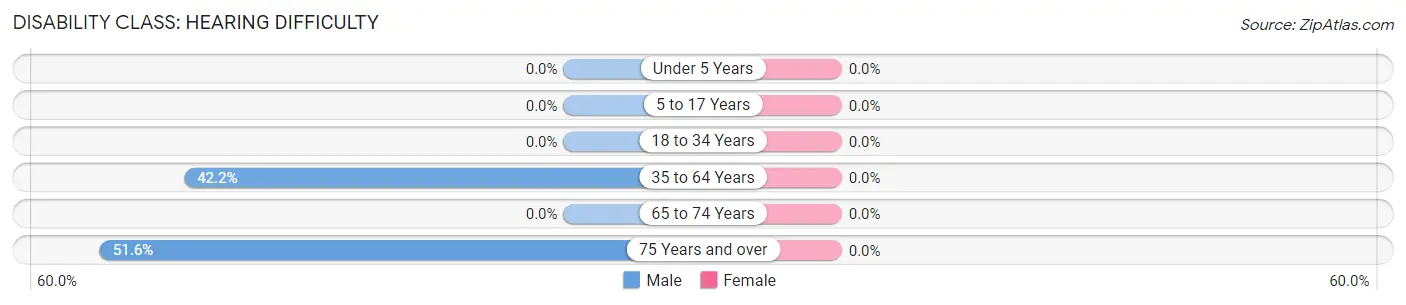
| Age Bracket | Male | Female |
| Under 5 Years | 0 (0.0%) | 0 (0.0%) |
| 5 to 17 Years | 0 (0.0%) | 0 (0.0%) |
| 18 to 34 Years | 0 (0.0%) | 0 (0.0%) |
| 35 to 64 Years | 19 (42.2%) | 0 (0.0%) |
| 65 to 74 Years | 0 (0.0%) | 0 (0.0%) |
| 75 Years and over | 16 (51.6%) | 0 (0.0%) |
Disability Class: Vision Difficulty
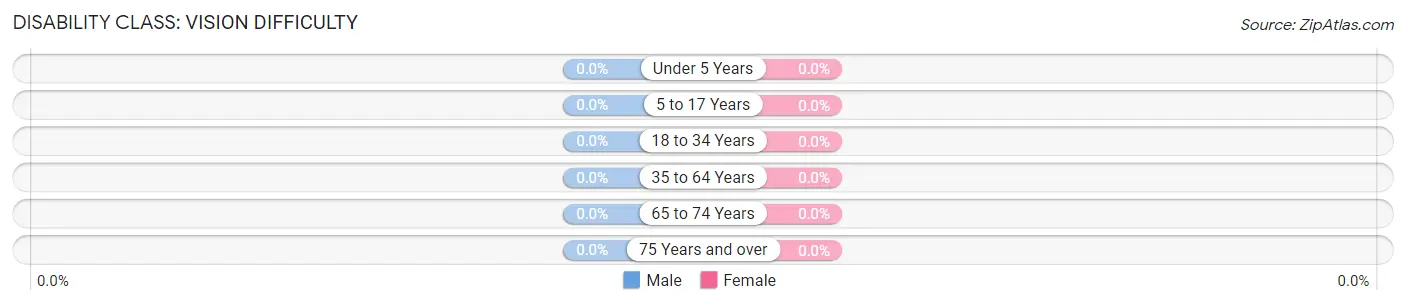
| Age Bracket | Male | Female |
| Under 5 Years | 0 (0.0%) | 0 (0.0%) |
| 5 to 17 Years | 0 (0.0%) | 0 (0.0%) |
| 18 to 34 Years | 0 (0.0%) | 0 (0.0%) |
| 35 to 64 Years | 0 (0.0%) | 0 (0.0%) |
| 65 to 74 Years | 0 (0.0%) | 0 (0.0%) |
| 75 Years and over | 0 (0.0%) | 0 (0.0%) |
Disability Class: Cognitive Difficulty

| Age Bracket | Male | Female |
| 5 to 17 Years | 0 (0.0%) | 0 (0.0%) |
| 18 to 34 Years | 0 (0.0%) | 0 (0.0%) |
| 35 to 64 Years | 9 (20.0%) | 0 (0.0%) |
| 65 to 74 Years | 0 (0.0%) | 0 (0.0%) |
| 75 Years and over | 16 (51.6%) | 0 (0.0%) |
Disability Class: Ambulatory Difficulty
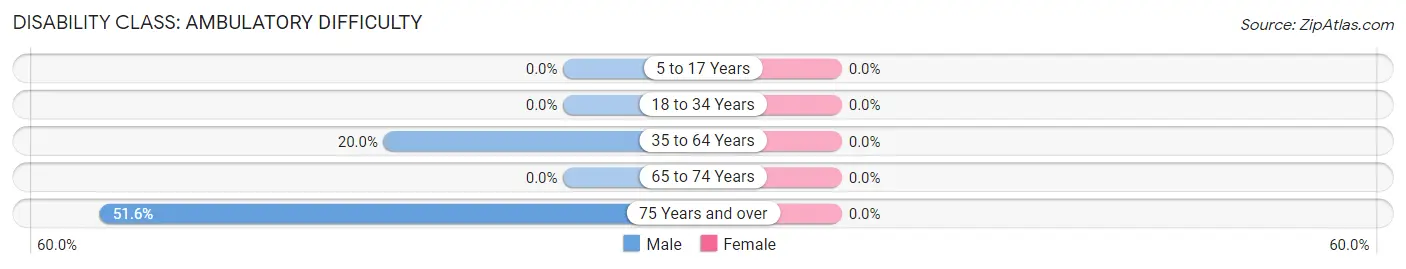
| Age Bracket | Male | Female |
| 5 to 17 Years | 0 (0.0%) | 0 (0.0%) |
| 18 to 34 Years | 0 (0.0%) | 0 (0.0%) |
| 35 to 64 Years | 9 (20.0%) | 0 (0.0%) |
| 65 to 74 Years | 0 (0.0%) | 0 (0.0%) |
| 75 Years and over | 16 (51.6%) | 0 (0.0%) |
Disability Class: Self-Care Difficulty
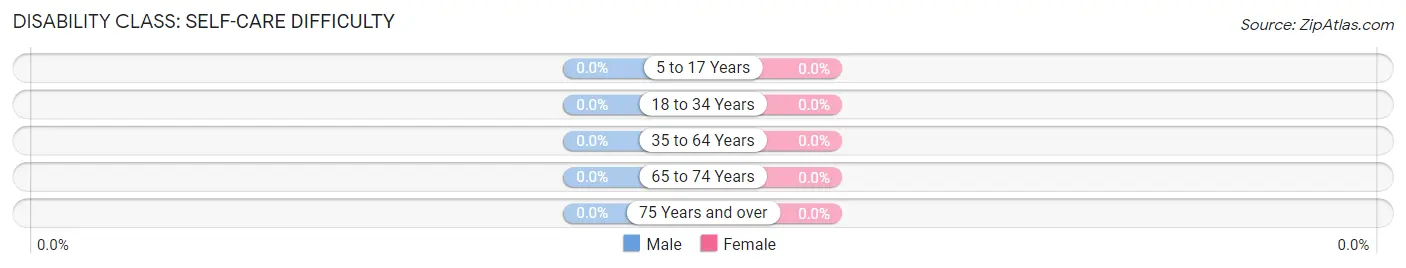
| Age Bracket | Male | Female |
| 5 to 17 Years | 0 (0.0%) | 0 (0.0%) |
| 18 to 34 Years | 0 (0.0%) | 0 (0.0%) |
| 35 to 64 Years | 0 (0.0%) | 0 (0.0%) |
| 65 to 74 Years | 0 (0.0%) | 0 (0.0%) |
| 75 Years and over | 0 (0.0%) | 0 (0.0%) |
Technology Access in Lebam
Computing Device Access in Lebam
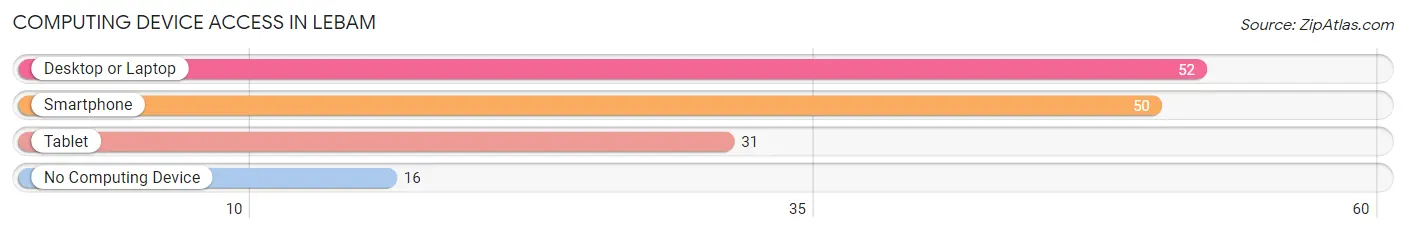
| Device Type | # Households | % Households |
| Desktop or Laptop | 52 | 63.4% |
| Smartphone | 50 | 61.0% |
| Tablet | 31 | 37.8% |
| No Computing Device | 16 | 19.5% |
| Total | 82 | 100.0% |
Internet Access in Lebam
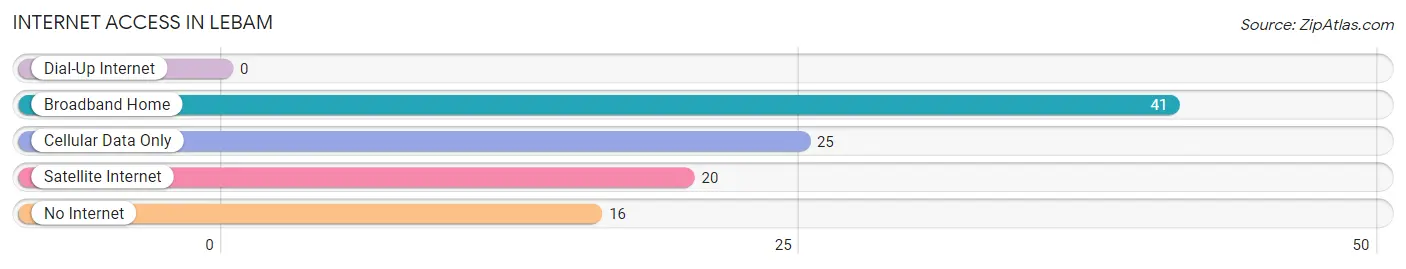
| Internet Type | # Households | % Households |
| Dial-Up Internet | 0 | 0.0% |
| Broadband Home | 41 | 50.0% |
| Cellular Data Only | 25 | 30.5% |
| Satellite Internet | 20 | 24.4% |
| No Internet | 16 | 19.5% |
| Total | 82 | 100.0% |
Lebam Summary
Lebam is a small unincorporated community located in the Pacific County of Washington State. It is situated on the Willapa River, approximately 10 miles east of Raymond and 25 miles west of Longview. The population of Lebam was estimated to be around 200 people in 2000.
History
The area around Lebam was first settled by Native Americans, who lived in the area for thousands of years before the arrival of European settlers. The first European settlers arrived in the area in the late 1800s, and the town of Lebam was officially established in 1891. The town was named after the nearby Lebam Creek, which was named after a Native American chief.
The town of Lebam was originally a logging and fishing community, and the local economy was largely based on these industries. In the early 1900s, the town was home to several sawmills, a cannery, and a fish hatchery. The town also had a post office, a school, and several stores.
In the 1950s, the logging industry began to decline in the area, and the local economy shifted to focus on farming and dairying. The town also became a popular tourist destination, as it was located near several popular fishing and hunting spots.
Geography
Lebam is located in the Pacific County of Washington State, approximately 10 miles east of Raymond and 25 miles west of Longview. The town is situated on the Willapa River, and is surrounded by rolling hills and forests. The climate in the area is mild, with temperatures rarely dropping below freezing in the winter months.
The town of Lebam is located in the Willapa Hills AVA, a designated American Viticultural Area. The area is known for its cool climate and fertile soils, which are ideal for growing grapes. The area is home to several wineries, and is a popular destination for wine tasting and other activities.
Economy
The economy of Lebam is largely based on agriculture and tourism. The area is home to several farms, which produce a variety of crops, including hay, wheat, and corn. The town is also home to several wineries, which produce a variety of wines.
The town is also a popular tourist destination, as it is located near several popular fishing and hunting spots. The town is also home to several bed and breakfasts, as well as a few restaurants and stores.
Demographics
The population of Lebam was estimated to be around 200 people in 2000. The town is predominantly white, with a small Hispanic population. The median household income in the town is around $35,000, and the median home value is around $150,000. The town has a low unemployment rate, and the majority of the population is employed in the agricultural and tourism industries.
Common Questions
What is Per Capita Income in Lebam?
Per Capita income in Lebam is $43,618.
What is the Median Family Income in Lebam?
Median Family Income in Lebam is $124,625.
What is Income or Wage Gap in Lebam?
Income or Wage Gap in Lebam is 54.4%.
Women in Lebam earn 45.6 cents for every dollar earned by a man.
What is Inequality or Gini Index in Lebam?
Inequality or Gini Index in Lebam is 0.38.
What is the Total Population of Lebam?
Total Population of Lebam is 168.
What is the Total Male Population of Lebam?
Total Male Population of Lebam is 88.
What is the Total Female Population of Lebam?
Total Female Population of Lebam is 80.
What is the Ratio of Males per 100 Females in Lebam?
There are 110.00 Males per 100 Females in Lebam.
What is the Ratio of Females per 100 Males in Lebam?
There are 90.91 Females per 100 Males in Lebam.
What is the Median Population Age in Lebam?
Median Population Age in Lebam is 57.7 Years.
What is the Average Family Size in Lebam
Average Family Size in Lebam is 2.5 People.
What is the Average Household Size in Lebam
Average Household Size in Lebam is 2.0 People.
How Large is the Labor Force in Lebam?
There are 68 People in the Labor Forcein in Lebam.
What is the Percentage of People in the Labor Force in Lebam?
45.6% of People are in the Labor Force in Lebam.