Cities with the Largest Jamaican Community in Washington
RELATED REPORTS & OPTIONS
Jamaican
Washington
Compare Cities
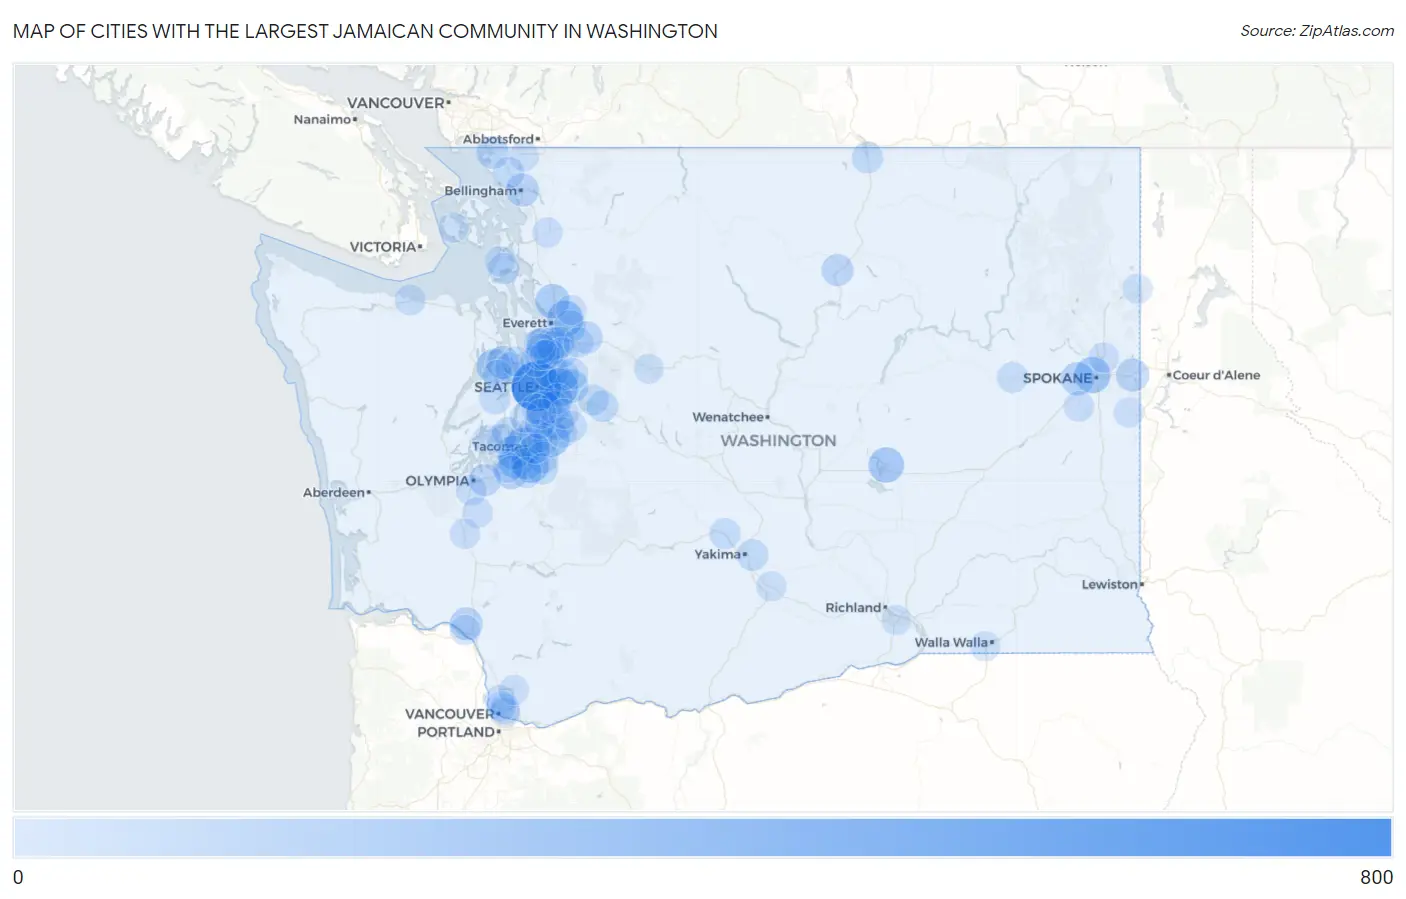
Map of Cities with the Largest Jamaican Community in Washington
0
800
Cities with the Largest Jamaican Community in Washington
| City | Jamaican | vs State | vs National | |
| 1. | Seattle | 756 | 7,707(9.81%)#1 | 1,203,841(0.06%)#194 |
| 2. | Bellevue | 321 | 7,707(4.17%)#2 | 1,203,841(0.03%)#415 |
| 3. | Tacoma | 277 | 7,707(3.59%)#3 | 1,203,841(0.02%)#470 |
| 4. | Spokane | 230 | 7,707(2.98%)#4 | 1,203,841(0.02%)#567 |
| 5. | Auburn | 227 | 7,707(2.95%)#5 | 1,203,841(0.02%)#571 |
| 6. | Lake Stevens | 225 | 7,707(2.92%)#6 | 1,203,841(0.02%)#580 |
| 7. | Clover Creek | 210 | 7,707(2.72%)#7 | 1,203,841(0.02%)#612 |
| 8. | Moses Lake | 201 | 7,707(2.61%)#8 | 1,203,841(0.02%)#643 |
| 9. | Clear Lake Cdp Pierce County | 198 | 7,707(2.57%)#9 | 1,203,841(0.02%)#649 |
| 10. | Tukwila | 197 | 7,707(2.56%)#10 | 1,203,841(0.02%)#653 |
| 11. | North Lynnwood | 176 | 7,707(2.28%)#11 | 1,203,841(0.01%)#720 |
| 12. | Lakewood | 170 | 7,707(2.21%)#12 | 1,203,841(0.01%)#733 |
| 13. | Bangor Base | 170 | 7,707(2.21%)#13 | 1,203,841(0.01%)#734 |
| 14. | Marysville | 166 | 7,707(2.15%)#14 | 1,203,841(0.01%)#749 |
| 15. | Kirkland | 156 | 7,707(2.02%)#15 | 1,203,841(0.01%)#787 |
| 16. | Sammamish | 142 | 7,707(1.84%)#16 | 1,203,841(0.01%)#851 |
| 17. | University Place | 141 | 7,707(1.83%)#17 | 1,203,841(0.01%)#855 |
| 18. | Beacon Hill | 140 | 7,707(1.82%)#18 | 1,203,841(0.01%)#860 |
| 19. | Federal Way | 136 | 7,707(1.76%)#19 | 1,203,841(0.01%)#875 |
| 20. | Airway Heights | 119 | 7,707(1.54%)#20 | 1,203,841(0.01%)#972 |
| 21. | Fort Lewis | 117 | 7,707(1.52%)#21 | 1,203,841(0.01%)#992 |
| 22. | Poulsbo | 115 | 7,707(1.49%)#22 | 1,203,841(0.01%)#1,006 |
| 23. | Kent | 110 | 7,707(1.43%)#23 | 1,203,841(0.01%)#1,044 |
| 24. | Bellingham | 107 | 7,707(1.39%)#24 | 1,203,841(0.01%)#1,057 |
| 25. | Mill Creek | 107 | 7,707(1.39%)#25 | 1,203,841(0.01%)#1,062 |
| 26. | Liberty Lake | 104 | 7,707(1.35%)#26 | 1,203,841(0.01%)#1,088 |
| 27. | Longview Heights | 103 | 7,707(1.34%)#27 | 1,203,841(0.01%)#1,098 |
| 28. | Mill Creek East | 100 | 7,707(1.30%)#28 | 1,203,841(0.01%)#1,120 |
| 29. | Woods Creek | 94 | 7,707(1.22%)#29 | 1,203,841(0.01%)#1,179 |
| 30. | Blaine | 93 | 7,707(1.21%)#30 | 1,203,841(0.01%)#1,189 |
| 31. | Renton | 89 | 7,707(1.15%)#31 | 1,203,841(0.01%)#1,220 |
| 32. | Everett | 73 | 7,707(0.95%)#32 | 1,203,841(0.01%)#1,380 |
| 33. | Lacey | 72 | 7,707(0.93%)#33 | 1,203,841(0.01%)#1,395 |
| 34. | Malott | 72 | 7,707(0.93%)#34 | 1,203,841(0.01%)#1,408 |
| 35. | Puyallup | 62 | 7,707(0.80%)#35 | 1,203,841(0.01%)#1,530 |
| 36. | Silver Firs | 60 | 7,707(0.78%)#36 | 1,203,841(0.00%)#1,573 |
| 37. | Parkland | 56 | 7,707(0.73%)#37 | 1,203,841(0.00%)#1,643 |
| 38. | Terrace Heights | 56 | 7,707(0.73%)#38 | 1,203,841(0.00%)#1,648 |
| 39. | Oroville | 55 | 7,707(0.71%)#39 | 1,203,841(0.00%)#1,674 |
| 40. | Shoreline | 53 | 7,707(0.69%)#40 | 1,203,841(0.00%)#1,692 |
| 41. | Ferndale | 49 | 7,707(0.64%)#41 | 1,203,841(0.00%)#1,772 |
| 42. | North Bend | 47 | 7,707(0.61%)#42 | 1,203,841(0.00%)#1,814 |
| 43. | Oak Harbor | 44 | 7,707(0.57%)#43 | 1,203,841(0.00%)#1,873 |
| 44. | South Hill | 41 | 7,707(0.53%)#44 | 1,203,841(0.00%)#1,940 |
| 45. | Union Hill Novelty Hill | 41 | 7,707(0.53%)#45 | 1,203,841(0.00%)#1,943 |
| 46. | Maple Valley | 40 | 7,707(0.52%)#46 | 1,203,841(0.00%)#1,968 |
| 47. | Bremerton | 36 | 7,707(0.47%)#47 | 1,203,841(0.00%)#2,066 |
| 48. | Snoqualmie | 33 | 7,707(0.43%)#48 | 1,203,841(0.00%)#2,169 |
| 49. | Naches | 33 | 7,707(0.43%)#49 | 1,203,841(0.00%)#2,178 |
| 50. | Davenport | 32 | 7,707(0.42%)#50 | 1,203,841(0.00%)#2,203 |
| 51. | Redmond | 31 | 7,707(0.40%)#51 | 1,203,841(0.00%)#2,206 |
| 52. | Gig Harbor | 28 | 7,707(0.36%)#52 | 1,203,841(0.00%)#2,315 |
| 53. | Spanaway | 26 | 7,707(0.34%)#53 | 1,203,841(0.00%)#2,393 |
| 54. | Port Angeles | 26 | 7,707(0.34%)#54 | 1,203,841(0.00%)#2,400 |
| 55. | Newcastle | 24 | 7,707(0.31%)#55 | 1,203,841(0.00%)#2,469 |
| 56. | Lakeland South | 22 | 7,707(0.29%)#56 | 1,203,841(0.00%)#2,553 |
| 57. | Tumwater | 20 | 7,707(0.26%)#57 | 1,203,841(0.00%)#2,649 |
| 58. | Salmon Creek | 18 | 7,707(0.23%)#58 | 1,203,841(0.00%)#2,754 |
| 59. | Vashon | 18 | 7,707(0.23%)#59 | 1,203,841(0.00%)#2,763 |
| 60. | North Fort Lewis | 16 | 7,707(0.21%)#60 | 1,203,841(0.00%)#2,875 |
| 61. | Tenino | 15 | 7,707(0.19%)#61 | 1,203,841(0.00%)#2,950 |
| 62. | Cheney | 14 | 7,707(0.18%)#62 | 1,203,841(0.00%)#2,984 |
| 63. | Mead | 14 | 7,707(0.18%)#63 | 1,203,841(0.00%)#2,991 |
| 64. | Lochsloy | 14 | 7,707(0.18%)#64 | 1,203,841(0.00%)#3,014 |
| 65. | Whidbey Island Station | 14 | 7,707(0.18%)#65 | 1,203,841(0.00%)#3,015 |
| 66. | Suquamish | 13 | 7,707(0.17%)#66 | 1,203,841(0.00%)#3,065 |
| 67. | Lake Morton Berrydale | 11 | 7,707(0.14%)#67 | 1,203,841(0.00%)#3,193 |
| 68. | Sunland Estates | 11 | 7,707(0.14%)#68 | 1,203,841(0.00%)#3,241 |
| 69. | Des Moines | 10 | 7,707(0.13%)#69 | 1,203,841(0.00%)#3,255 |
| 70. | Mountlake Terrace | 10 | 7,707(0.13%)#70 | 1,203,841(0.00%)#3,261 |
| 71. | Centralia | 9 | 7,707(0.12%)#71 | 1,203,841(0.00%)#3,354 |
| 72. | Maltby | 9 | 7,707(0.12%)#72 | 1,203,841(0.00%)#3,368 |
| 73. | Longview | 8 | 7,707(0.10%)#73 | 1,203,841(0.00%)#3,431 |
| 74. | Bothell West | 8 | 7,707(0.10%)#74 | 1,203,841(0.00%)#3,442 |
| 75. | Fairwood Cdp King County | 8 | 7,707(0.10%)#75 | 1,203,841(0.00%)#3,445 |
| 76. | Sedro Woolley | 8 | 7,707(0.10%)#76 | 1,203,841(0.00%)#3,463 |
| 77. | Minnehaha | 8 | 7,707(0.10%)#77 | 1,203,841(0.00%)#3,465 |
| 78. | Meadowdale | 8 | 7,707(0.10%)#78 | 1,203,841(0.00%)#3,496 |
| 79. | Vancouver | 7 | 7,707(0.09%)#79 | 1,203,841(0.00%)#3,537 |
| 80. | Lynnwood | 5 | 7,707(0.06%)#80 | 1,203,841(0.00%)#3,704 |
| 81. | Silverdale | 5 | 7,707(0.06%)#81 | 1,203,841(0.00%)#3,710 |
| 82. | Artondale | 5 | 7,707(0.06%)#82 | 1,203,841(0.00%)#3,715 |
| 83. | Indianola | 5 | 7,707(0.06%)#83 | 1,203,841(0.00%)#3,738 |
| 84. | Zillah | 5 | 7,707(0.06%)#84 | 1,203,841(0.00%)#3,743 |
| 85. | Monroe | 4 | 7,707(0.05%)#85 | 1,203,841(0.00%)#3,814 |
| 86. | Fife | 4 | 7,707(0.05%)#86 | 1,203,841(0.00%)#3,823 |
| 87. | College Place | 4 | 7,707(0.05%)#87 | 1,203,841(0.00%)#3,827 |
| 88. | Hazel Dell | 3 | 7,707(0.04%)#88 | 1,203,841(0.00%)#3,894 |
| 89. | Lynden | 3 | 7,707(0.04%)#89 | 1,203,841(0.00%)#3,901 |
| 90. | Newport | 3 | 7,707(0.04%)#90 | 1,203,841(0.00%)#3,927 |
| 91. | Kennewick | 2 | 7,707(0.03%)#91 | 1,203,841(0.00%)#3,976 |
| 92. | Burien | 2 | 7,707(0.03%)#92 | 1,203,841(0.00%)#3,977 |
| 93. | Battle Ground | 2 | 7,707(0.03%)#93 | 1,203,841(0.00%)#3,982 |
| 94. | Maple Heights Lake Desire | 2 | 7,707(0.03%)#94 | 1,203,841(0.00%)#4,001 |
| 95. | Friday Harbor | 2 | 7,707(0.03%)#95 | 1,203,841(0.00%)#4,013 |
| 96. | Skykomish | 2 | 7,707(0.03%)#96 | 1,203,841(0.00%)#4,066 |
| 97. | Seatac | 1 | 7,707(0.01%)#97 | 1,203,841(0.00%)#4,068 |
| 98. | Brier | 1 | 7,707(0.01%)#98 | 1,203,841(0.00%)#4,092 |
| 99. | Home | 1 | 7,707(0.01%)#99 | 1,203,841(0.00%)#4,120 |
| 100. | Rockford | 1 | 7,707(0.01%)#100 | 1,203,841(0.00%)#4,142 |
Common Questions
What are the Top 10 Cities with the Largest Jamaican Community in Washington?
Top 10 Cities with the Largest Jamaican Community in Washington are:
#1
756
#2
321
#3
277
#4
230
#5
227
#6
225
#7
210
#8
201
#9
197
#10
176
What city has the Largest Jamaican Community in Washington?
Seattle has the Largest Jamaican Community in Washington with 756.
What is the Total Jamaican Population in the State of Washington?
Total Jamaican Population in Washington is 7,707.
What is the Total Jamaican Population in the United States?
Total Jamaican Population in the United States is 1,203,841.