Cities with the Largest Sri Lankan Community in Washington
RELATED REPORTS & OPTIONS
Sri Lankan
Washington
Compare Cities
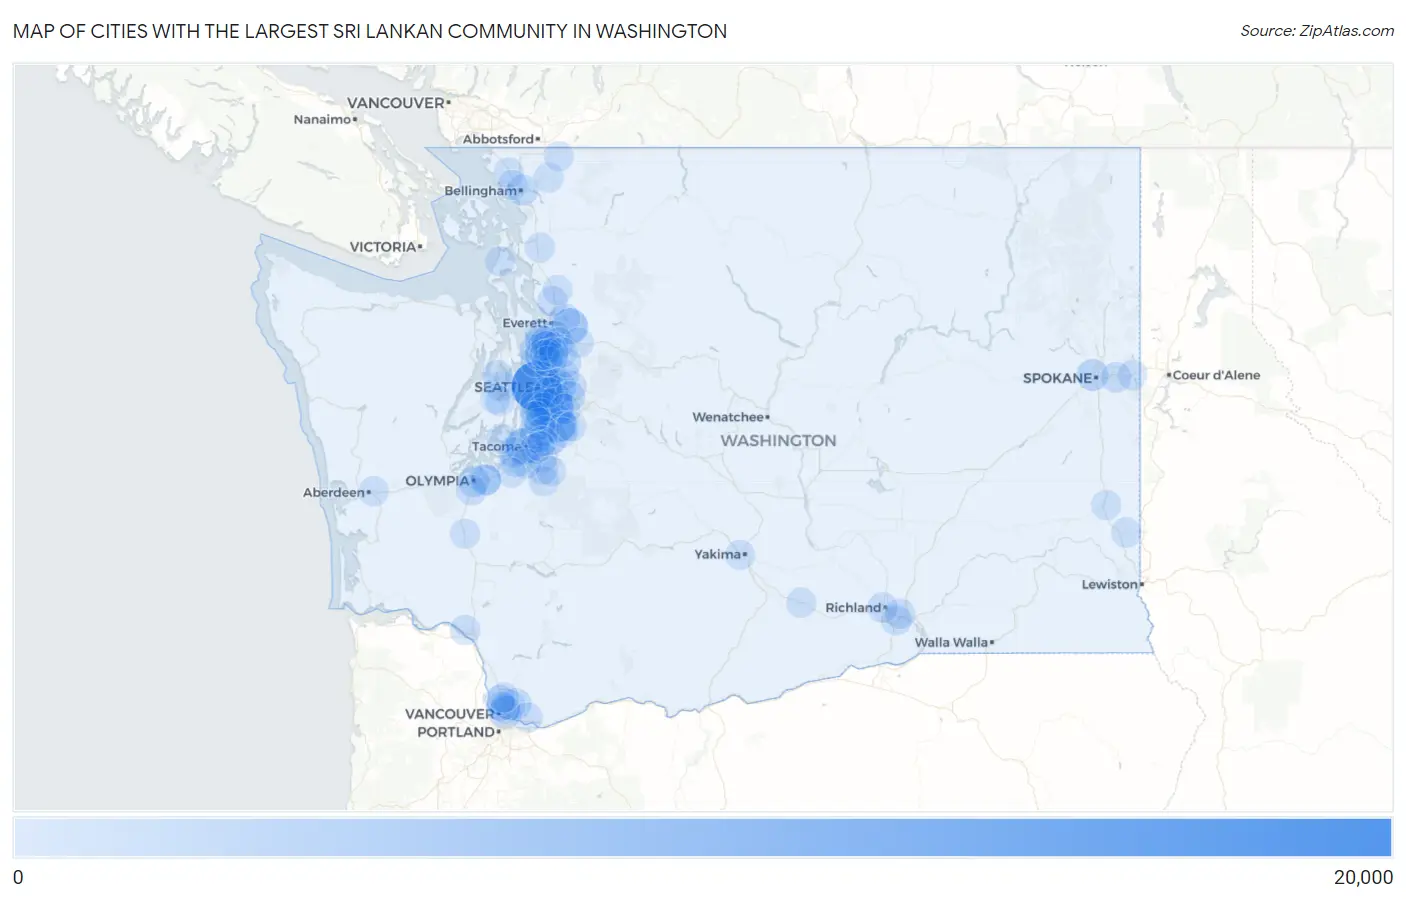
Map of Cities with the Largest Sri Lankan Community in Washington
0
20,000
Cities with the Largest Sri Lankan Community in Washington
| City | Sri Lankan | vs State | vs National | |
| 1. | Seattle | 16,148 | 103,901(15.54%)#1 | 2,246,463(0.72%)#14 |
| 2. | Renton | 7,668 | 103,901(7.38%)#2 | 2,246,463(0.34%)#35 |
| 3. | Kent | 5,817 | 103,901(5.60%)#3 | 2,246,463(0.26%)#45 |
| 4. | Tacoma | 5,366 | 103,901(5.16%)#4 | 2,246,463(0.24%)#49 |
| 5. | Everett | 4,710 | 103,901(4.53%)#5 | 2,246,463(0.21%)#56 |
| 6. | Bellevue | 3,327 | 103,901(3.20%)#6 | 2,246,463(0.15%)#84 |
| 7. | Burien | 3,095 | 103,901(2.98%)#7 | 2,246,463(0.14%)#95 |
| 8. | Federal Way | 2,833 | 103,901(2.73%)#8 | 2,246,463(0.13%)#102 |
| 9. | Vancouver | 2,225 | 103,901(2.14%)#9 | 2,246,463(0.10%)#125 |
| 10. | Bryn Mawr Skyway | 2,045 | 103,901(1.97%)#10 | 2,246,463(0.09%)#136 |
| 11. | Tukwila | 1,770 | 103,901(1.70%)#11 | 2,246,463(0.08%)#170 |
| 12. | Auburn | 1,610 | 103,901(1.55%)#12 | 2,246,463(0.07%)#187 |
| 13. | Spokane | 1,576 | 103,901(1.52%)#13 | 2,246,463(0.07%)#195 |
| 14. | Lacey | 1,462 | 103,901(1.41%)#14 | 2,246,463(0.07%)#216 |
| 15. | White Center | 1,389 | 103,901(1.34%)#15 | 2,246,463(0.06%)#223 |
| 16. | Shoreline | 1,265 | 103,901(1.22%)#16 | 2,246,463(0.06%)#246 |
| 17. | Olympia | 1,260 | 103,901(1.21%)#17 | 2,246,463(0.06%)#249 |
| 18. | Des Moines | 1,250 | 103,901(1.20%)#18 | 2,246,463(0.06%)#253 |
| 19. | Lynnwood | 1,225 | 103,901(1.18%)#19 | 2,246,463(0.05%)#255 |
| 20. | Kirkland | 946 | 103,901(0.91%)#20 | 2,246,463(0.04%)#325 |
| 21. | Bellingham | 917 | 103,901(0.88%)#21 | 2,246,463(0.04%)#336 |
| 22. | Lakewood | 838 | 103,901(0.81%)#22 | 2,246,463(0.04%)#363 |
| 23. | Edmonds | 787 | 103,901(0.76%)#23 | 2,246,463(0.04%)#387 |
| 24. | Martha Lake | 786 | 103,901(0.76%)#24 | 2,246,463(0.03%)#388 |
| 25. | Fairwood Cdp King County | 722 | 103,901(0.69%)#25 | 2,246,463(0.03%)#418 |
| 26. | Orchards | 721 | 103,901(0.69%)#26 | 2,246,463(0.03%)#420 |
| 27. | Seatac | 705 | 103,901(0.68%)#27 | 2,246,463(0.03%)#429 |
| 28. | Eastmont | 693 | 103,901(0.67%)#28 | 2,246,463(0.03%)#435 |
| 29. | South Hill | 636 | 103,901(0.61%)#29 | 2,246,463(0.03%)#478 |
| 30. | Five Corners | 631 | 103,901(0.61%)#30 | 2,246,463(0.03%)#483 |
| 31. | Mukilteo | 617 | 103,901(0.59%)#31 | 2,246,463(0.03%)#492 |
| 32. | Bothell | 598 | 103,901(0.58%)#32 | 2,246,463(0.03%)#507 |
| 33. | Sammamish | 592 | 103,901(0.57%)#33 | 2,246,463(0.03%)#512 |
| 34. | University Place | 585 | 103,901(0.56%)#34 | 2,246,463(0.03%)#522 |
| 35. | Kennewick | 561 | 103,901(0.54%)#35 | 2,246,463(0.02%)#542 |
| 36. | Alderwood Manor | 539 | 103,901(0.52%)#36 | 2,246,463(0.02%)#561 |
| 37. | Lake Stevens | 533 | 103,901(0.51%)#37 | 2,246,463(0.02%)#567 |
| 38. | North Lynnwood | 528 | 103,901(0.51%)#38 | 2,246,463(0.02%)#573 |
| 39. | Spokane Valley | 525 | 103,901(0.51%)#39 | 2,246,463(0.02%)#575 |
| 40. | Redmond | 522 | 103,901(0.50%)#40 | 2,246,463(0.02%)#580 |
| 41. | Mountlake Terrace | 501 | 103,901(0.48%)#41 | 2,246,463(0.02%)#602 |
| 42. | Mill Creek East | 493 | 103,901(0.47%)#42 | 2,246,463(0.02%)#614 |
| 43. | Richland | 482 | 103,901(0.46%)#43 | 2,246,463(0.02%)#627 |
| 44. | Marysville | 477 | 103,901(0.46%)#44 | 2,246,463(0.02%)#634 |
| 45. | Puyallup | 476 | 103,901(0.46%)#45 | 2,246,463(0.02%)#638 |
| 46. | Newcastle | 463 | 103,901(0.45%)#46 | 2,246,463(0.02%)#652 |
| 47. | Pasco | 454 | 103,901(0.44%)#47 | 2,246,463(0.02%)#661 |
| 48. | Issaquah | 443 | 103,901(0.43%)#48 | 2,246,463(0.02%)#676 |
| 49. | Tracyton | 437 | 103,901(0.42%)#49 | 2,246,463(0.02%)#683 |
| 50. | Picnic Point | 377 | 103,901(0.36%)#50 | 2,246,463(0.02%)#765 |
| 51. | Silver Firs | 360 | 103,901(0.35%)#51 | 2,246,463(0.02%)#787 |
| 52. | Covington | 353 | 103,901(0.34%)#52 | 2,246,463(0.02%)#799 |
| 53. | Tumwater | 350 | 103,901(0.34%)#53 | 2,246,463(0.02%)#804 |
| 54. | Lakeland North | 332 | 103,901(0.32%)#54 | 2,246,463(0.01%)#835 |
| 55. | Longview | 310 | 103,901(0.30%)#55 | 2,246,463(0.01%)#881 |
| 56. | Camas | 291 | 103,901(0.28%)#56 | 2,246,463(0.01%)#936 |
| 57. | Lake Stickney | 287 | 103,901(0.28%)#57 | 2,246,463(0.01%)#953 |
| 58. | Silverdale | 279 | 103,901(0.27%)#58 | 2,246,463(0.01%)#974 |
| 59. | Larch Way | 269 | 103,901(0.26%)#59 | 2,246,463(0.01%)#999 |
| 60. | Bothell West | 256 | 103,901(0.25%)#60 | 2,246,463(0.01%)#1,029 |
| 61. | Fife | 249 | 103,901(0.24%)#61 | 2,246,463(0.01%)#1,053 |
| 62. | Graham | 246 | 103,901(0.24%)#62 | 2,246,463(0.01%)#1,058 |
| 63. | Kenmore | 223 | 103,901(0.21%)#63 | 2,246,463(0.01%)#1,136 |
| 64. | Lakeland South | 213 | 103,901(0.21%)#64 | 2,246,463(0.01%)#1,172 |
| 65. | Minnehaha | 213 | 103,901(0.21%)#65 | 2,246,463(0.01%)#1,173 |
| 66. | Mercer Island | 209 | 103,901(0.20%)#66 | 2,246,463(0.01%)#1,188 |
| 67. | Pullman | 204 | 103,901(0.20%)#67 | 2,246,463(0.01%)#1,208 |
| 68. | East Renton Highlands | 199 | 103,901(0.19%)#68 | 2,246,463(0.01%)#1,235 |
| 69. | Sunnyside | 193 | 103,901(0.19%)#69 | 2,246,463(0.01%)#1,260 |
| 70. | Bremerton | 191 | 103,901(0.18%)#70 | 2,246,463(0.01%)#1,271 |
| 71. | Parkland | 184 | 103,901(0.18%)#71 | 2,246,463(0.01%)#1,314 |
| 72. | Yakima | 176 | 103,901(0.17%)#72 | 2,246,463(0.01%)#1,361 |
| 73. | Monroe | 174 | 103,901(0.17%)#73 | 2,246,463(0.01%)#1,375 |
| 74. | Lake Morton Berrydale | 173 | 103,901(0.17%)#74 | 2,246,463(0.01%)#1,381 |
| 75. | Salmon Creek | 167 | 103,901(0.16%)#75 | 2,246,463(0.01%)#1,410 |
| 76. | Ferndale | 158 | 103,901(0.15%)#76 | 2,246,463(0.01%)#1,451 |
| 77. | Fort Lewis | 152 | 103,901(0.15%)#77 | 2,246,463(0.01%)#1,484 |
| 78. | Maple Valley | 147 | 103,901(0.14%)#78 | 2,246,463(0.01%)#1,514 |
| 79. | Hazel Dell | 139 | 103,901(0.13%)#79 | 2,246,463(0.01%)#1,574 |
| 80. | Mount Vernon | 136 | 103,901(0.13%)#80 | 2,246,463(0.01%)#1,593 |
| 81. | Brier | 135 | 103,901(0.13%)#81 | 2,246,463(0.01%)#1,611 |
| 82. | Arlington | 134 | 103,901(0.13%)#82 | 2,246,463(0.01%)#1,618 |
| 83. | Mount Vista | 133 | 103,901(0.13%)#83 | 2,246,463(0.01%)#1,626 |
| 84. | Colfax | 130 | 103,901(0.13%)#84 | 2,246,463(0.01%)#1,653 |
| 85. | Tanglewilde | 128 | 103,901(0.12%)#85 | 2,246,463(0.01%)#1,673 |
| 86. | Artondale | 127 | 103,901(0.12%)#86 | 2,246,463(0.01%)#1,683 |
| 87. | Port Orchard | 122 | 103,901(0.12%)#87 | 2,246,463(0.01%)#1,727 |
| 88. | Cottage Lake | 120 | 103,901(0.12%)#88 | 2,246,463(0.01%)#1,743 |
| 89. | Marietta Alderwood | 119 | 103,901(0.11%)#89 | 2,246,463(0.01%)#1,759 |
| 90. | Whidbey Island Station | 115 | 103,901(0.11%)#90 | 2,246,463(0.01%)#1,790 |
| 91. | Aberdeen | 113 | 103,901(0.11%)#91 | 2,246,463(0.01%)#1,805 |
| 92. | Maltby | 113 | 103,901(0.11%)#92 | 2,246,463(0.01%)#1,807 |
| 93. | Deming | 113 | 103,901(0.11%)#93 | 2,246,463(0.01%)#1,808 |
| 94. | Normandy Park | 110 | 103,901(0.11%)#94 | 2,246,463(0.00%)#1,831 |
| 95. | Bothell East | 109 | 103,901(0.10%)#95 | 2,246,463(0.00%)#1,838 |
| 96. | Milton | 108 | 103,901(0.10%)#96 | 2,246,463(0.00%)#1,851 |
| 97. | Liberty Lake | 104 | 103,901(0.10%)#97 | 2,246,463(0.00%)#1,886 |
| 98. | Peaceful Valley | 102 | 103,901(0.10%)#98 | 2,246,463(0.00%)#1,907 |
| 99. | Orting | 101 | 103,901(0.10%)#99 | 2,246,463(0.00%)#1,916 |
| 100. | Centralia | 97 | 103,901(0.09%)#100 | 2,246,463(0.00%)#1,969 |
Common Questions
What are the Top 10 Cities with the Largest Sri Lankan Community in Washington?
Top 10 Cities with the Largest Sri Lankan Community in Washington are:
#1
16,148
#2
7,668
#3
5,817
#4
5,366
#5
4,710
#6
3,327
#7
3,095
#8
2,833
#9
2,225
#10
2,045
What city has the Largest Sri Lankan Community in Washington?
Seattle has the Largest Sri Lankan Community in Washington with 16,148.
What is the Total Sri Lankan Population in the State of Washington?
Total Sri Lankan Population in Washington is 103,901.
What is the Total Sri Lankan Population in the United States?
Total Sri Lankan Population in the United States is 2,246,463.