Cities with the Highest Percentage of Immigrants from Nicaragua in Washington
RELATED REPORTS & OPTIONS
Nicaragua
Washington
Compare Cities
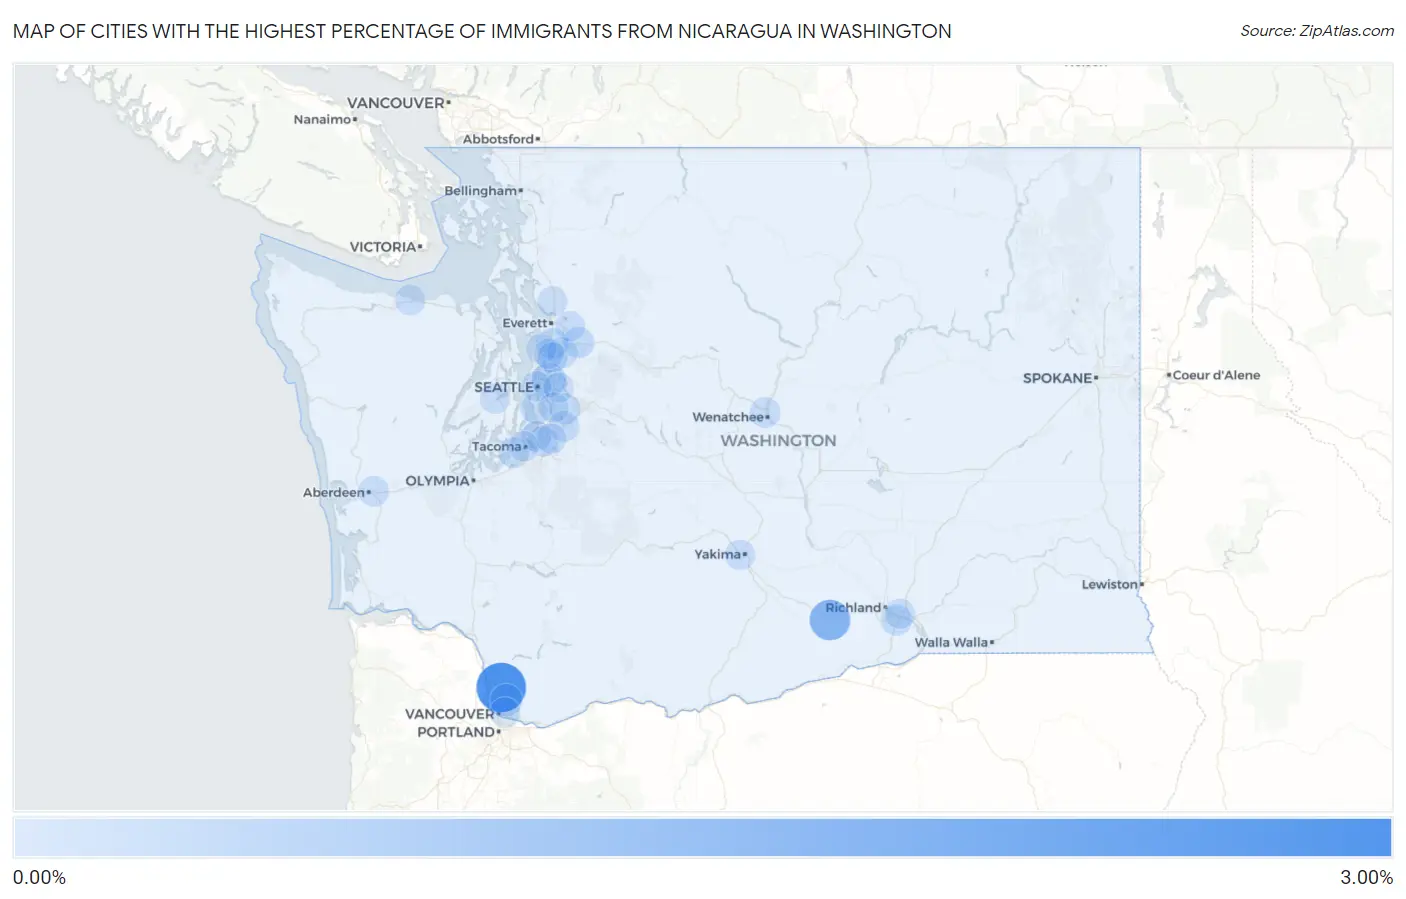
Map of Cities with the Highest Percentage of Immigrants from Nicaragua in Washington
0.00%
3.00%
Cities with the Highest Percentage of Immigrants from Nicaragua in Washington
| City | Nicaragua | vs State | vs National | |
| 1. | Duluth | 2.96% | 0.018%(+2.94)#-1 | 0.077%(+2.88)#0 |
| 2. | Prosser | 1.56% | 0.018%(+1.55)#0 | 0.077%(+1.49)#1 |
| 3. | Hunts Point | 0.62% | 0.018%(+0.602)#1 | 0.077%(+0.542)#2 |
| 4. | Barberton | 0.31% | 0.018%(+0.297)#2 | 0.077%(+0.238)#3 |
| 5. | Mill Creek | 0.18% | 0.018%(+0.160)#3 | 0.077%(+0.101)#4 |
| 6. | Burien | 0.16% | 0.018%(+0.138)#4 | 0.077%(+0.078)#5 |
| 7. | Monroe | 0.14% | 0.018%(+0.125)#5 | 0.077%(+0.066)#6 |
| 8. | Kennewick | 0.13% | 0.018%(+0.108)#6 | 0.077%(+0.048)#7 |
| 9. | Fairwood Cdp King County | 0.12% | 0.018%(+0.101)#15 | 0.077%(+0.041)#1,224 |
| 10. | East Renton Highlands | 0.12% | 0.018%(+0.098)#16 | 0.077%(+0.039)#1,225 |
| 11. | University Place | 0.092% | 0.018%(+0.075)#17 | 0.077%(+0.015)#1,226 |
| 12. | Wenatchee | 0.090% | 0.018%(+0.073)#18 | 0.077%(+0.013)#1,227 |
| 13. | Maltby | 0.088% | 0.018%(+0.071)#19 | 0.077%(+0.011)#1,228 |
| 14. | Lakeland South | 0.087% | 0.018%(+0.070)#20 | 0.077%(+0.010)#1,229 |
| 15. | Covington | 0.082% | 0.018%(+0.064)#21 | 0.077%(+0.005)#1,230 |
| 16. | Port Angeles | 0.070% | 0.018%(+0.052)#22 | 0.077%(-0.007)#1,231 |
| 17. | Federal Way | 0.066% | 0.018%(+0.049)#23 | 0.077%(-0.011)#1,232 |
| 18. | Auburn | 0.062% | 0.018%(+0.044)#24 | 0.077%(-0.015)#1,233 |
| 19. | Aberdeen | 0.053% | 0.018%(+0.035)#25 | 0.077%(-0.024)#1,234 |
| 20. | Vancouver | 0.048% | 0.018%(+0.030)#29 | 0.077%(-0.029)#1,626 |
| 21. | Lynnwood | 0.048% | 0.018%(+0.030)#30 | 0.077%(-0.029)#1,627 |
| 22. | Yakima | 0.039% | 0.018%(+0.022)#31 | 0.077%(-0.038)#1,628 |
| 23. | Pasco | 0.035% | 0.018%(+0.017)#32 | 0.077%(-0.042)#1,629 |
| 24. | Everett | 0.026% | 0.018%(+0.009)#33 | 0.077%(-0.051)#1,630 |
| 25. | Bothell | 0.025% | 0.018%(+0.007)#34 | 0.077%(-0.052)#1,631 |
| 26. | Bremerton | 0.025% | 0.018%(+0.007)#35 | 0.077%(-0.052)#1,634 |
| 27. | Bothell West | 0.024% | 0.018%(+0.007)#36 | 0.077%(-0.053)#1,635 |
| 28. | Seattle | 0.021% | 0.018%(+0.003)#37 | 0.077%(-0.056)#1,636 |
| 29. | Renton | 0.017% | 0.018%(-0.000)#38 | 0.077%(-0.060)#1,637 |
| 30. | Marysville | 0.013% | 0.018%(-0.005)#39 | 0.077%(-0.064)#1,638 |
| 31. | Tacoma | 0.012% | 0.018%(-0.005)#40 | 0.077%(-0.065)#1,639 |
| 32. | Bellevue | 0.0100% | 0.018%(-0.008)#41 | 0.077%(-0.067)#1,640 |
Common Questions
What are the Top 10 Cities with the Highest Percentage of Immigrants from Nicaragua in Washington?
Top 10 Cities with the Highest Percentage of Immigrants from Nicaragua in Washington are:
#1
2.96%
#2
1.56%
#3
0.62%
#4
0.31%
#5
0.18%
#6
0.16%
#7
0.14%
#8
0.13%
#9
0.12%
#10
0.092%
What city has the Highest Percentage of Immigrants from Nicaragua in Washington?
Duluth has the Highest Percentage of Immigrants from Nicaragua in Washington with 2.96%.
What is the Percentage of Immigrants from Nicaragua in the State of Washington?
Percentage of Immigrants from Nicaragua in Washington is 0.018%.
What is the Percentage of Immigrants from Nicaragua in the United States?
Percentage of Immigrants from Nicaragua in the United States is 0.077%.