Republic, WA Map & Demographics
Republic Map
Republic Overview
$29,582
PER CAPITA INCOME
$57,250
AVG FAMILY INCOME
$45,658
AVG HOUSEHOLD INCOME
24.9%
WAGE / INCOME GAP [ % ]
75.1¢/ $1
WAGE / INCOME GAP [ $ ]
0.50
INEQUALITY / GINI INDEX
1,120
TOTAL POPULATION
585
MALE POPULATION
535
FEMALE POPULATION
109.35
MALES / 100 FEMALES
91.45
FEMALES / 100 MALES
44.8
MEDIAN AGE
2.9
AVG FAMILY SIZE
2.1
AVG HOUSEHOLD SIZE
370
LABOR FORCE [ PEOPLE ]
41.1%
PERCENT IN LABOR FORCE
5.4%
UNEMPLOYMENT RATE
Republic Zip Codes
Republic Area Codes
Income in Republic
Income Overview in Republic
Per Capita Income in Republic is $29,582, while median incomes of families and households are $57,250 and $45,658 respectively.
| Characteristic | Number | Measure |
| Per Capita Income | 1,120 | $29,582 |
| Median Family Income | 232 | $57,250 |
| Mean Family Income | 232 | $91,760 |
| Median Household Income | 478 | $45,658 |
| Mean Household Income | 478 | $64,094 |
| Income Deficit | 232 | $0 |
| Wage / Income Gap (%) | 1,120 | 24.89% |
| Wage / Income Gap ($) | 1,120 | 75.11¢ per $1 |
| Gini / Inequality Index | 1,120 | 0.50 |
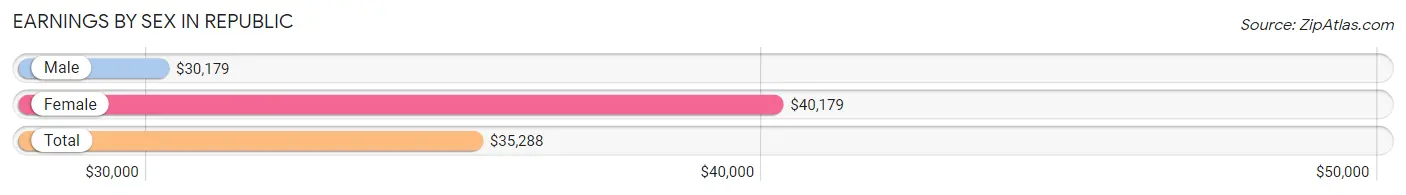
Earnings by Sex in Republic
Average Earnings in Republic are $35,288, $30,179 for men and $40,179 for women, a difference of 24.9%.
| Sex | Number | Average Earnings |
| Male | 242 (56.7%) | $30,179 |
| Female | 185 (43.3%) | $40,179 |
| Total | 427 (100.0%) | $35,288 |
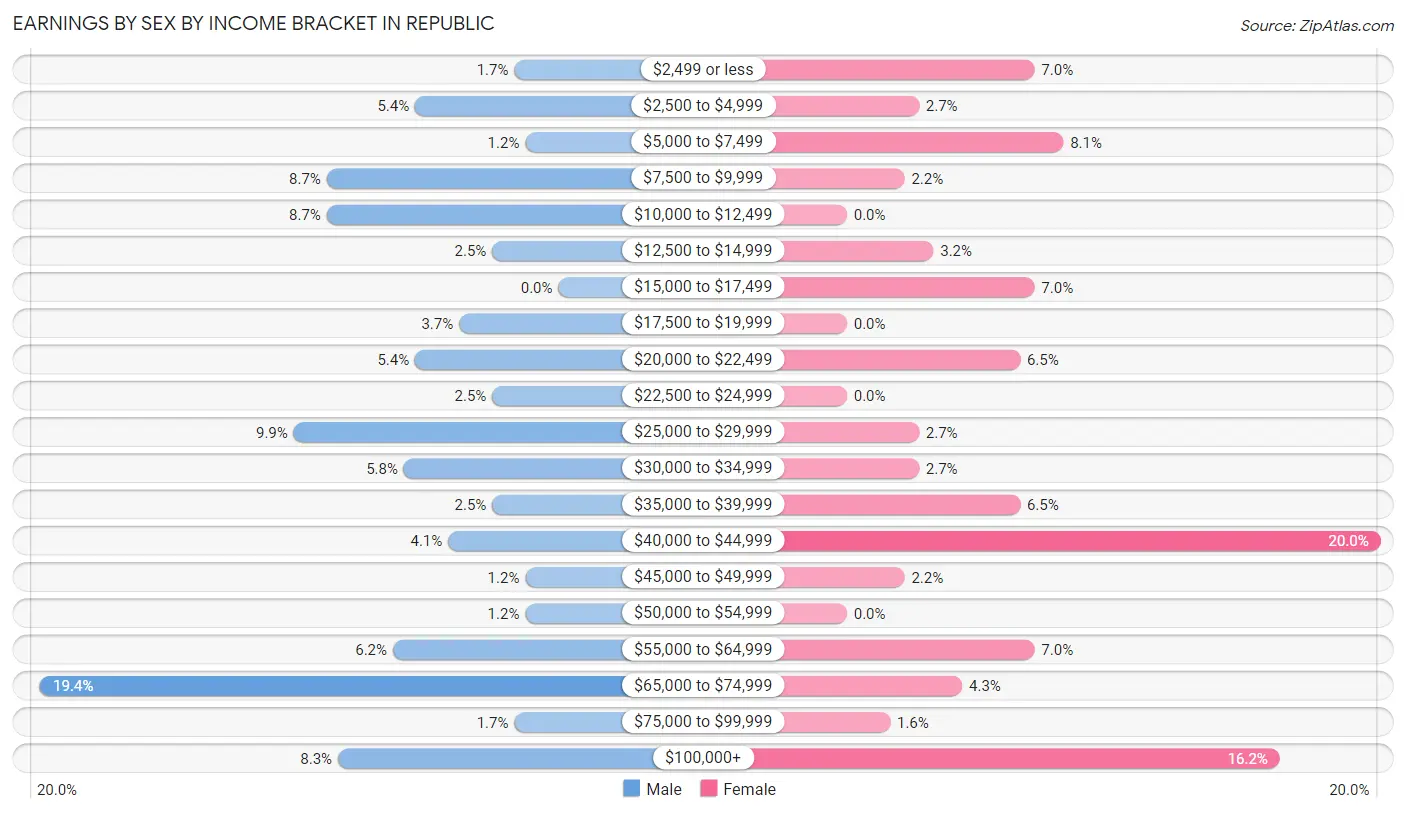
Earnings by Sex by Income Bracket in Republic
The most common earnings brackets in Republic are $65,000 to $74,999 for men (47 | 19.4%) and $40,000 to $44,999 for women (37 | 20.0%).
| Income | Male | Female |
| $2,499 or less | 4 (1.7%) | 13 (7.0%) |
| $2,500 to $4,999 | 13 (5.4%) | 5 (2.7%) |
| $5,000 to $7,499 | 3 (1.2%) | 15 (8.1%) |
| $7,500 to $9,999 | 21 (8.7%) | 4 (2.2%) |
| $10,000 to $12,499 | 21 (8.7%) | 0 (0.0%) |
| $12,500 to $14,999 | 6 (2.5%) | 6 (3.2%) |
| $15,000 to $17,499 | 0 (0.0%) | 13 (7.0%) |
| $17,500 to $19,999 | 9 (3.7%) | 0 (0.0%) |
| $20,000 to $22,499 | 13 (5.4%) | 12 (6.5%) |
| $22,500 to $24,999 | 6 (2.5%) | 0 (0.0%) |
| $25,000 to $29,999 | 24 (9.9%) | 5 (2.7%) |
| $30,000 to $34,999 | 14 (5.8%) | 5 (2.7%) |
| $35,000 to $39,999 | 6 (2.5%) | 12 (6.5%) |
| $40,000 to $44,999 | 10 (4.1%) | 37 (20.0%) |
| $45,000 to $49,999 | 3 (1.2%) | 4 (2.2%) |
| $50,000 to $54,999 | 3 (1.2%) | 0 (0.0%) |
| $55,000 to $64,999 | 15 (6.2%) | 13 (7.0%) |
| $65,000 to $74,999 | 47 (19.4%) | 8 (4.3%) |
| $75,000 to $99,999 | 4 (1.7%) | 3 (1.6%) |
| $100,000+ | 20 (8.3%) | 30 (16.2%) |
| Total | 242 (100.0%) | 185 (100.0%) |
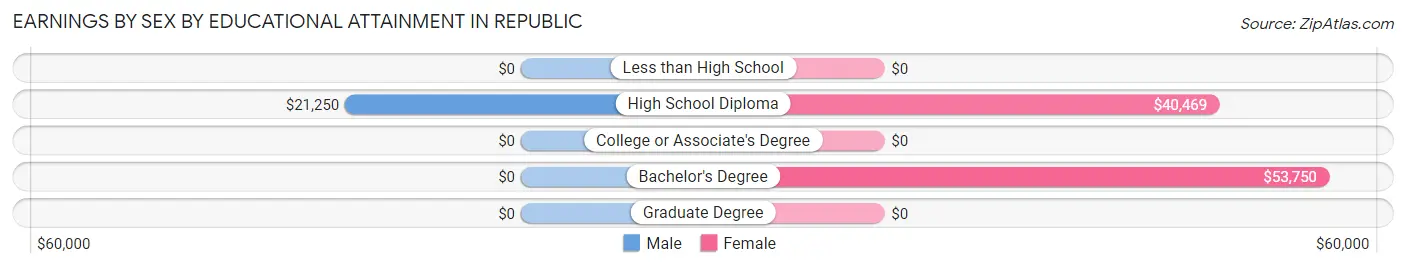
Earnings by Sex by Educational Attainment in Republic
Average earnings in Republic are $27,404 for men and $40,464 for women, a difference of 32.3%. Men with an educational attainment of high school diploma enjoy the highest average annual earnings of $21,250, while those with high school diploma education earn the least with $21,250. Women with an educational attainment of bachelor's degree earn the most with the average annual earnings of $53,750, while those with high school diploma education have the smallest earnings of $40,469.
| Educational Attainment | Male Income | Female Income |
| Less than High School | - | - |
| High School Diploma | $21,250 | $40,469 |
| College or Associate's Degree | - | - |
| Bachelor's Degree | - | - |
| Graduate Degree | - | - |
| Total | $27,404 | $40,464 |
Family Income in Republic
Family Income Brackets in Republic
According to the Republic family income data, there are 66 families falling into the $35,000 to $49,999 income range, which is the most common income bracket and makes up 28.4% of all families.
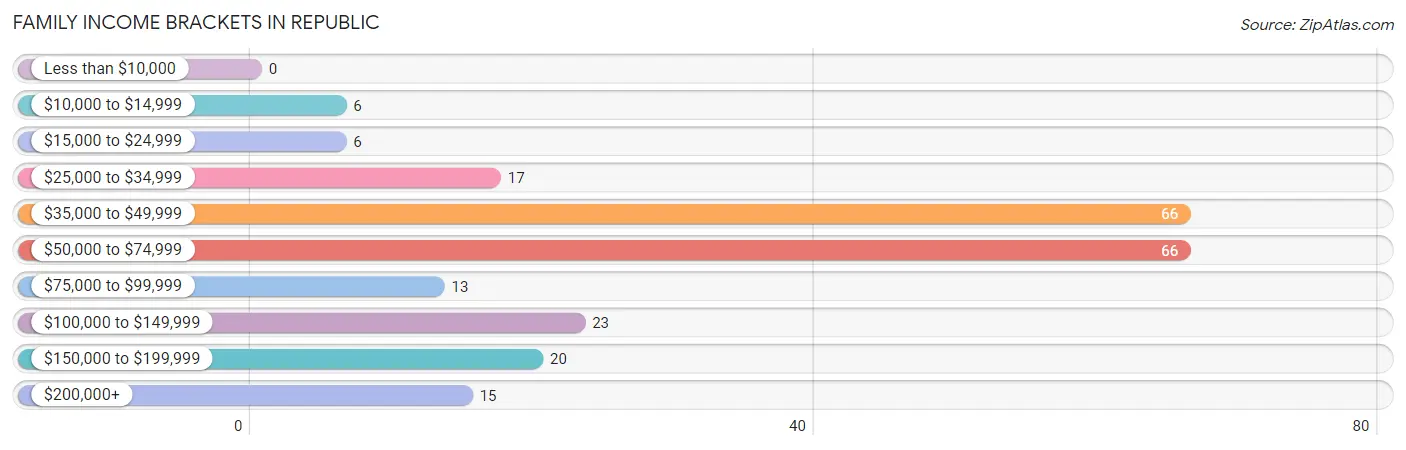
| Income Bracket | # Families | % Families |
| Less than $10,000 | 0 | 0.0% |
| $10,000 to $14,999 | 6 | 2.6% |
| $15,000 to $24,999 | 6 | 2.6% |
| $25,000 to $34,999 | 17 | 7.3% |
| $35,000 to $49,999 | 66 | 28.4% |
| $50,000 to $74,999 | 66 | 28.4% |
| $75,000 to $99,999 | 13 | 5.6% |
| $100,000 to $149,999 | 23 | 9.9% |
| $150,000 to $199,999 | 20 | 8.6% |
| $200,000+ | 15 | 6.5% |
Family Income by Famaliy Size in Republic
4-person families (55 | 23.7%) account for the highest median family income in Republic with $71,553 per family, while 2-person families (126 | 54.3%) have the highest median income of $28,021 per family member.
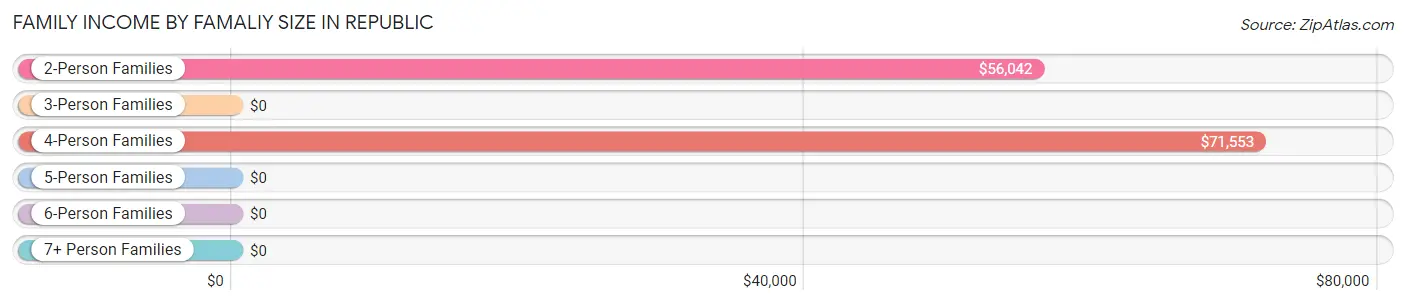
| Income Bracket | # Families | Median Income |
| 2-Person Families | 126 (54.3%) | $56,042 |
| 3-Person Families | 25 (10.8%) | $0 |
| 4-Person Families | 55 (23.7%) | $71,553 |
| 5-Person Families | 6 (2.6%) | $0 |
| 6-Person Families | 20 (8.6%) | $0 |
| 7+ Person Families | 0 (0.0%) | $0 |
| Total | 232 (100.0%) | $57,250 |
Family Income by Number of Earners in Republic
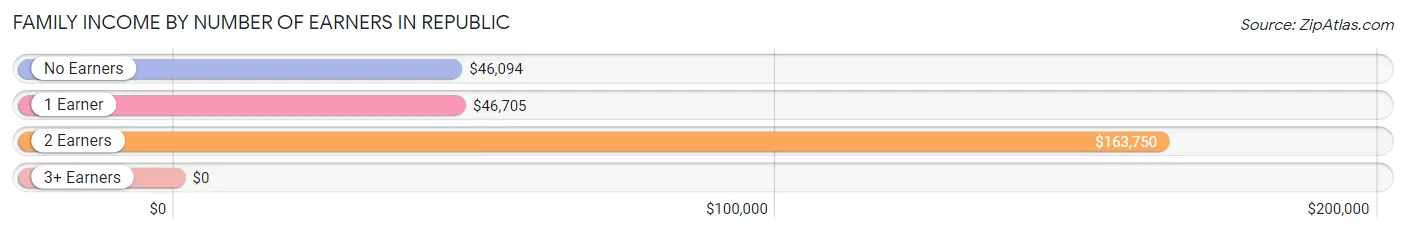
| Number of Earners | # Families | Median Income |
| No Earners | 41 (17.7%) | $46,094 |
| 1 Earner | 133 (57.3%) | $46,705 |
| 2 Earners | 55 (23.7%) | $163,750 |
| 3+ Earners | 3 (1.3%) | $0 |
| Total | 232 (100.0%) | $57,250 |
Household Income in Republic
Household Income Brackets in Republic
With 93 households falling in the category, the $50,000 to $74,999 income range is the most frequent in Republic, accounting for 19.5% of all households. In contrast, only 9 households (1.9%) fall into the less than $10,000 income bracket, making it the least populous group.
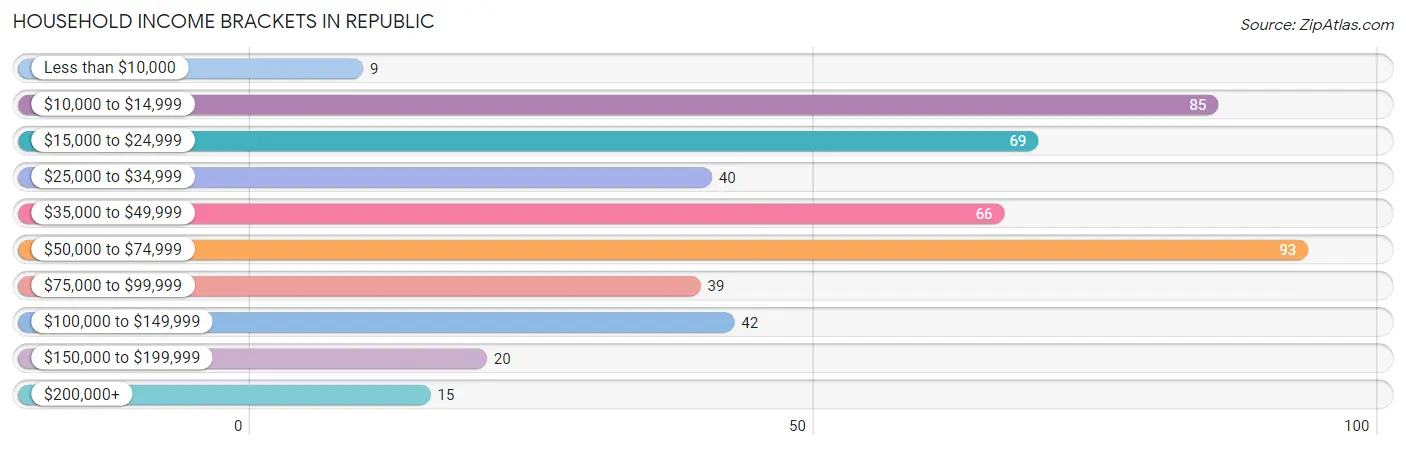
| Income Bracket | # Households | % Households |
| Less than $10,000 | 9 | 1.9% |
| $10,000 to $14,999 | 85 | 17.8% |
| $15,000 to $24,999 | 69 | 14.4% |
| $25,000 to $34,999 | 40 | 8.4% |
| $35,000 to $49,999 | 66 | 13.8% |
| $50,000 to $74,999 | 93 | 19.5% |
| $75,000 to $99,999 | 39 | 8.2% |
| $100,000 to $149,999 | 42 | 8.8% |
| $150,000 to $199,999 | 20 | 4.2% |
| $200,000+ | 15 | 3.1% |
Household Income by Householder Age in Republic
The median household income in Republic is $45,658, with the highest median household income of $55,625 found in the 25 to 44 years age bracket for the primary householder. A total of 98 households (20.5%) fall into this category. Meanwhile, the 15 to 24 years age bracket for the primary householder has the lowest median household income of $0, with 39 households (8.2%) in this group.
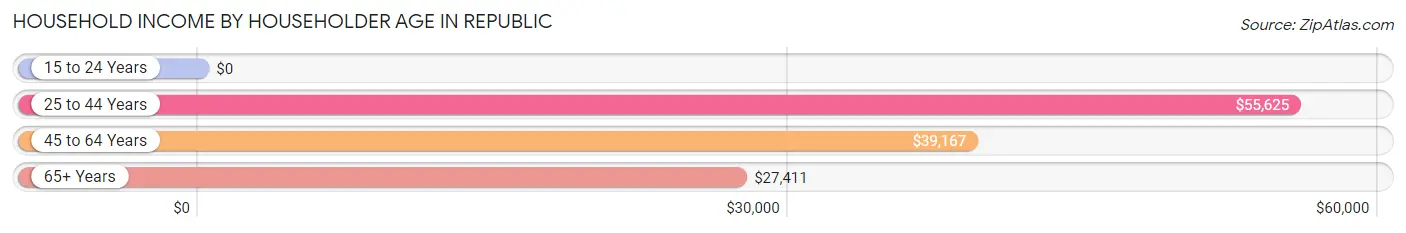
| Income Bracket | # Households | Median Income |
| 15 to 24 Years | 39 (8.2%) | $0 |
| 25 to 44 Years | 98 (20.5%) | $55,625 |
| 45 to 64 Years | 144 (30.1%) | $39,167 |
| 65+ Years | 197 (41.2%) | $27,411 |
| Total | 478 (100.0%) | $45,658 |
Poverty in Republic
Income Below Poverty by Sex and Age in Republic
With 12.7% poverty level for males and 19.4% for females among the residents of Republic, 25 to 34 year old males and 16 and 17 year old females are the most vulnerable to poverty, with 16 males (30.2%) and 6 females (100.0%) in their respective age groups living below the poverty level.
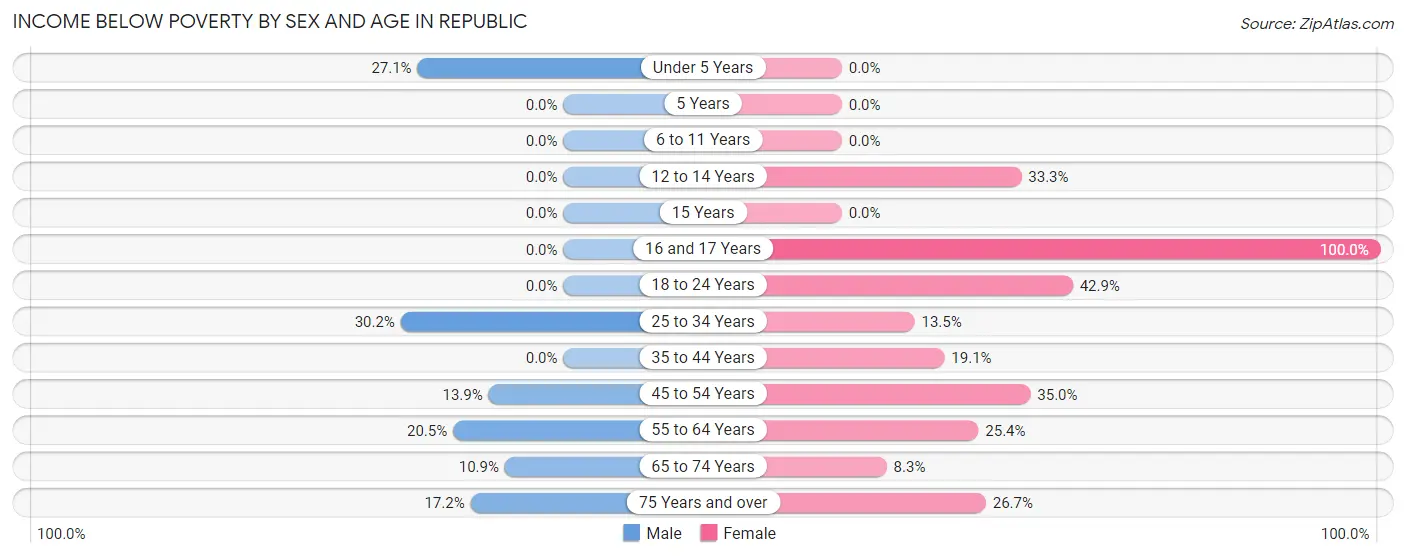
| Age Bracket | Male | Female |
| Under 5 Years | 13 (27.1%) | 0 (0.0%) |
| 5 Years | 0 (0.0%) | 0 (0.0%) |
| 6 to 11 Years | 0 (0.0%) | 0 (0.0%) |
| 12 to 14 Years | 0 (0.0%) | 5 (33.3%) |
| 15 Years | 0 (0.0%) | 0 (0.0%) |
| 16 and 17 Years | 0 (0.0%) | 6 (100.0%) |
| 18 to 24 Years | 0 (0.0%) | 6 (42.9%) |
| 25 to 34 Years | 16 (30.2%) | 10 (13.5%) |
| 35 to 44 Years | 0 (0.0%) | 8 (19.1%) |
| 45 to 54 Years | 5 (13.9%) | 14 (35.0%) |
| 55 to 64 Years | 17 (20.5%) | 18 (25.4%) |
| 65 to 74 Years | 10 (10.9%) | 7 (8.3%) |
| 75 Years and over | 5 (17.2%) | 27 (26.7%) |
| Total | 66 (12.7%) | 101 (19.4%) |
Income Above Poverty by Sex and Age in Republic
According to the poverty statistics in Republic, males aged 5 years and females aged under 5 years are the age groups that are most secure financially, with 100.0% of males and 100.0% of females in these age groups living above the poverty line.
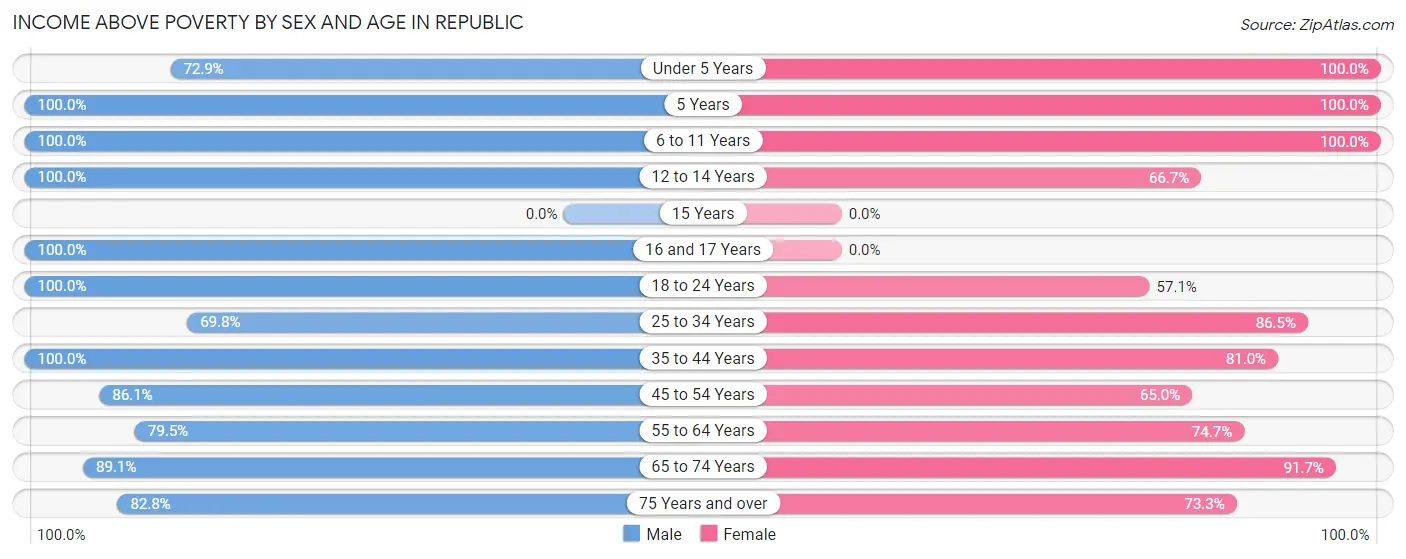
| Age Bracket | Male | Female |
| Under 5 Years | 35 (72.9%) | 25 (100.0%) |
| 5 Years | 8 (100.0%) | 4 (100.0%) |
| 6 to 11 Years | 49 (100.0%) | 44 (100.0%) |
| 12 to 14 Years | 9 (100.0%) | 10 (66.7%) |
| 15 Years | 0 (0.0%) | 0 (0.0%) |
| 16 and 17 Years | 7 (100.0%) | 0 (0.0%) |
| 18 to 24 Years | 42 (100.0%) | 8 (57.1%) |
| 25 to 34 Years | 37 (69.8%) | 64 (86.5%) |
| 35 to 44 Years | 62 (100.0%) | 34 (80.9%) |
| 45 to 54 Years | 31 (86.1%) | 26 (65.0%) |
| 55 to 64 Years | 66 (79.5%) | 53 (74.7%) |
| 65 to 74 Years | 82 (89.1%) | 77 (91.7%) |
| 75 Years and over | 24 (82.8%) | 74 (73.3%) |
| Total | 452 (87.3%) | 419 (80.6%) |
Income Below Poverty Among Married-Couple Families in Republic
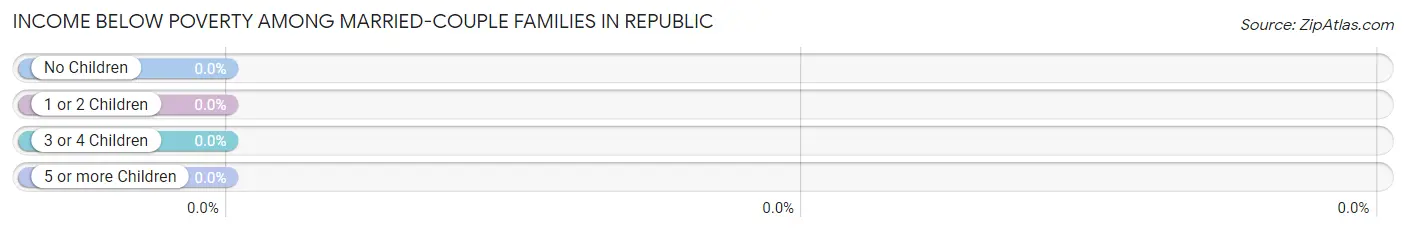
| Children | Above Poverty | Below Poverty |
| No Children | 73 (100.0%) | 0 (0.0%) |
| 1 or 2 Children | 53 (100.0%) | 0 (0.0%) |
| 3 or 4 Children | 10 (100.0%) | 0 (0.0%) |
| 5 or more Children | 0 (0.0%) | 0 (0.0%) |
| Total | 136 (100.0%) | 0 (0.0%) |
Income Below Poverty Among Single-Parent Households in Republic
According to the poverty data in Republic, 23.1% or 3 single-father households and 3.6% or 3 single-mother households are living below the poverty line. Among single-father households, those with 3 or 4 children have the highest poverty rate, with 3 households (100.0%) experiencing poverty. Likewise, among single-mother households, those with no children have the highest poverty rate, with 3 households (5.3%) falling below the poverty line.
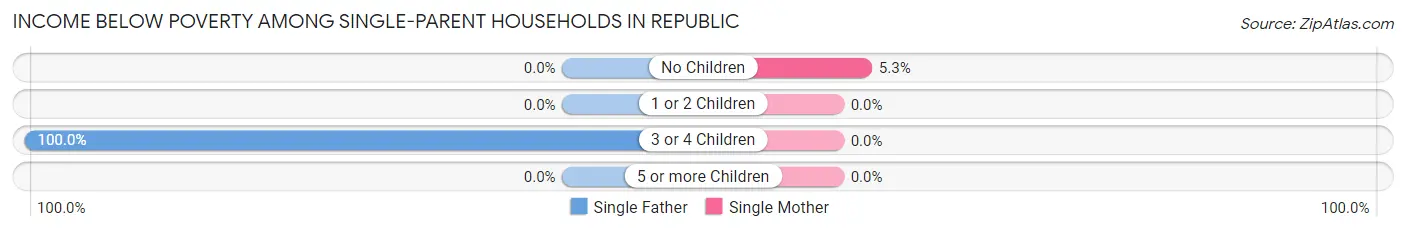
| Children | Single Father | Single Mother |
| No Children | 0 (0.0%) | 3 (5.3%) |
| 1 or 2 Children | 0 (0.0%) | 0 (0.0%) |
| 3 or 4 Children | 3 (100.0%) | 0 (0.0%) |
| 5 or more Children | 0 (0.0%) | 0 (0.0%) |
| Total | 3 (23.1%) | 3 (3.6%) |
Income Below Poverty Among Married-Couple vs Single-Parent Households in Republic
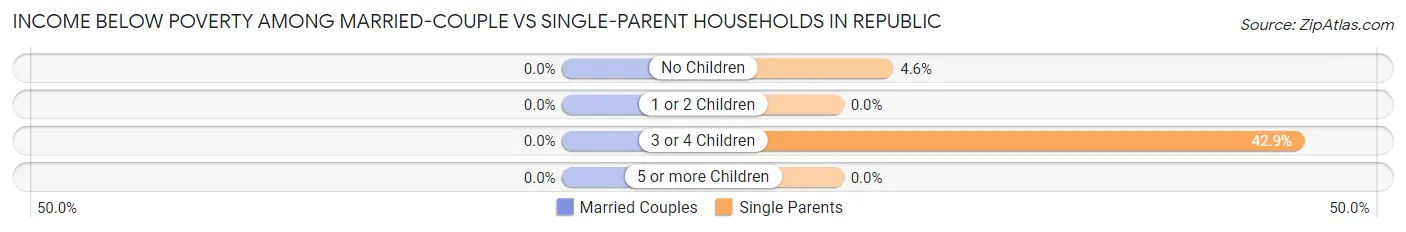
| Children | Married-Couple Families | Single-Parent Households |
| No Children | 0 (0.0%) | 3 (4.6%) |
| 1 or 2 Children | 0 (0.0%) | 0 (0.0%) |
| 3 or 4 Children | 0 (0.0%) | 3 (42.9%) |
| 5 or more Children | 0 (0.0%) | 0 (0.0%) |
| Total | 0 (0.0%) | 6 (6.2%) |
Race in Republic
The most populous races in Republic are White / Caucasian (926 | 82.7%), Two or more Races (143 | 12.8%), and Hawaiian / Pacific (26 | 2.3%).
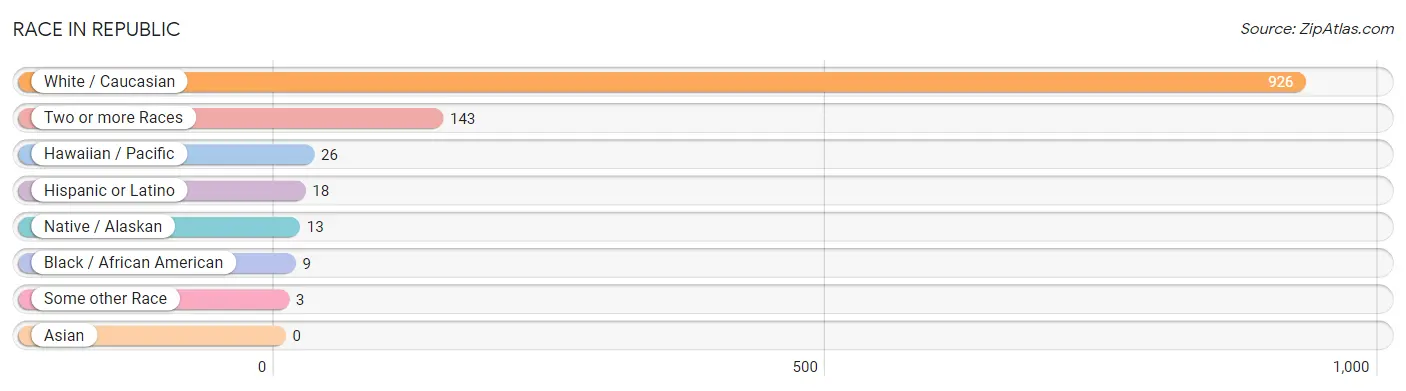
| Race | # Population | % Population |
| Asian | 0 | 0.0% |
| Black / African American | 9 | 0.8% |
| Hawaiian / Pacific | 26 | 2.3% |
| Hispanic or Latino | 18 | 1.6% |
| Native / Alaskan | 13 | 1.2% |
| White / Caucasian | 926 | 82.7% |
| Two or more Races | 143 | 12.8% |
| Some other Race | 3 | 0.3% |
| Total | 1,120 | 100.0% |
Ancestry in Republic
The most populous ancestries reported in Republic are German (180 | 16.1%), Irish (143 | 12.8%), English (137 | 12.2%), European (53 | 4.7%), and American (52 | 4.6%), together accounting for 50.4% of all Republic residents.
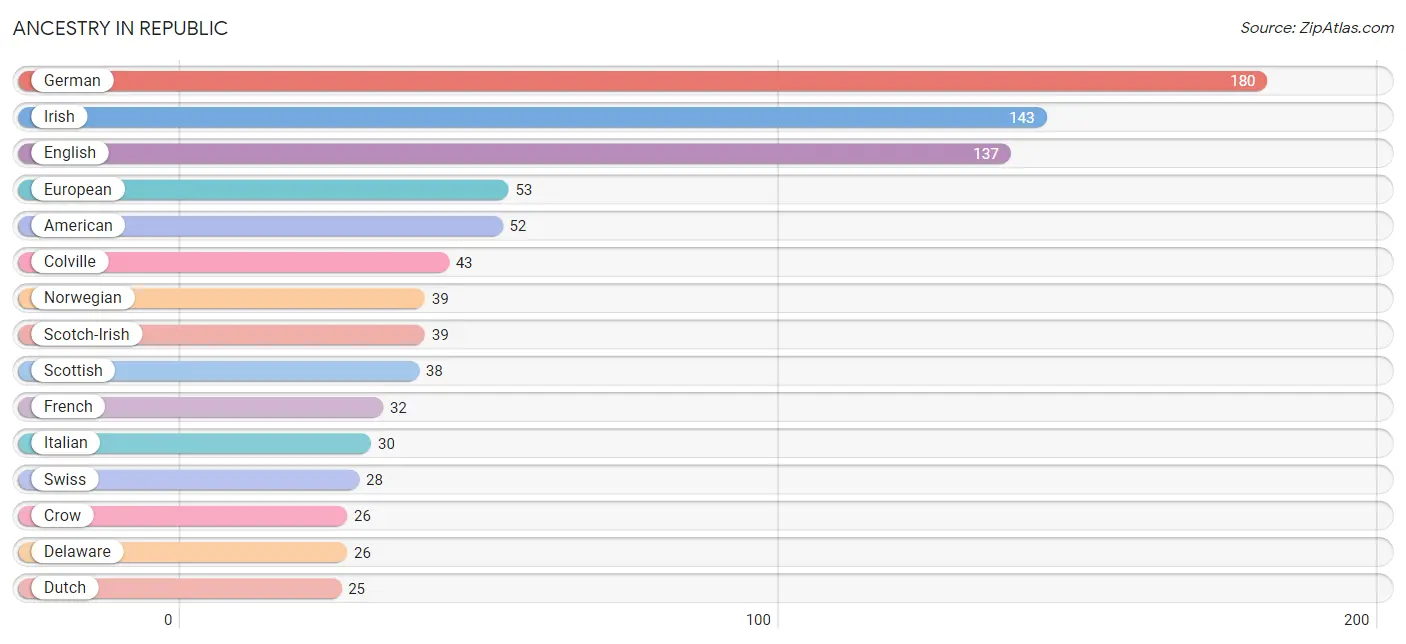
| Ancestry | # Population | % Population |
| American | 52 | 4.6% |
| Cherokee | 1 | 0.1% |
| Colombian | 1 | 0.1% |
| Colville | 43 | 3.8% |
| Crow | 26 | 2.3% |
| Danish | 2 | 0.2% |
| Delaware | 26 | 2.3% |
| Dutch | 25 | 2.2% |
| English | 137 | 12.2% |
| Ethiopian | 1 | 0.1% |
| European | 53 | 4.7% |
| Finnish | 8 | 0.7% |
| French | 32 | 2.9% |
| French Canadian | 8 | 0.7% |
| German | 180 | 16.1% |
| Guamanian / Chamorro | 22 | 2.0% |
| Irish | 143 | 12.8% |
| Italian | 30 | 2.7% |
| Mexican | 16 | 1.4% |
| Native Hawaiian | 4 | 0.4% |
| Northern European | 5 | 0.4% |
| Norwegian | 39 | 3.5% |
| Polish | 20 | 1.8% |
| Puget Sound Salish | 3 | 0.3% |
| Russian | 2 | 0.2% |
| Scandinavian | 10 | 0.9% |
| Scotch-Irish | 39 | 3.5% |
| Scottish | 38 | 3.4% |
| Serbian | 18 | 1.6% |
| Sioux | 12 | 1.1% |
| South American | 1 | 0.1% |
| Subsaharan African | 1 | 0.1% |
| Swedish | 7 | 0.6% |
| Swiss | 28 | 2.5% |
| Thai | 21 | 1.9% |
| Welsh | 12 | 1.1% | View All 36 Rows |
Immigrants in Republic
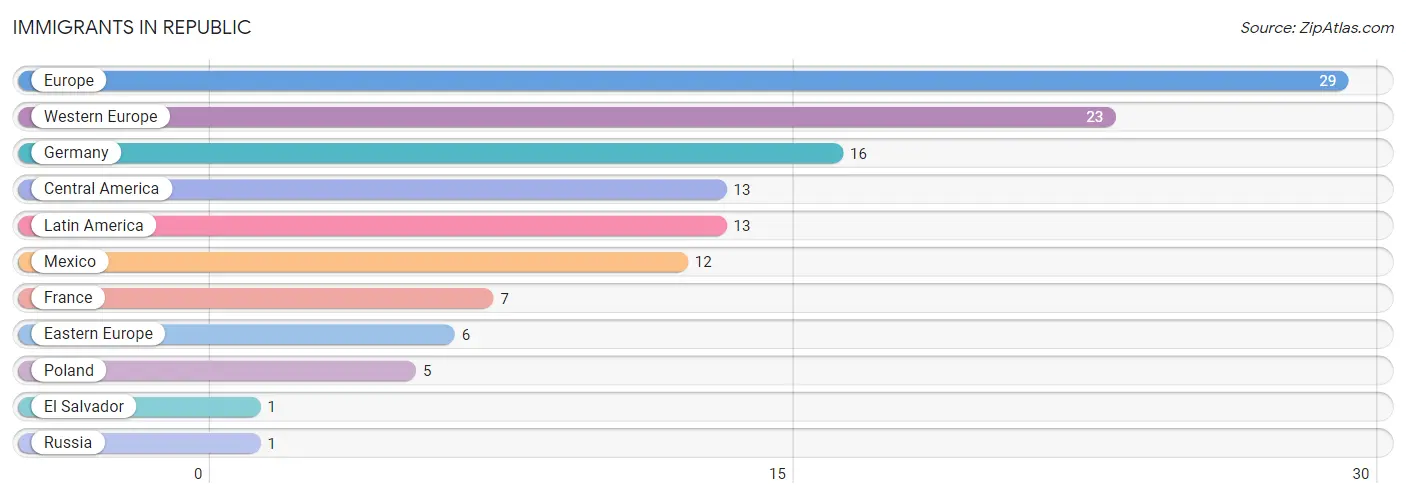
The most numerous immigrant groups reported in Republic came from Europe (29 | 2.6%), Western Europe (23 | 2.1%), Germany (16 | 1.4%), Central America (13 | 1.2%), and Latin America (13 | 1.2%), together accounting for 8.4% of all Republic residents.
| Immigration Origin | # Population | % Population |
| Central America | 13 | 1.2% |
| Eastern Europe | 6 | 0.5% |
| El Salvador | 1 | 0.1% |
| Europe | 29 | 2.6% |
| France | 7 | 0.6% |
| Germany | 16 | 1.4% |
| Latin America | 13 | 1.2% |
| Mexico | 12 | 1.1% |
| Poland | 5 | 0.4% |
| Russia | 1 | 0.1% |
| Western Europe | 23 | 2.1% | View All 11 Rows |
Sex and Age in Republic
Sex and Age in Republic
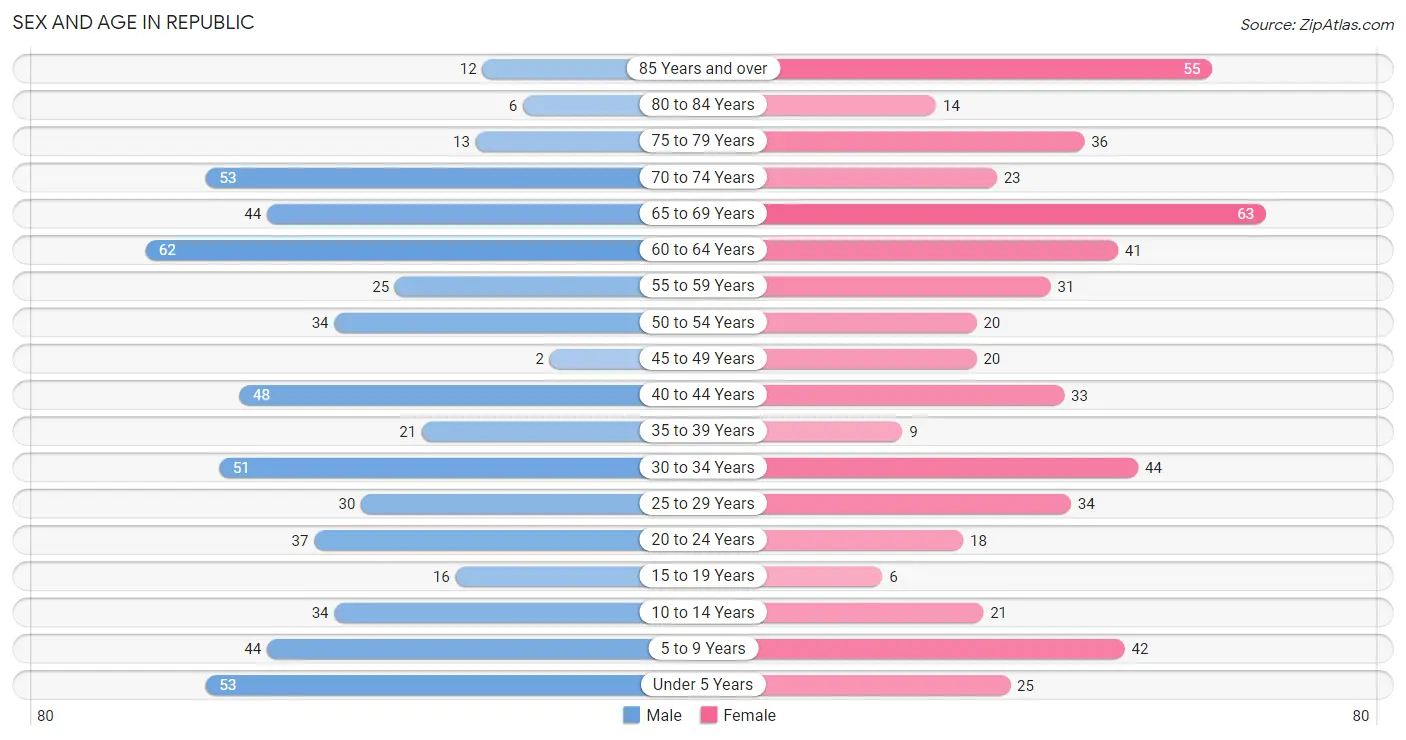
The most populous age groups in Republic are 60 to 64 Years (62 | 10.6%) for men and 65 to 69 Years (63 | 11.8%) for women.
| Age Bracket | Male | Female |
| Under 5 Years | 53 (9.1%) | 25 (4.7%) |
| 5 to 9 Years | 44 (7.5%) | 42 (7.9%) |
| 10 to 14 Years | 34 (5.8%) | 21 (3.9%) |
| 15 to 19 Years | 16 (2.7%) | 6 (1.1%) |
| 20 to 24 Years | 37 (6.3%) | 18 (3.4%) |
| 25 to 29 Years | 30 (5.1%) | 34 (6.4%) |
| 30 to 34 Years | 51 (8.7%) | 44 (8.2%) |
| 35 to 39 Years | 21 (3.6%) | 9 (1.7%) |
| 40 to 44 Years | 48 (8.2%) | 33 (6.2%) |
| 45 to 49 Years | 2 (0.3%) | 20 (3.7%) |
| 50 to 54 Years | 34 (5.8%) | 20 (3.7%) |
| 55 to 59 Years | 25 (4.3%) | 31 (5.8%) |
| 60 to 64 Years | 62 (10.6%) | 41 (7.7%) |
| 65 to 69 Years | 44 (7.5%) | 63 (11.8%) |
| 70 to 74 Years | 53 (9.1%) | 23 (4.3%) |
| 75 to 79 Years | 13 (2.2%) | 36 (6.7%) |
| 80 to 84 Years | 6 (1.0%) | 14 (2.6%) |
| 85 Years and over | 12 (2.1%) | 55 (10.3%) |
| Total | 585 (100.0%) | 535 (100.0%) |
Families and Households in Republic
Median Family Size in Republic
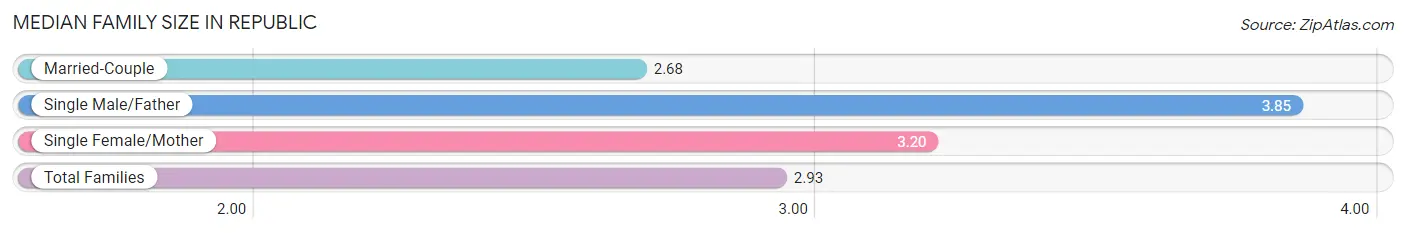
The median family size in Republic is 2.93 persons per family, with single male/father families (13 | 5.6%) accounting for the largest median family size of 3.85 persons per family. On the other hand, married-couple families (136 | 58.6%) represent the smallest median family size with 2.68 persons per family.
| Family Type | # Families | Family Size |
| Married-Couple | 136 (58.6%) | 2.68 |
| Single Male/Father | 13 (5.6%) | 3.85 |
| Single Female/Mother | 83 (35.8%) | 3.20 |
| Total Families | 232 (100.0%) | 2.93 |
Median Household Size in Republic
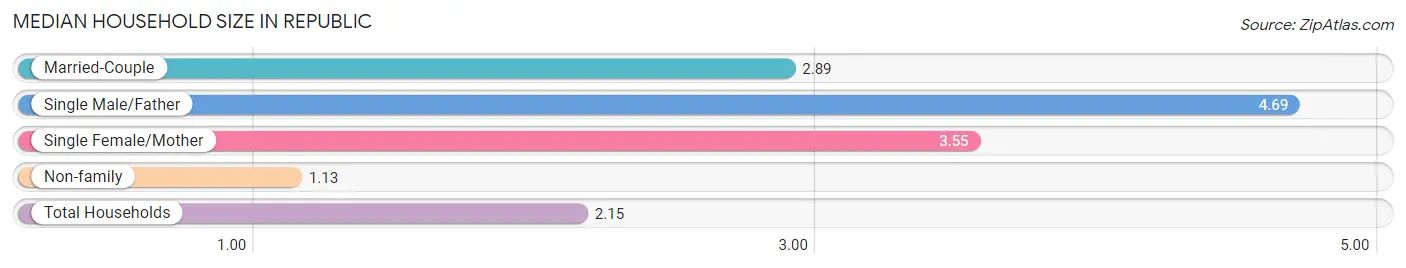
The median household size in Republic is 2.15 persons per household, with single male/father households (13 | 2.7%) accounting for the largest median household size of 4.69 persons per household. non-family households (246 | 51.5%) represent the smallest median household size with 1.13 persons per household.
| Household Type | # Households | Household Size |
| Married-Couple | 136 (28.4%) | 2.89 |
| Single Male/Father | 13 (2.7%) | 4.69 |
| Single Female/Mother | 83 (17.4%) | 3.55 |
| Non-family | 246 (51.5%) | 1.13 |
| Total Households | 478 (100.0%) | 2.15 |
Household Size by Marriage Status in Republic
Out of a total of 478 households in Republic, 232 (48.5%) are family households, while 246 (51.5%) are nonfamily households. The most numerous type of family households are 2-person households, comprising 110, and the most common type of nonfamily households are 1-person households, comprising 206.
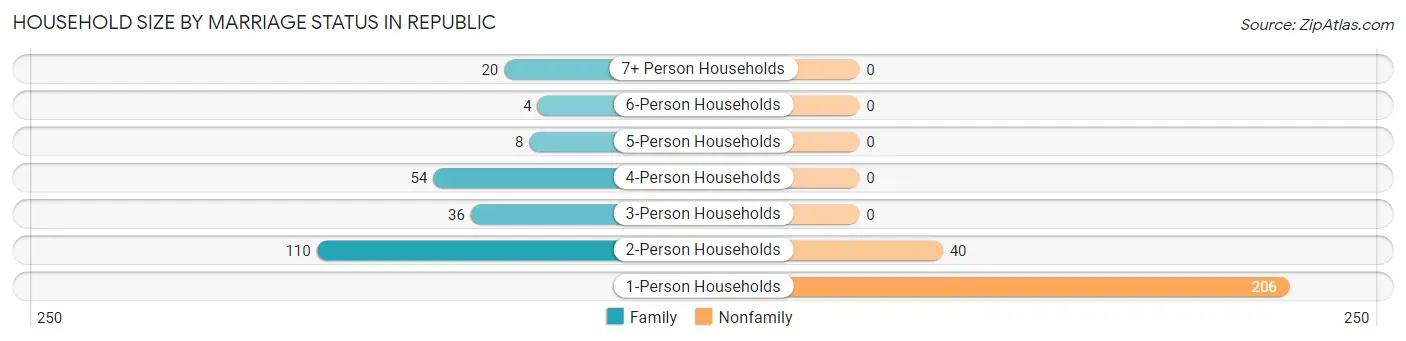
| Household Size | Family Households | Nonfamily Households |
| 1-Person Households | - | 206 (43.1%) |
| 2-Person Households | 110 (23.0%) | 40 (8.4%) |
| 3-Person Households | 36 (7.5%) | 0 (0.0%) |
| 4-Person Households | 54 (11.3%) | 0 (0.0%) |
| 5-Person Households | 8 (1.7%) | 0 (0.0%) |
| 6-Person Households | 4 (0.8%) | 0 (0.0%) |
| 7+ Person Households | 20 (4.2%) | 0 (0.0%) |
| Total | 232 (48.5%) | 246 (51.5%) |
Female Fertility in Republic
Fertility by Age in Republic
Average fertility rate in Republic is 88.0 births per 1,000 women. Women in the age bracket of 20 to 34 years have the highest fertility rate with 156.0 births per 1,000 women. Women in the age bracket of 20 to 34 years acount for 100.0% of all women with births.
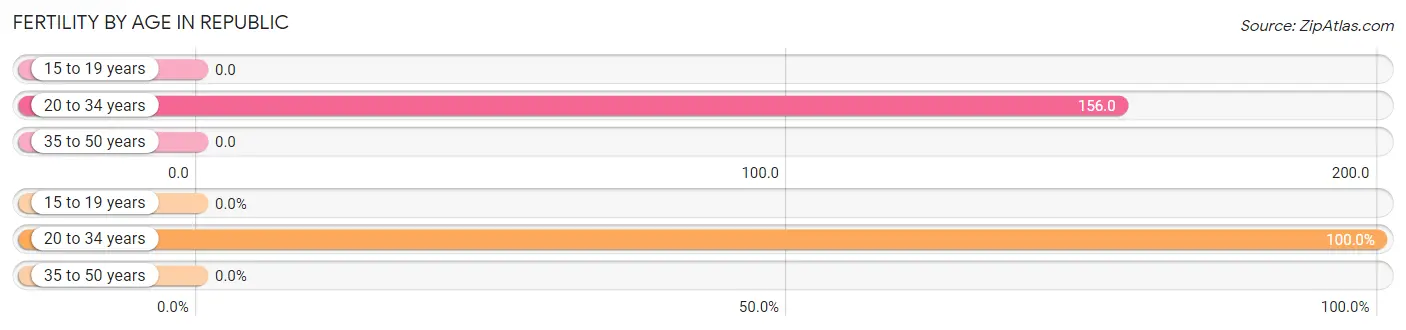
| Age Bracket | Women with Births | Births / 1,000 Women |
| 15 to 19 years | 0 (0.0%) | 0.0 |
| 20 to 34 years | 15 (100.0%) | 156.0 |
| 35 to 50 years | 0 (0.0%) | 0.0 |
| Total | 15 (100.0%) | 88.0 |
Fertility by Age by Marriage Status in Republic
73.3% of women with births (15) in Republic are married. The highest percentage of unmarried women with births falls into 20 to 34 years age bracket with 26.7% of them unmarried at the time of birth, while the lowest percentage of unmarried women with births belong to 20 to 34 years age bracket with 26.7% of them unmarried.
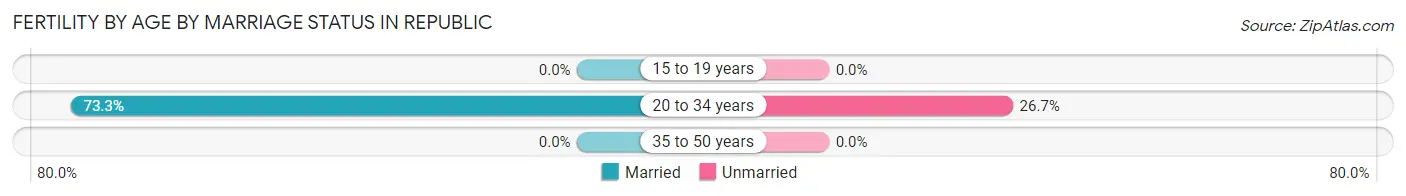
| Age Bracket | Married | Unmarried |
| 15 to 19 years | 0 (0.0%) | 0 (0.0%) |
| 20 to 34 years | 11 (73.3%) | 4 (26.7%) |
| 35 to 50 years | 0 (0.0%) | 0 (0.0%) |
| Total | 11 (73.3%) | 4 (26.7%) |
Fertility by Education in Republic
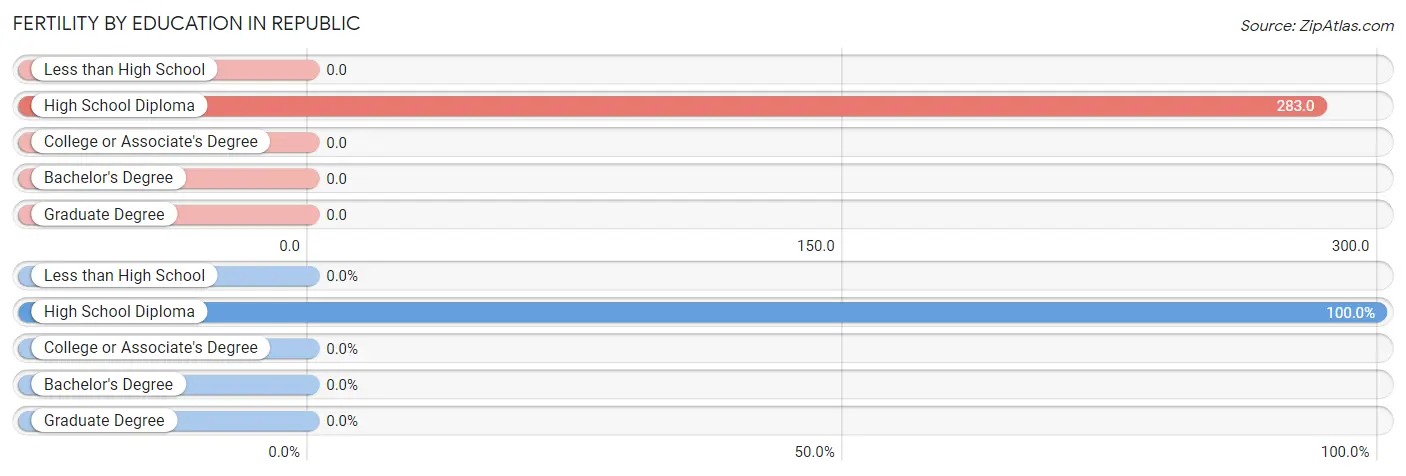
| Educational Attainment | Women with Births | Births / 1,000 Women |
| Less than High School | 0 (0.0%) | 0.0 |
| High School Diploma | 15 (100.0%) | 283.0 |
| College or Associate's Degree | 0 (0.0%) | 0.0 |
| Bachelor's Degree | 0 (0.0%) | 0.0 |
| Graduate Degree | 0 (0.0%) | 0.0 |
| Total | 15 (100.0%) | 88.0 |
Fertility by Education by Marriage Status in Republic
26.7% of women with births in Republic are unmarried. Women with the educational attainment of high school diploma are most likely to be married with 73.3% of them married at childbirth, while women with the educational attainment of high school diploma are least likely to be married with 26.7% of them unmarried at childbirth.
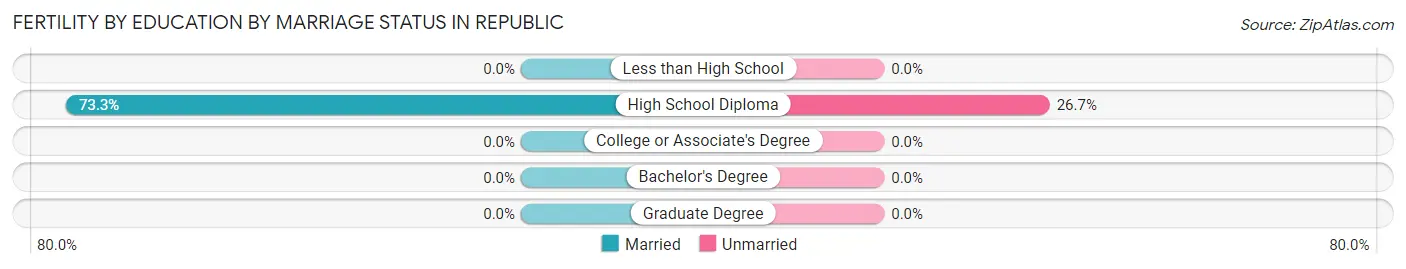
| Educational Attainment | Married | Unmarried |
| Less than High School | 0 (0.0%) | 0 (0.0%) |
| High School Diploma | 11 (73.3%) | 4 (26.7%) |
| College or Associate's Degree | 0 (0.0%) | 0 (0.0%) |
| Bachelor's Degree | 0 (0.0%) | 0 (0.0%) |
| Graduate Degree | 0 (0.0%) | 0 (0.0%) |
| Total | 11 (73.3%) | 4 (26.7%) |
Employment Characteristics in Republic
Employment by Class of Employer in Republic
Among the 347 employed individuals in Republic, private company employees (119 | 34.3%), state government employees (50 | 14.4%), and not-for-profit organizations (49 | 14.1%) make up the most common classes of employment.
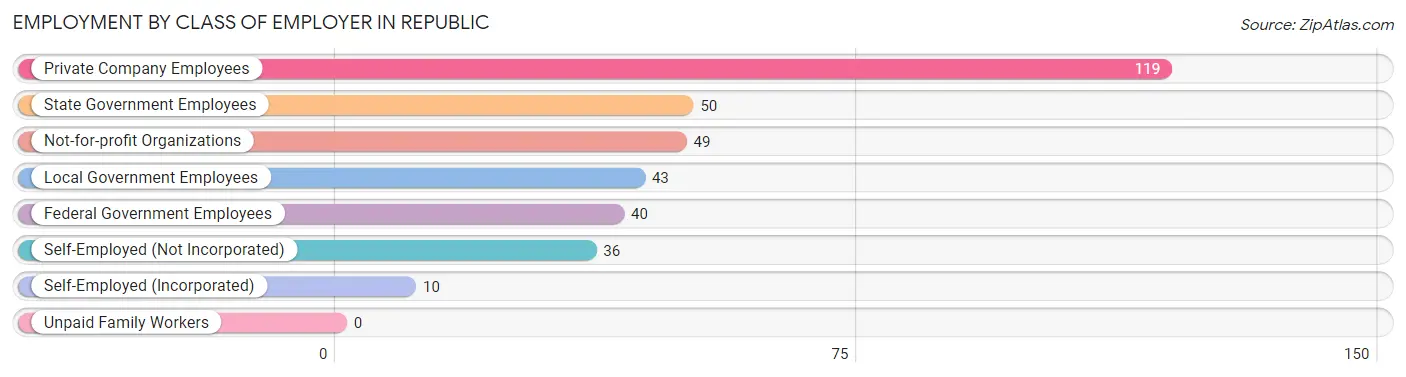
| Employer Class | # Employees | % Employees |
| Private Company Employees | 119 | 34.3% |
| Self-Employed (Incorporated) | 10 | 2.9% |
| Self-Employed (Not Incorporated) | 36 | 10.4% |
| Not-for-profit Organizations | 49 | 14.1% |
| Local Government Employees | 43 | 12.4% |
| State Government Employees | 50 | 14.4% |
| Federal Government Employees | 40 | 11.5% |
| Unpaid Family Workers | 0 | 0.0% |
| Total | 347 | 100.0% |
Employment Status by Age in Republic
According to the labor force statistics for Republic, out of the total population over 16 years of age (901), 41.1% or 370 individuals are in the labor force, with 5.4% or 20 of them unemployed. The age group with the highest labor force participation rate is 35 to 44 years, with 79.3% or 88 individuals in the labor force. Within the labor force, the 75 years and over age range has the highest percentage of unemployed individuals, with 100.0% or 11 of them being unemployed.
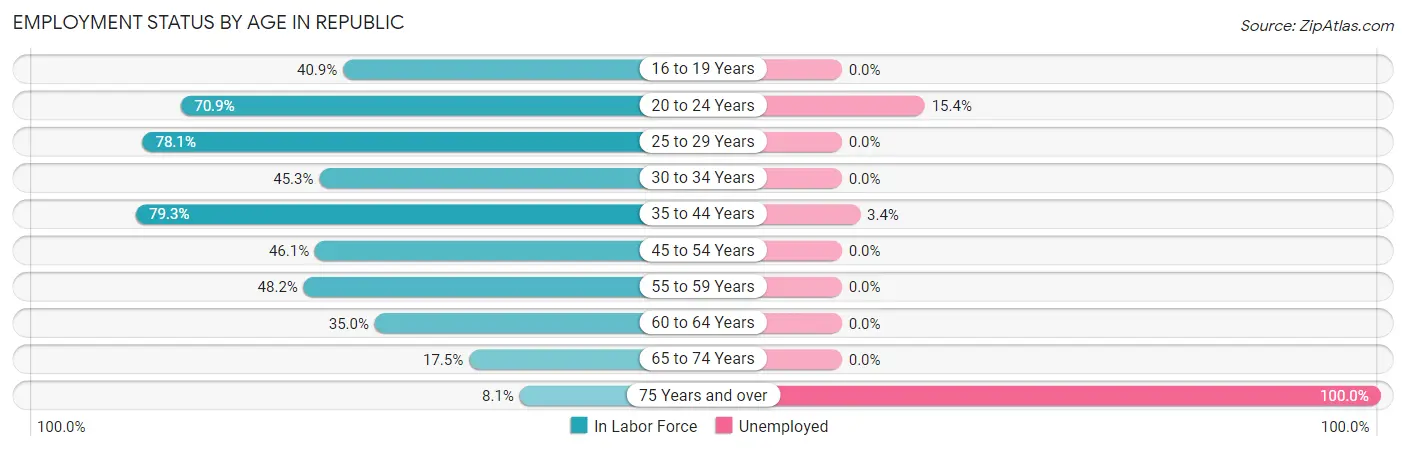
| Age Bracket | In Labor Force | Unemployed |
| 16 to 19 Years | 9 (40.9%) | 0 (0.0%) |
| 20 to 24 Years | 39 (70.9%) | 6 (15.4%) |
| 25 to 29 Years | 50 (78.1%) | 0 (0.0%) |
| 30 to 34 Years | 43 (45.3%) | 0 (0.0%) |
| 35 to 44 Years | 88 (79.3%) | 3 (3.4%) |
| 45 to 54 Years | 35 (46.1%) | 0 (0.0%) |
| 55 to 59 Years | 27 (48.2%) | 0 (0.0%) |
| 60 to 64 Years | 36 (35.0%) | 0 (0.0%) |
| 65 to 74 Years | 32 (17.5%) | 0 (0.0%) |
| 75 Years and over | 11 (8.1%) | 11 (100.0%) |
| Total | 370 (41.1%) | 20 (5.4%) |
Employment Status by Educational Attainment in Republic
According to labor force statistics for Republic, 55.2% of individuals (279) out of the total population between 25 and 64 years of age (505) are in the labor force, with 1.1% or 3 of them being unemployed. The group with the highest labor force participation rate are those with the educational attainment of bachelor's degree or higher, with 83.1% or 113 individuals in the labor force. Within the labor force, individuals with college / associate degree education have the highest percentage of unemployment, with 3.5% or 3 of them being unemployed.
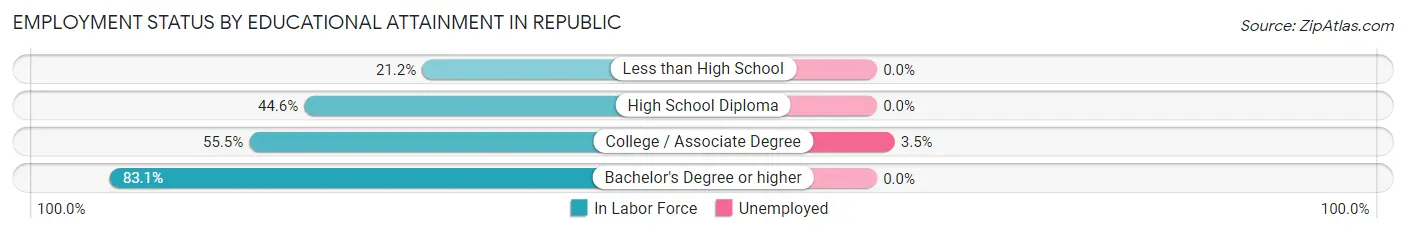
| Educational Attainment | In Labor Force | Unemployed |
| Less than High School | 14 (21.2%) | 0 (0.0%) |
| High School Diploma | 66 (44.6%) | 0 (0.0%) |
| College / Associate Degree | 86 (55.5%) | 5 (3.5%) |
| Bachelor's Degree or higher | 113 (83.1%) | 0 (0.0%) |
| Total | 279 (55.2%) | 6 (1.1%) |
Employment Occupations by Sex in Republic
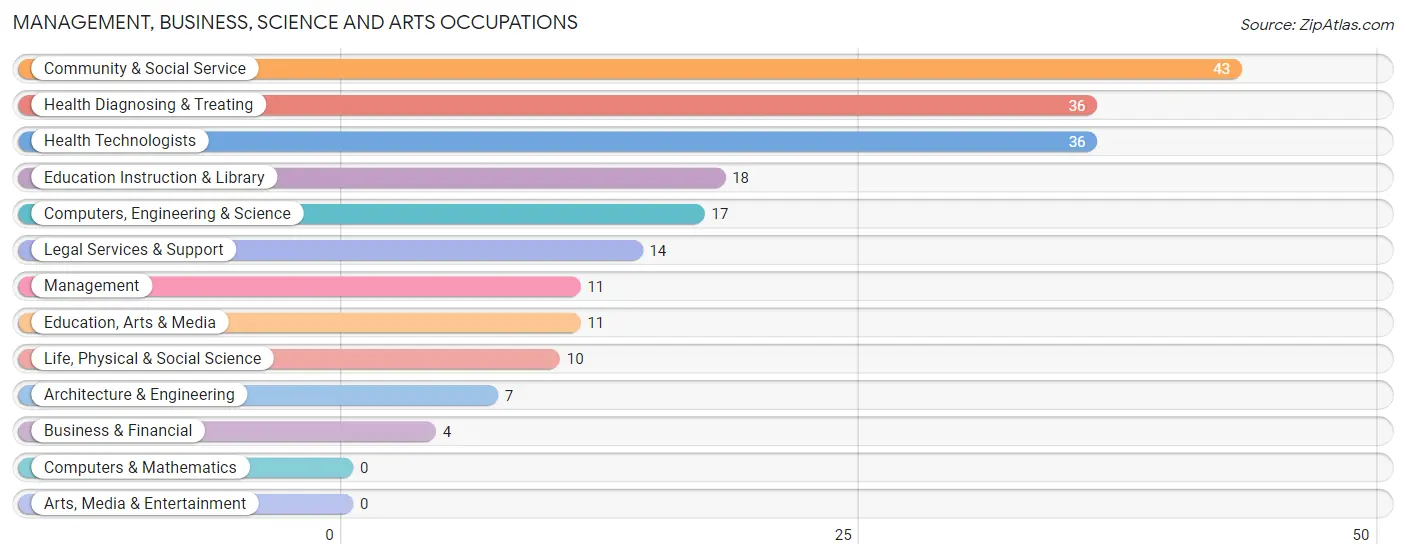
Management, Business, Science and Arts Occupations
The most common Management, Business, Science and Arts occupations in Republic are Community & Social Service (43 | 12.3%), Health Diagnosing & Treating (36 | 10.3%), Health Technologists (36 | 10.3%), Education Instruction & Library (18 | 5.1%), and Computers, Engineering & Science (17 | 4.9%).
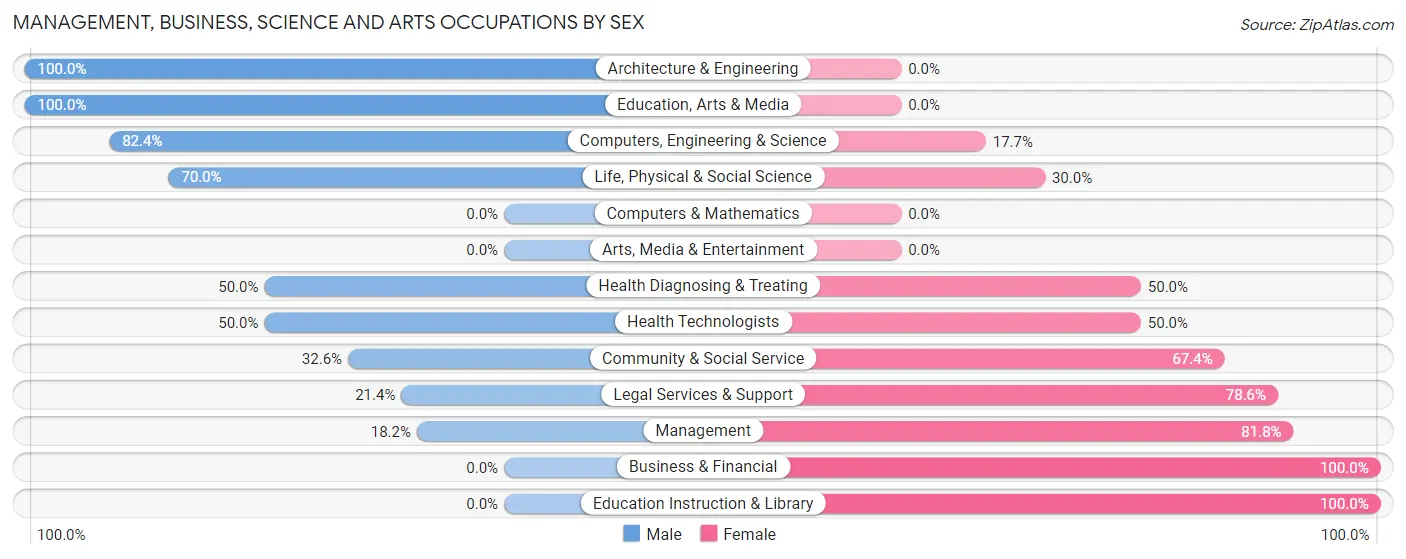
Management, Business, Science and Arts Occupations by Sex
Within the Management, Business, Science and Arts occupations in Republic, the most male-oriented occupations are Architecture & Engineering (100.0%), Education, Arts & Media (100.0%), and Computers, Engineering & Science (82.4%), while the most female-oriented occupations are Business & Financial (100.0%), Education Instruction & Library (100.0%), and Management (81.8%).
| Occupation | Male | Female |
| Management | 2 (18.2%) | 9 (81.8%) |
| Business & Financial | 0 (0.0%) | 4 (100.0%) |
| Computers, Engineering & Science | 14 (82.4%) | 3 (17.6%) |
| Computers & Mathematics | 0 (0.0%) | 0 (0.0%) |
| Architecture & Engineering | 7 (100.0%) | 0 (0.0%) |
| Life, Physical & Social Science | 7 (70.0%) | 3 (30.0%) |
| Community & Social Service | 14 (32.6%) | 29 (67.4%) |
| Education, Arts & Media | 11 (100.0%) | 0 (0.0%) |
| Legal Services & Support | 3 (21.4%) | 11 (78.6%) |
| Education Instruction & Library | 0 (0.0%) | 18 (100.0%) |
| Arts, Media & Entertainment | 0 (0.0%) | 0 (0.0%) |
| Health Diagnosing & Treating | 18 (50.0%) | 18 (50.0%) |
| Health Technologists | 18 (50.0%) | 18 (50.0%) |
| Total (Category) | 48 (43.2%) | 63 (56.8%) |
| Total (Overall) | 186 (53.1%) | 164 (46.9%) |
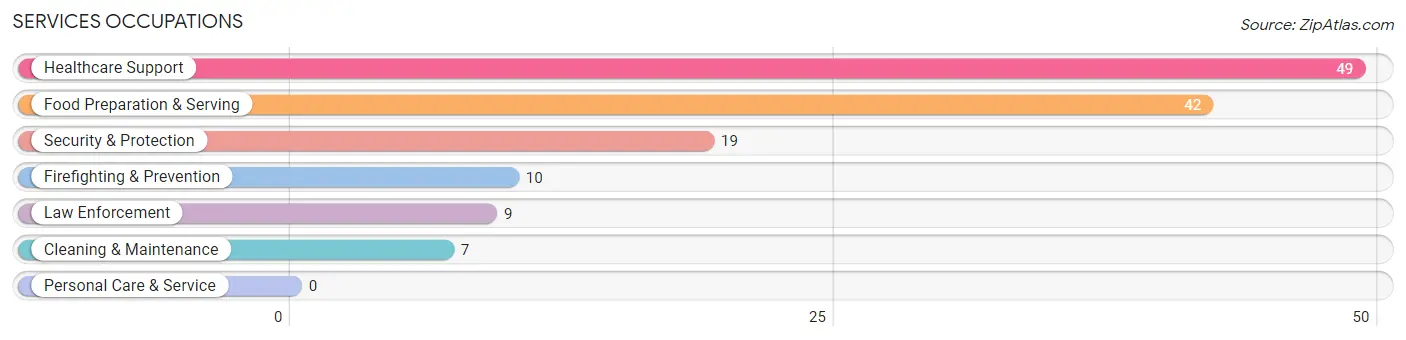
Services Occupations
The most common Services occupations in Republic are Healthcare Support (49 | 14.0%), Food Preparation & Serving (42 | 12.0%), Security & Protection (19 | 5.4%), Firefighting & Prevention (10 | 2.9%), and Law Enforcement (9 | 2.6%).
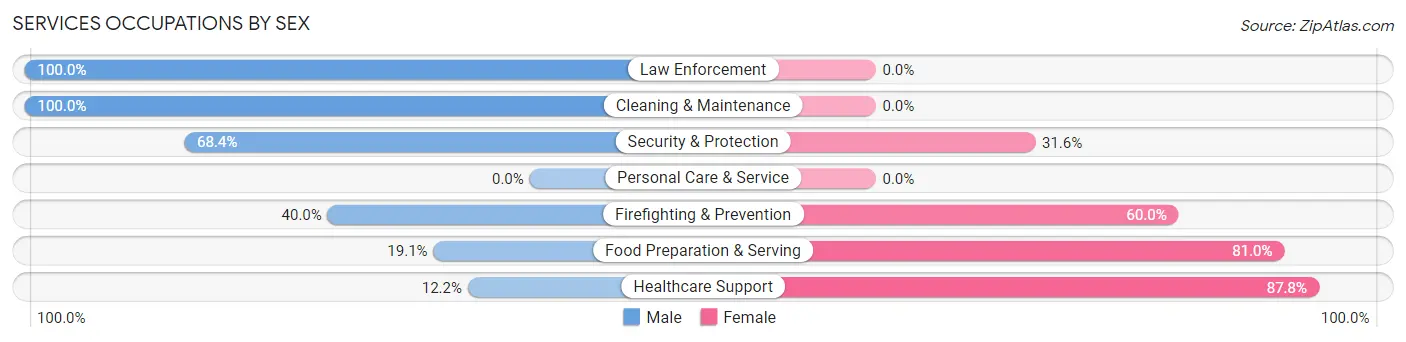
Services Occupations by Sex
Within the Services occupations in Republic, the most male-oriented occupations are Law Enforcement (100.0%), Cleaning & Maintenance (100.0%), and Security & Protection (68.4%), while the most female-oriented occupations are Healthcare Support (87.8%), Food Preparation & Serving (80.9%), and Firefighting & Prevention (60.0%).
| Occupation | Male | Female |
| Healthcare Support | 6 (12.2%) | 43 (87.8%) |
| Security & Protection | 13 (68.4%) | 6 (31.6%) |
| Firefighting & Prevention | 4 (40.0%) | 6 (60.0%) |
| Law Enforcement | 9 (100.0%) | 0 (0.0%) |
| Food Preparation & Serving | 8 (19.1%) | 34 (80.9%) |
| Cleaning & Maintenance | 7 (100.0%) | 0 (0.0%) |
| Personal Care & Service | 0 (0.0%) | 0 (0.0%) |
| Total (Category) | 34 (29.1%) | 83 (70.9%) |
| Total (Overall) | 186 (53.1%) | 164 (46.9%) |
Sales and Office Occupations
The most common Sales and Office occupations in Republic are Office & Administration (17 | 4.9%), and Sales & Related (7 | 2.0%).
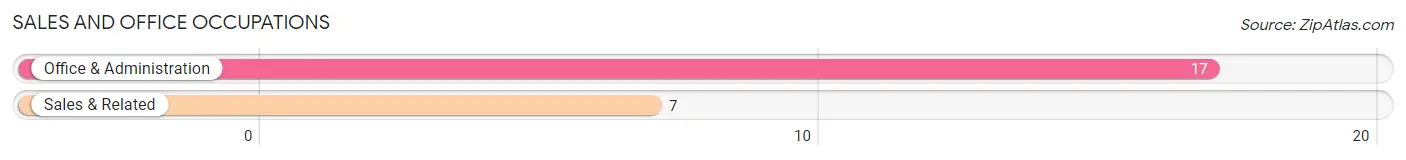
Sales and Office Occupations by Sex
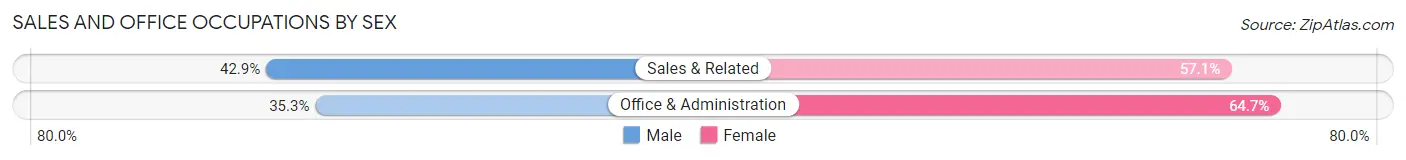
| Occupation | Male | Female |
| Sales & Related | 3 (42.9%) | 4 (57.1%) |
| Office & Administration | 6 (35.3%) | 11 (64.7%) |
| Total (Category) | 9 (37.5%) | 15 (62.5%) |
| Total (Overall) | 186 (53.1%) | 164 (46.9%) |
Natural Resources, Construction and Maintenance Occupations
The most common Natural Resources, Construction and Maintenance occupations in Republic are Construction & Extraction (62 | 17.7%), Farming, Fishing & Forestry (15 | 4.3%), and Installation, Maintenance & Repair (6 | 1.7%).
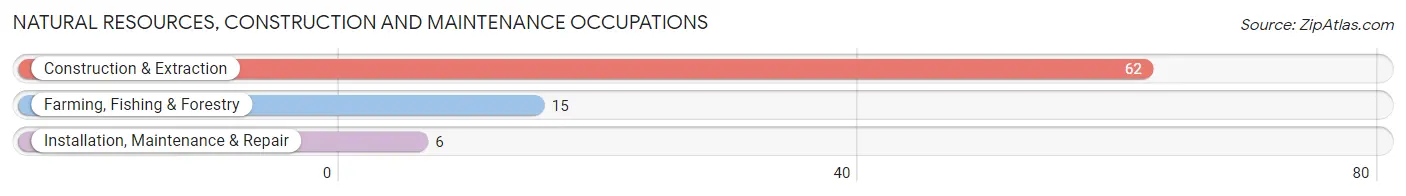
Natural Resources, Construction and Maintenance Occupations by Sex
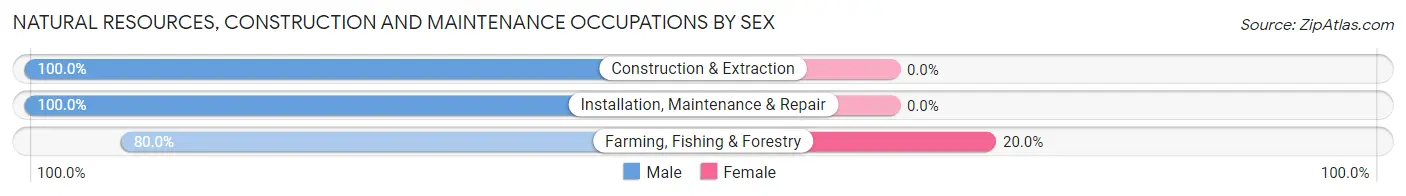
| Occupation | Male | Female |
| Farming, Fishing & Forestry | 12 (80.0%) | 3 (20.0%) |
| Construction & Extraction | 62 (100.0%) | 0 (0.0%) |
| Installation, Maintenance & Repair | 6 (100.0%) | 0 (0.0%) |
| Total (Category) | 80 (96.4%) | 3 (3.6%) |
| Total (Overall) | 186 (53.1%) | 164 (46.9%) |
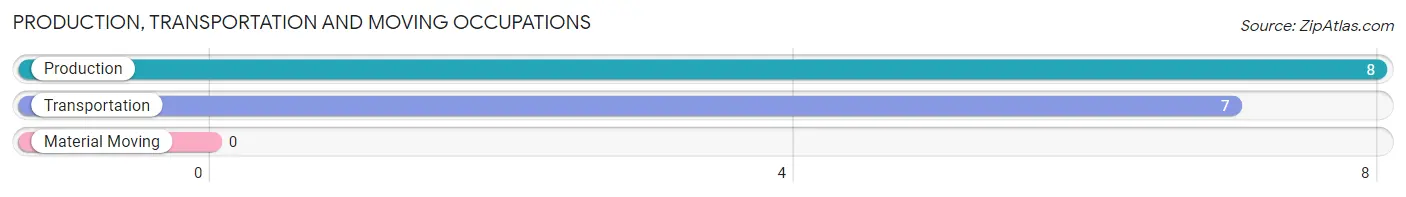
Production, Transportation and Moving Occupations
The most common Production, Transportation and Moving occupations in Republic are Production (8 | 2.3%), and Transportation (7 | 2.0%).
Production, Transportation and Moving Occupations by Sex
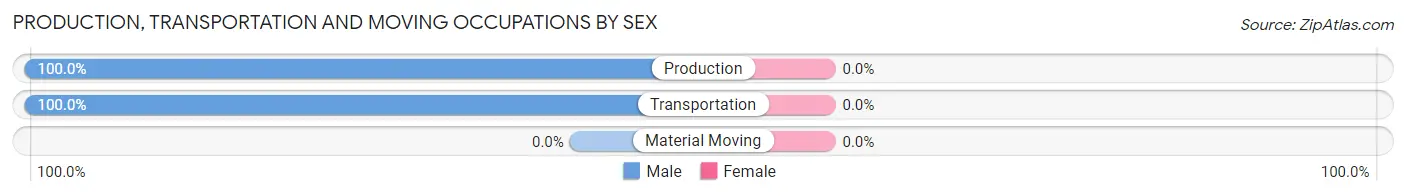
| Occupation | Male | Female |
| Production | 8 (100.0%) | 0 (0.0%) |
| Transportation | 7 (100.0%) | 0 (0.0%) |
| Material Moving | 0 (0.0%) | 0 (0.0%) |
| Total (Category) | 15 (100.0%) | 0 (0.0%) |
| Total (Overall) | 186 (53.1%) | 164 (46.9%) |
Employment Industries by Sex in Republic
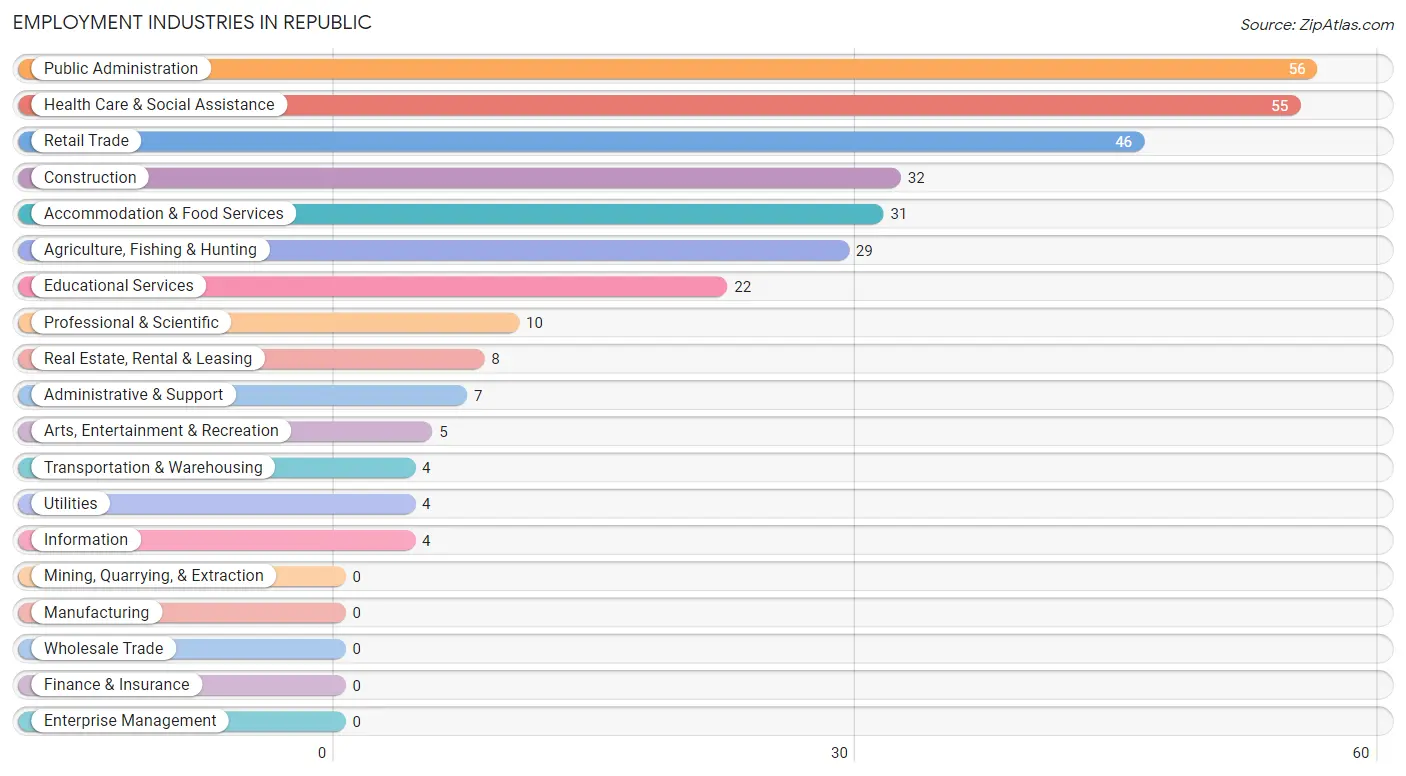
Employment Industries in Republic
The major employment industries in Republic include Public Administration (56 | 16.0%), Health Care & Social Assistance (55 | 15.7%), Retail Trade (46 | 13.1%), Construction (32 | 9.1%), and Accommodation & Food Services (31 | 8.9%).
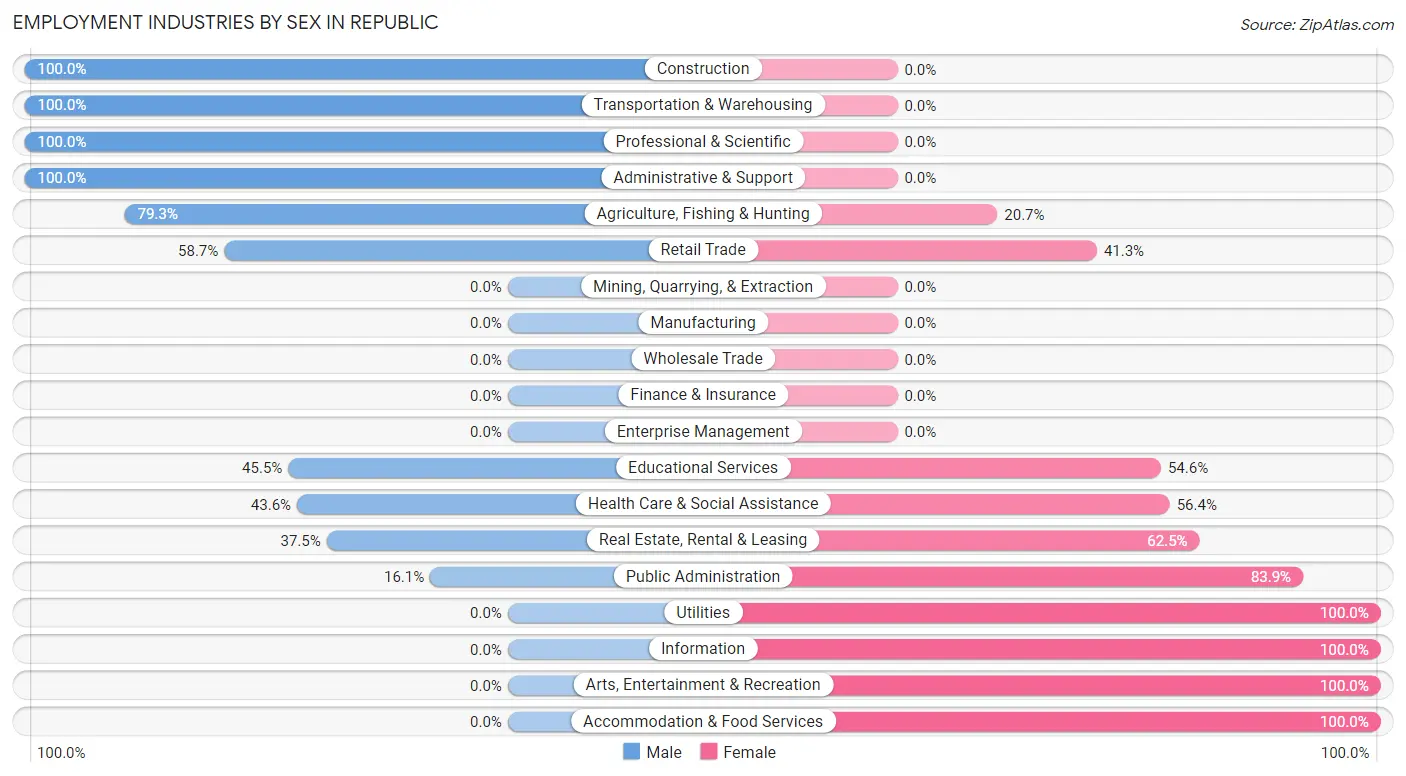
Employment Industries by Sex in Republic
The Republic industries that see more men than women are Construction (100.0%), Transportation & Warehousing (100.0%), and Professional & Scientific (100.0%), whereas the industries that tend to have a higher number of women are Utilities (100.0%), Information (100.0%), and Arts, Entertainment & Recreation (100.0%).
| Industry | Male | Female |
| Agriculture, Fishing & Hunting | 23 (79.3%) | 6 (20.7%) |
| Mining, Quarrying, & Extraction | 0 (0.0%) | 0 (0.0%) |
| Construction | 32 (100.0%) | 0 (0.0%) |
| Manufacturing | 0 (0.0%) | 0 (0.0%) |
| Wholesale Trade | 0 (0.0%) | 0 (0.0%) |
| Retail Trade | 27 (58.7%) | 19 (41.3%) |
| Transportation & Warehousing | 4 (100.0%) | 0 (0.0%) |
| Utilities | 0 (0.0%) | 4 (100.0%) |
| Information | 0 (0.0%) | 4 (100.0%) |
| Finance & Insurance | 0 (0.0%) | 0 (0.0%) |
| Real Estate, Rental & Leasing | 3 (37.5%) | 5 (62.5%) |
| Professional & Scientific | 10 (100.0%) | 0 (0.0%) |
| Enterprise Management | 0 (0.0%) | 0 (0.0%) |
| Administrative & Support | 7 (100.0%) | 0 (0.0%) |
| Educational Services | 10 (45.5%) | 12 (54.5%) |
| Health Care & Social Assistance | 24 (43.6%) | 31 (56.4%) |
| Arts, Entertainment & Recreation | 0 (0.0%) | 5 (100.0%) |
| Accommodation & Food Services | 0 (0.0%) | 31 (100.0%) |
| Public Administration | 9 (16.1%) | 47 (83.9%) |
| Total | 186 (53.1%) | 164 (46.9%) |
Education in Republic
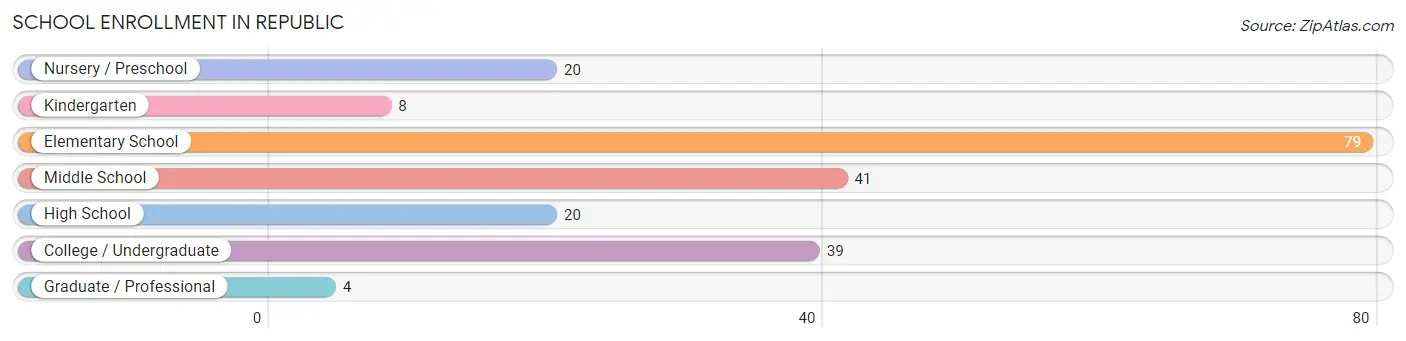
School Enrollment in Republic
The most common levels of schooling among the 211 students in Republic are elementary school (79 | 37.4%), middle school (41 | 19.4%), and college / undergraduate (39 | 18.5%).
| School Level | # Students | % Students |
| Nursery / Preschool | 20 | 9.5% |
| Kindergarten | 8 | 3.8% |
| Elementary School | 79 | 37.4% |
| Middle School | 41 | 19.4% |
| High School | 20 | 9.5% |
| College / Undergraduate | 39 | 18.5% |
| Graduate / Professional | 4 | 1.9% |
| Total | 211 | 100.0% |
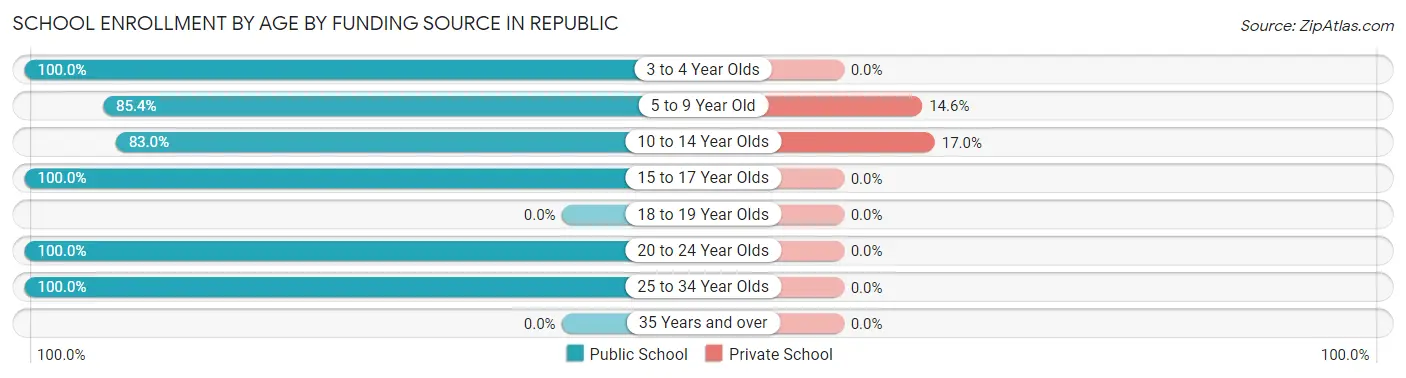
School Enrollment by Age by Funding Source in Republic
Out of a total of 211 students who are enrolled in schools in Republic, 21 (10.0%) attend a private institution, while the remaining 190 (90.0%) are enrolled in public schools. The age group of 10 to 14 year olds has the highest likelihood of being enrolled in private schools, with 9 (17.0% in the age bracket) enrolled. Conversely, the age group of 3 to 4 year olds has the lowest likelihood of being enrolled in a private school, with 20 (100.0% in the age bracket) attending a public institution.
| Age Bracket | Public School | Private School |
| 3 to 4 Year Olds | 20 (100.0%) | 0 (0.0%) |
| 5 to 9 Year Old | 70 (85.4%) | 12 (14.6%) |
| 10 to 14 Year Olds | 44 (83.0%) | 9 (17.0%) |
| 15 to 17 Year Olds | 13 (100.0%) | 0 (0.0%) |
| 18 to 19 Year Olds | 0 (0.0%) | 0 (0.0%) |
| 20 to 24 Year Olds | 39 (100.0%) | 0 (0.0%) |
| 25 to 34 Year Olds | 4 (100.0%) | 0 (0.0%) |
| 35 Years and over | 0 (0.0%) | 0 (0.0%) |
| Total | 190 (90.0%) | 21 (10.0%) |
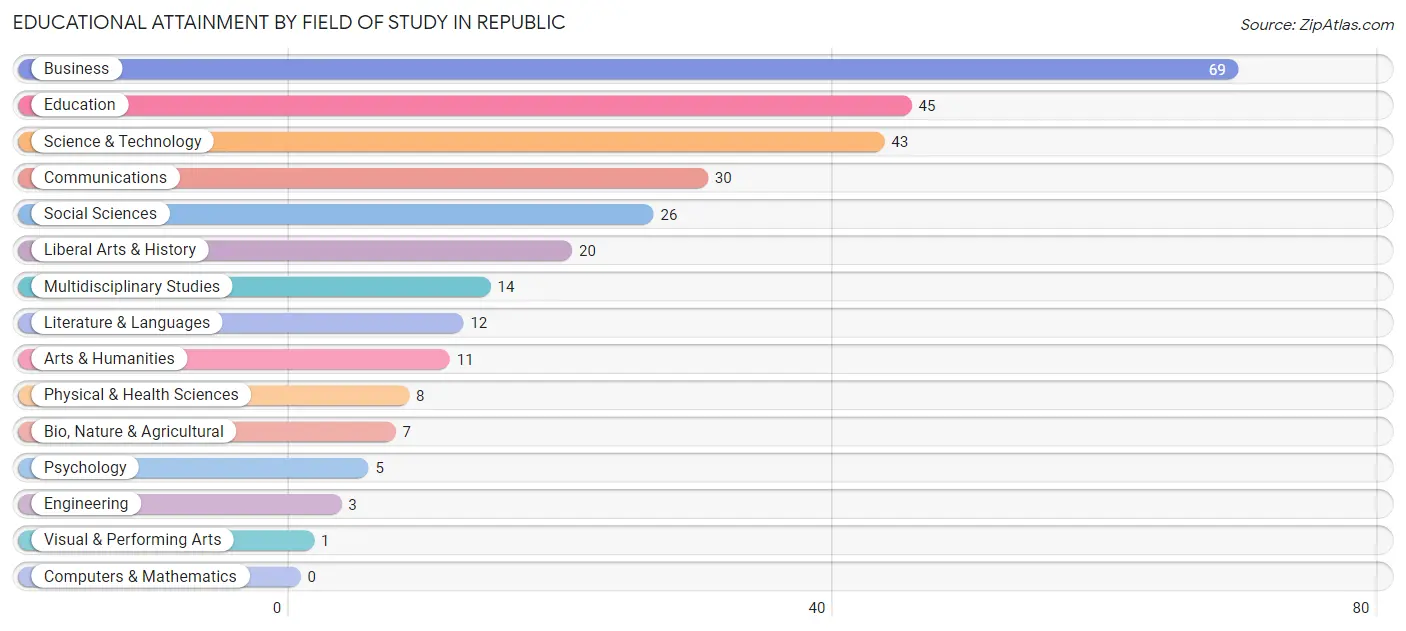
Educational Attainment by Field of Study in Republic
Business (69 | 23.5%), education (45 | 15.3%), science & technology (43 | 14.6%), communications (30 | 10.2%), and social sciences (26 | 8.8%) are the most common fields of study among 294 individuals in Republic who have obtained a bachelor's degree or higher.
| Field of Study | # Graduates | % Graduates |
| Computers & Mathematics | 0 | 0.0% |
| Bio, Nature & Agricultural | 7 | 2.4% |
| Physical & Health Sciences | 8 | 2.7% |
| Psychology | 5 | 1.7% |
| Social Sciences | 26 | 8.8% |
| Engineering | 3 | 1.0% |
| Multidisciplinary Studies | 14 | 4.8% |
| Science & Technology | 43 | 14.6% |
| Business | 69 | 23.5% |
| Education | 45 | 15.3% |
| Literature & Languages | 12 | 4.1% |
| Liberal Arts & History | 20 | 6.8% |
| Visual & Performing Arts | 1 | 0.3% |
| Communications | 30 | 10.2% |
| Arts & Humanities | 11 | 3.7% |
| Total | 294 | 100.0% |
Transportation & Commute in Republic
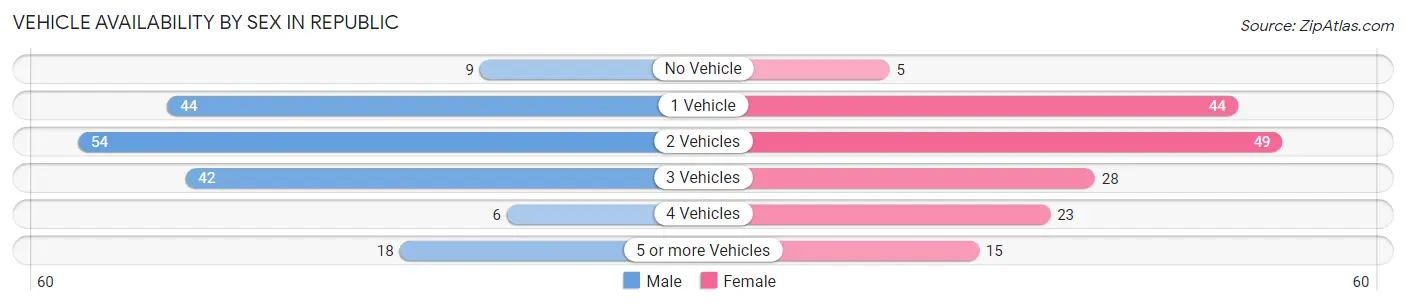
Vehicle Availability by Sex in Republic
The most prevalent vehicle ownership categories in Republic are males with 2 vehicles (54, accounting for 31.2%) and females with 2 vehicles (49, making up 32.9%).
| Vehicles Available | Male | Female |
| No Vehicle | 9 (5.2%) | 5 (3.0%) |
| 1 Vehicle | 44 (25.4%) | 44 (26.8%) |
| 2 Vehicles | 54 (31.2%) | 49 (29.9%) |
| 3 Vehicles | 42 (24.3%) | 28 (17.1%) |
| 4 Vehicles | 6 (3.5%) | 23 (14.0%) |
| 5 or more Vehicles | 18 (10.4%) | 15 (9.1%) |
| Total | 173 (100.0%) | 164 (100.0%) |
Commute Time in Republic
The most frequently occuring commute durations in Republic are less than 5 minutes (102 commuters, 37.5%), 5 to 9 minutes (76 commuters, 27.9%), and 10 to 14 minutes (38 commuters, 14.0%).
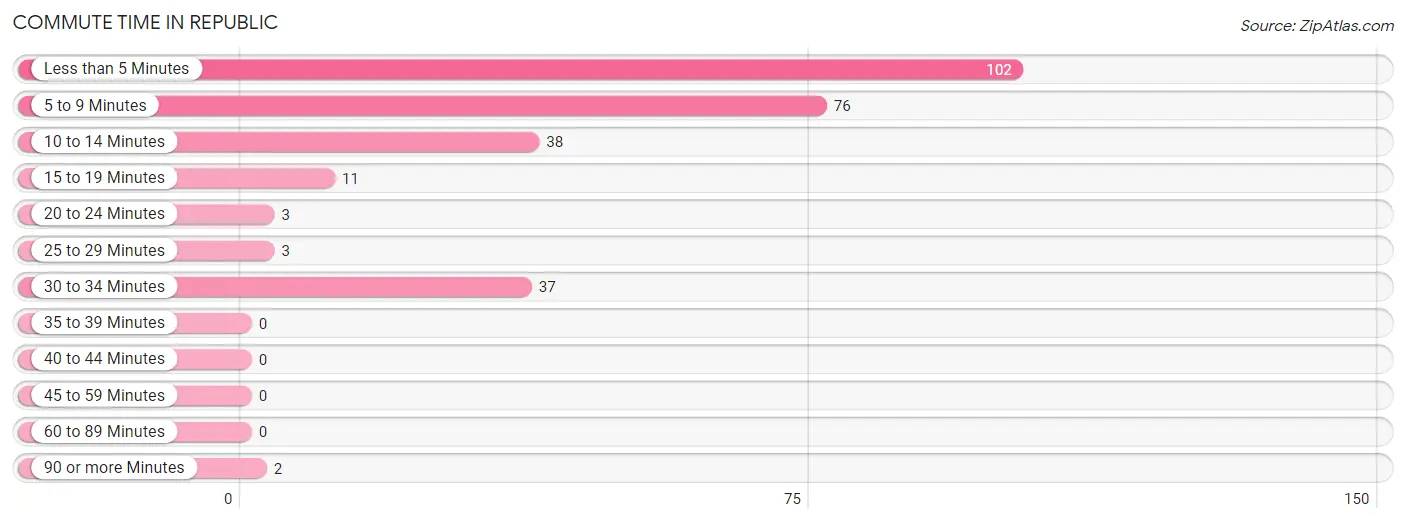
| Commute Time | # Commuters | % Commuters |
| Less than 5 Minutes | 102 | 37.5% |
| 5 to 9 Minutes | 76 | 27.9% |
| 10 to 14 Minutes | 38 | 14.0% |
| 15 to 19 Minutes | 11 | 4.0% |
| 20 to 24 Minutes | 3 | 1.1% |
| 25 to 29 Minutes | 3 | 1.1% |
| 30 to 34 Minutes | 37 | 13.6% |
| 35 to 39 Minutes | 0 | 0.0% |
| 40 to 44 Minutes | 0 | 0.0% |
| 45 to 59 Minutes | 0 | 0.0% |
| 60 to 89 Minutes | 0 | 0.0% |
| 90 or more Minutes | 2 | 0.7% |
Commute Time by Sex in Republic
The most common commute times in Republic are less than 5 minutes (58 commuters, 39.7%) for males and less than 5 minutes (44 commuters, 34.9%) for females.
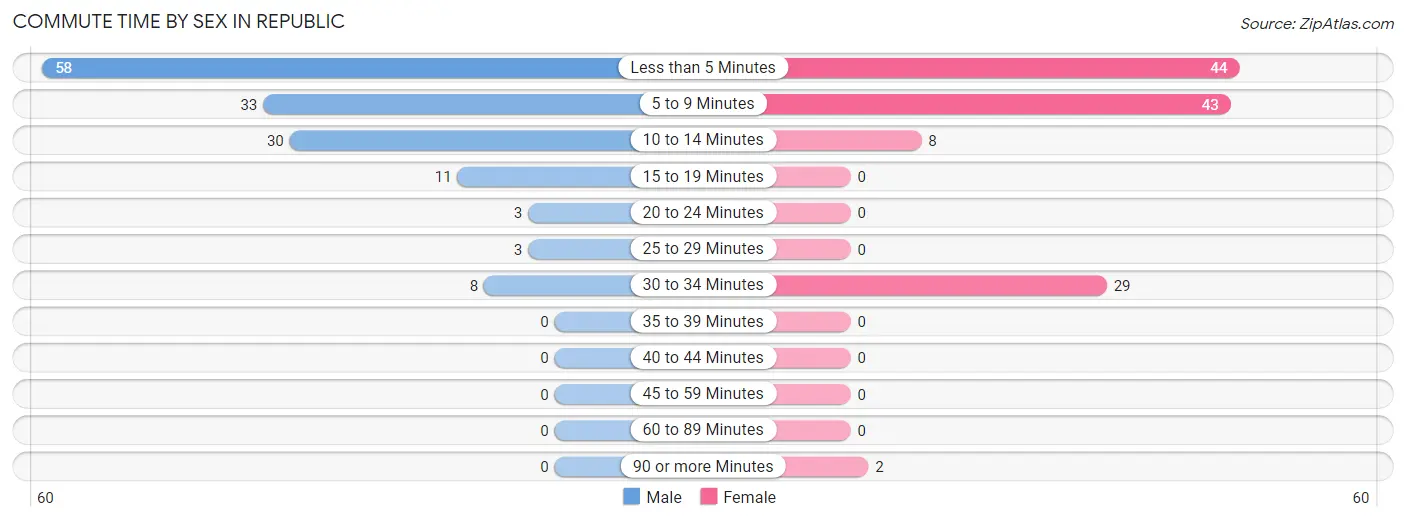
| Commute Time | Male | Female |
| Less than 5 Minutes | 58 (39.7%) | 44 (34.9%) |
| 5 to 9 Minutes | 33 (22.6%) | 43 (34.1%) |
| 10 to 14 Minutes | 30 (20.5%) | 8 (6.4%) |
| 15 to 19 Minutes | 11 (7.5%) | 0 (0.0%) |
| 20 to 24 Minutes | 3 (2.1%) | 0 (0.0%) |
| 25 to 29 Minutes | 3 (2.1%) | 0 (0.0%) |
| 30 to 34 Minutes | 8 (5.5%) | 29 (23.0%) |
| 35 to 39 Minutes | 0 (0.0%) | 0 (0.0%) |
| 40 to 44 Minutes | 0 (0.0%) | 0 (0.0%) |
| 45 to 59 Minutes | 0 (0.0%) | 0 (0.0%) |
| 60 to 89 Minutes | 0 (0.0%) | 0 (0.0%) |
| 90 or more Minutes | 0 (0.0%) | 2 (1.6%) |
Time of Departure to Work by Sex in Republic
The most frequent times of departure to work in Republic are 7:30 AM to 7:59 AM (26, 17.8%) for males and 6:30 AM to 6:59 AM (24, 19.1%) for females.
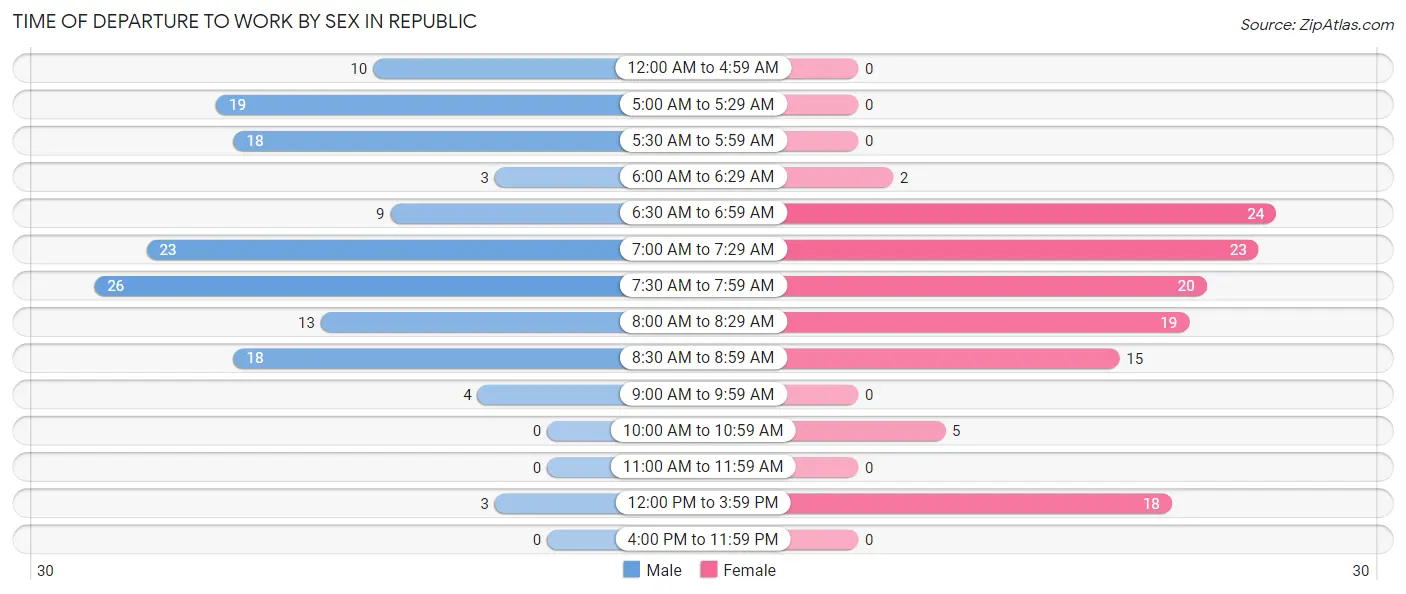
| Time of Departure | Male | Female |
| 12:00 AM to 4:59 AM | 10 (6.9%) | 0 (0.0%) |
| 5:00 AM to 5:29 AM | 19 (13.0%) | 0 (0.0%) |
| 5:30 AM to 5:59 AM | 18 (12.3%) | 0 (0.0%) |
| 6:00 AM to 6:29 AM | 3 (2.1%) | 2 (1.6%) |
| 6:30 AM to 6:59 AM | 9 (6.2%) | 24 (19.1%) |
| 7:00 AM to 7:29 AM | 23 (15.8%) | 23 (18.2%) |
| 7:30 AM to 7:59 AM | 26 (17.8%) | 20 (15.9%) |
| 8:00 AM to 8:29 AM | 13 (8.9%) | 19 (15.1%) |
| 8:30 AM to 8:59 AM | 18 (12.3%) | 15 (11.9%) |
| 9:00 AM to 9:59 AM | 4 (2.7%) | 0 (0.0%) |
| 10:00 AM to 10:59 AM | 0 (0.0%) | 5 (4.0%) |
| 11:00 AM to 11:59 AM | 0 (0.0%) | 0 (0.0%) |
| 12:00 PM to 3:59 PM | 3 (2.1%) | 18 (14.3%) |
| 4:00 PM to 11:59 PM | 0 (0.0%) | 0 (0.0%) |
| Total | 146 (100.0%) | 126 (100.0%) |
Housing Occupancy in Republic
Occupancy by Ownership in Republic
Of the total 478 dwellings in Republic, owner-occupied units account for 238 (49.8%), while renter-occupied units make up 240 (50.2%).
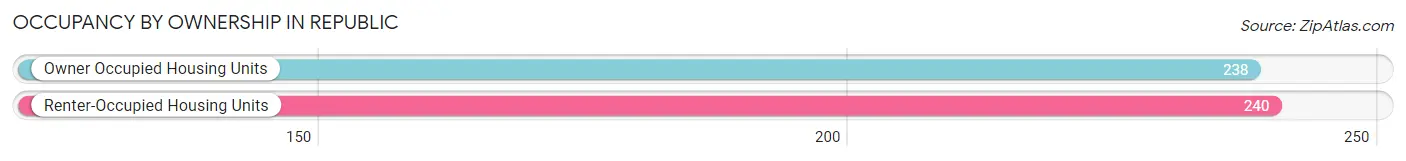
| Occupancy | # Housing Units | % Housing Units |
| Owner Occupied Housing Units | 238 | 49.8% |
| Renter-Occupied Housing Units | 240 | 50.2% |
| Total Occupied Housing Units | 478 | 100.0% |
Occupancy by Household Size in Republic
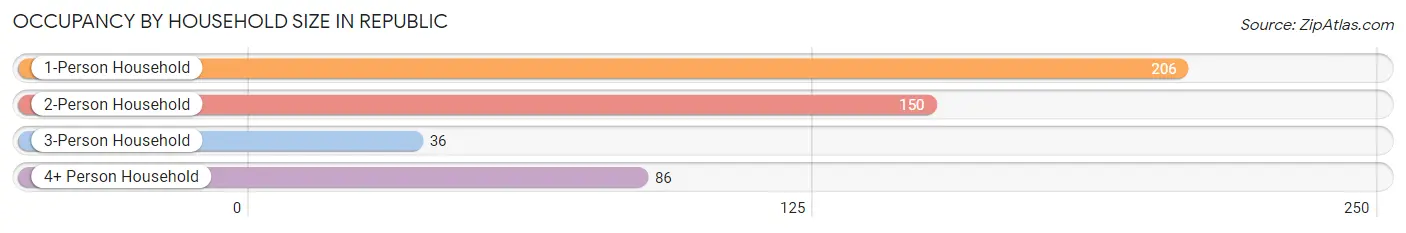
| Household Size | # Housing Units | % Housing Units |
| 1-Person Household | 206 | 43.1% |
| 2-Person Household | 150 | 31.4% |
| 3-Person Household | 36 | 7.5% |
| 4+ Person Household | 86 | 18.0% |
| Total Housing Units | 478 | 100.0% |
Occupancy by Ownership by Household Size in Republic
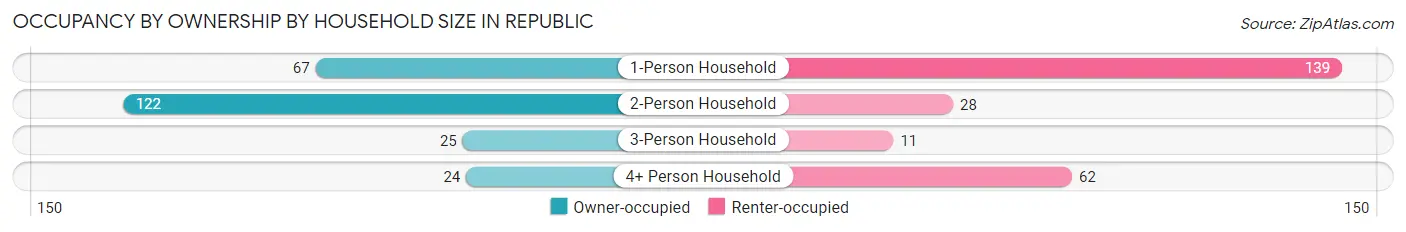
| Household Size | Owner-occupied | Renter-occupied |
| 1-Person Household | 67 (32.5%) | 139 (67.5%) |
| 2-Person Household | 122 (81.3%) | 28 (18.7%) |
| 3-Person Household | 25 (69.4%) | 11 (30.6%) |
| 4+ Person Household | 24 (27.9%) | 62 (72.1%) |
| Total Housing Units | 238 (49.8%) | 240 (50.2%) |
Occupancy by Educational Attainment in Republic
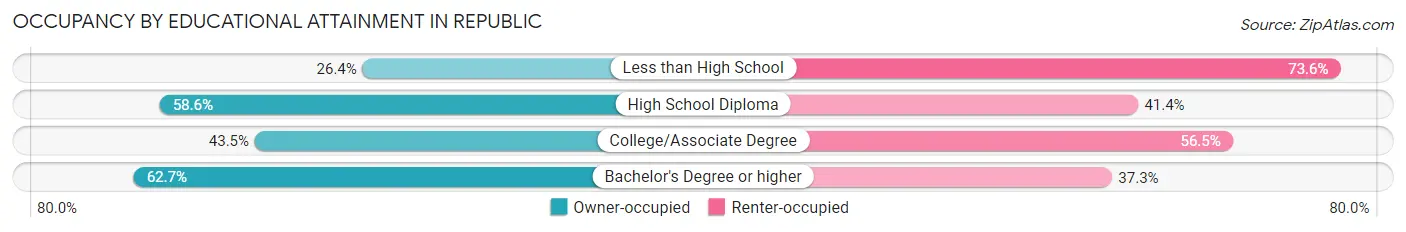
| Household Size | Owner-occupied | Renter-occupied |
| Less than High School | 19 (26.4%) | 53 (73.6%) |
| High School Diploma | 65 (58.6%) | 46 (41.4%) |
| College/Associate Degree | 70 (43.5%) | 91 (56.5%) |
| Bachelor's Degree or higher | 84 (62.7%) | 50 (37.3%) |
Occupancy by Age of Householder in Republic
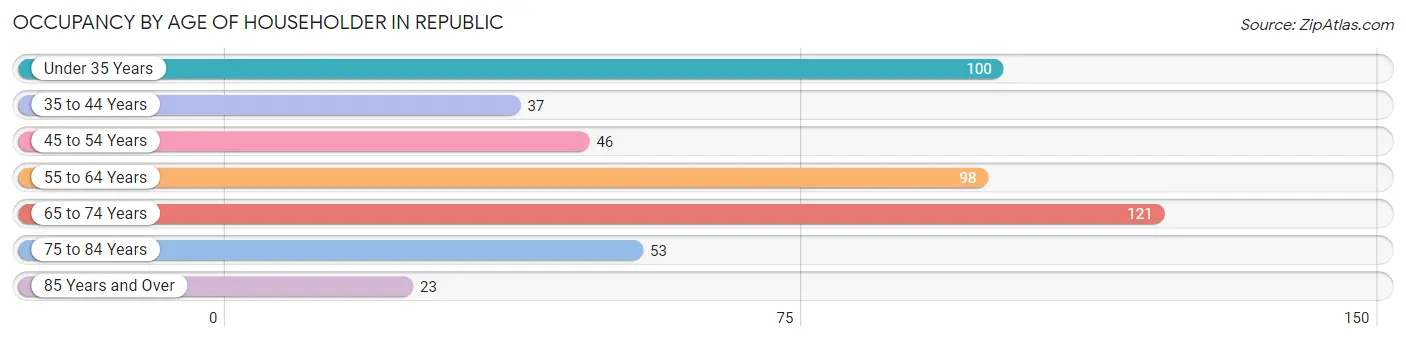
| Age Bracket | # Households | % Households |
| Under 35 Years | 100 | 20.9% |
| 35 to 44 Years | 37 | 7.7% |
| 45 to 54 Years | 46 | 9.6% |
| 55 to 64 Years | 98 | 20.5% |
| 65 to 74 Years | 121 | 25.3% |
| 75 to 84 Years | 53 | 11.1% |
| 85 Years and Over | 23 | 4.8% |
| Total | 478 | 100.0% |
Housing Finances in Republic
Median Income by Occupancy in Republic
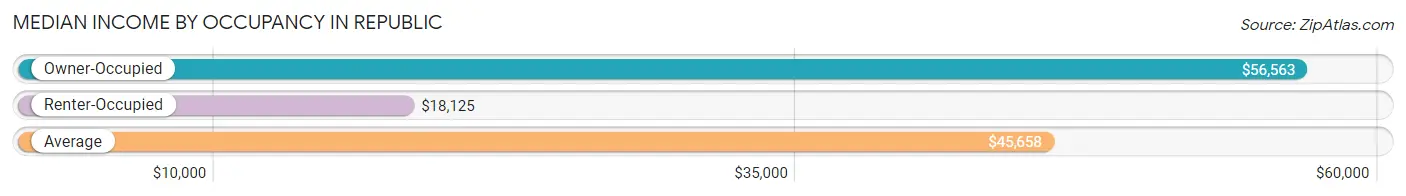
| Occupancy Type | # Households | Median Income |
| Owner-Occupied | 238 (49.8%) | $56,563 |
| Renter-Occupied | 240 (50.2%) | $18,125 |
| Average | 478 (100.0%) | $45,658 |
Occupancy by Householder Income Bracket in Republic
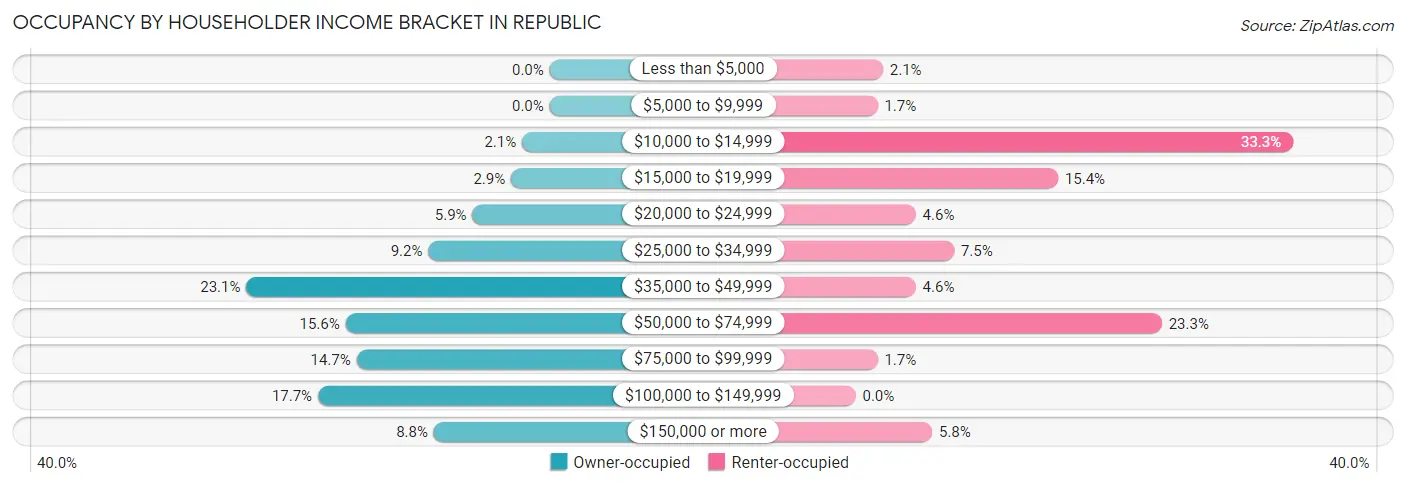
| Income Bracket | Owner-occupied | Renter-occupied |
| Less than $5,000 | 0 (0.0%) | 5 (2.1%) |
| $5,000 to $9,999 | 0 (0.0%) | 4 (1.7%) |
| $10,000 to $14,999 | 5 (2.1%) | 80 (33.3%) |
| $15,000 to $19,999 | 7 (2.9%) | 37 (15.4%) |
| $20,000 to $24,999 | 14 (5.9%) | 11 (4.6%) |
| $25,000 to $34,999 | 22 (9.2%) | 18 (7.5%) |
| $35,000 to $49,999 | 55 (23.1%) | 11 (4.6%) |
| $50,000 to $74,999 | 37 (15.5%) | 56 (23.3%) |
| $75,000 to $99,999 | 35 (14.7%) | 4 (1.7%) |
| $100,000 to $149,999 | 42 (17.6%) | 0 (0.0%) |
| $150,000 or more | 21 (8.8%) | 14 (5.8%) |
| Total | 238 (100.0%) | 240 (100.0%) |
Monthly Housing Cost Tiers in Republic
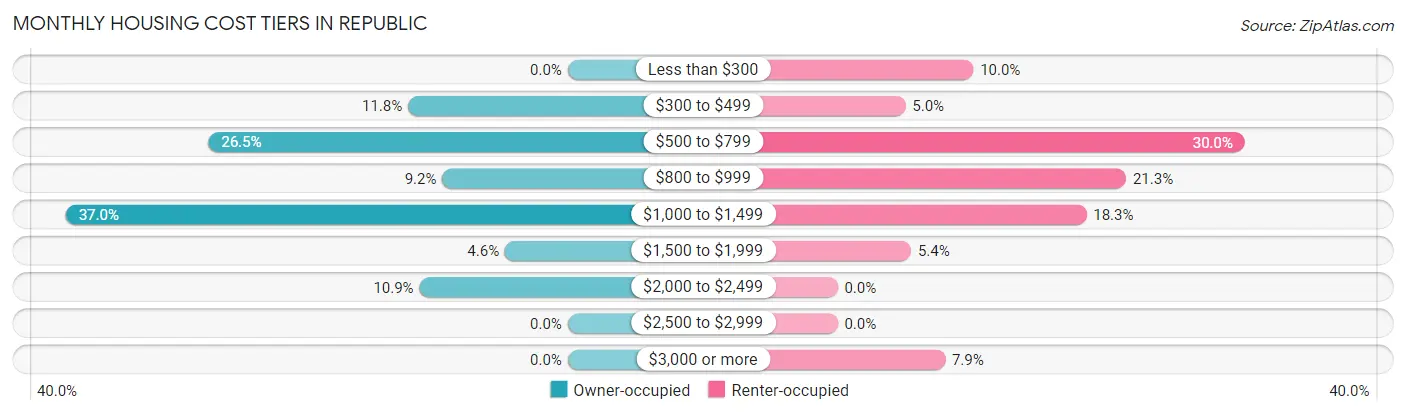
| Monthly Cost | Owner-occupied | Renter-occupied |
| Less than $300 | 0 (0.0%) | 24 (10.0%) |
| $300 to $499 | 28 (11.8%) | 12 (5.0%) |
| $500 to $799 | 63 (26.5%) | 72 (30.0%) |
| $800 to $999 | 22 (9.2%) | 51 (21.2%) |
| $1,000 to $1,499 | 88 (37.0%) | 44 (18.3%) |
| $1,500 to $1,999 | 11 (4.6%) | 13 (5.4%) |
| $2,000 to $2,499 | 26 (10.9%) | 0 (0.0%) |
| $2,500 to $2,999 | 0 (0.0%) | 0 (0.0%) |
| $3,000 or more | 0 (0.0%) | 19 (7.9%) |
| Total | 238 (100.0%) | 240 (100.0%) |
Physical Housing Characteristics in Republic
Housing Structures in Republic
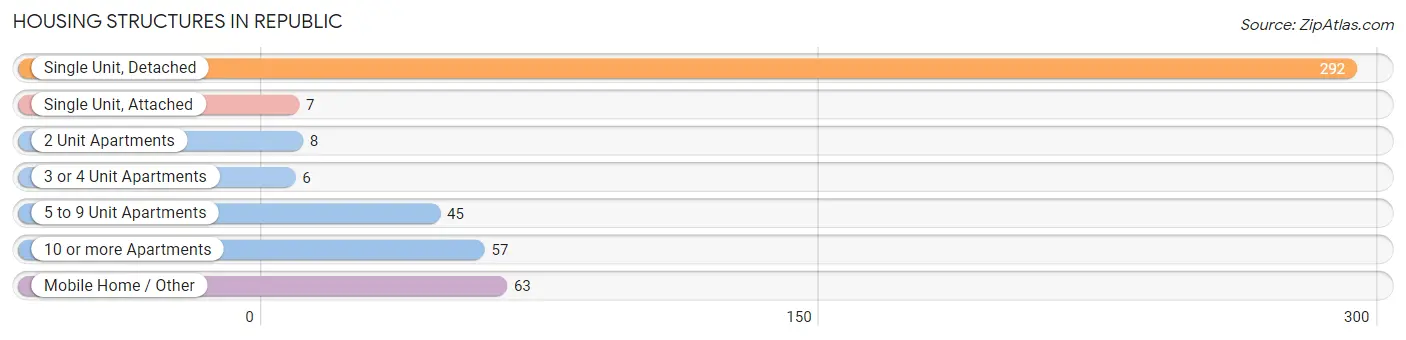
| Structure Type | # Housing Units | % Housing Units |
| Single Unit, Detached | 292 | 61.1% |
| Single Unit, Attached | 7 | 1.5% |
| 2 Unit Apartments | 8 | 1.7% |
| 3 or 4 Unit Apartments | 6 | 1.3% |
| 5 to 9 Unit Apartments | 45 | 9.4% |
| 10 or more Apartments | 57 | 11.9% |
| Mobile Home / Other | 63 | 13.2% |
| Total | 478 | 100.0% |
Housing Structures by Occupancy in Republic
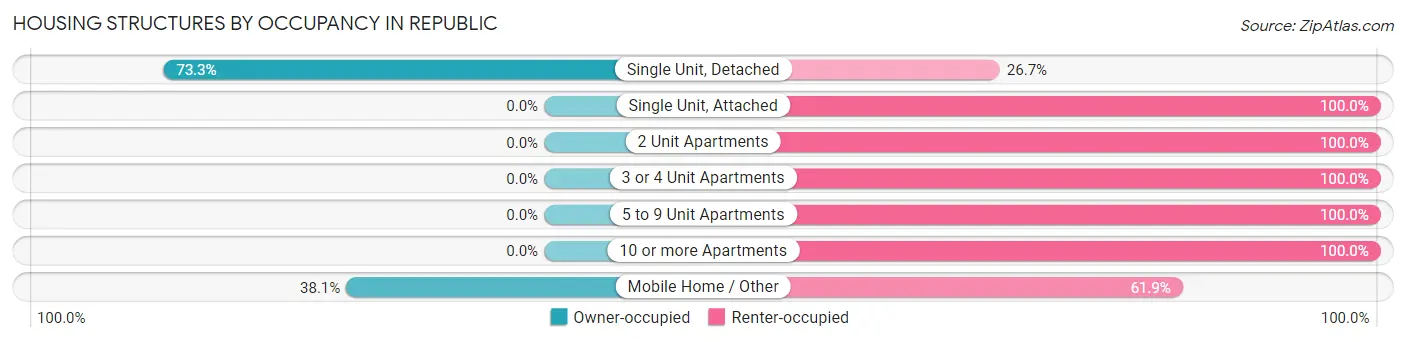
| Structure Type | Owner-occupied | Renter-occupied |
| Single Unit, Detached | 214 (73.3%) | 78 (26.7%) |
| Single Unit, Attached | 0 (0.0%) | 7 (100.0%) |
| 2 Unit Apartments | 0 (0.0%) | 8 (100.0%) |
| 3 or 4 Unit Apartments | 0 (0.0%) | 6 (100.0%) |
| 5 to 9 Unit Apartments | 0 (0.0%) | 45 (100.0%) |
| 10 or more Apartments | 0 (0.0%) | 57 (100.0%) |
| Mobile Home / Other | 24 (38.1%) | 39 (61.9%) |
| Total | 238 (49.8%) | 240 (50.2%) |
Housing Structures by Number of Rooms in Republic
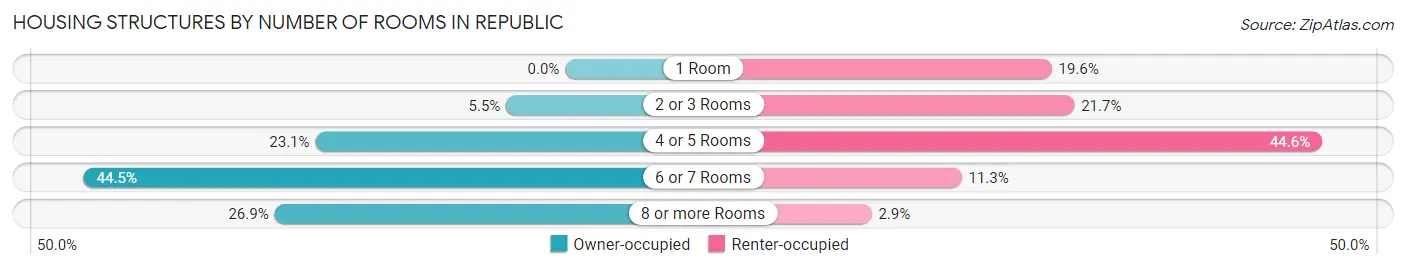
| Number of Rooms | Owner-occupied | Renter-occupied |
| 1 Room | 0 (0.0%) | 47 (19.6%) |
| 2 or 3 Rooms | 13 (5.5%) | 52 (21.7%) |
| 4 or 5 Rooms | 55 (23.1%) | 107 (44.6%) |
| 6 or 7 Rooms | 106 (44.5%) | 27 (11.3%) |
| 8 or more Rooms | 64 (26.9%) | 7 (2.9%) |
| Total | 238 (100.0%) | 240 (100.0%) |
Housing Structure by Heating Type in Republic
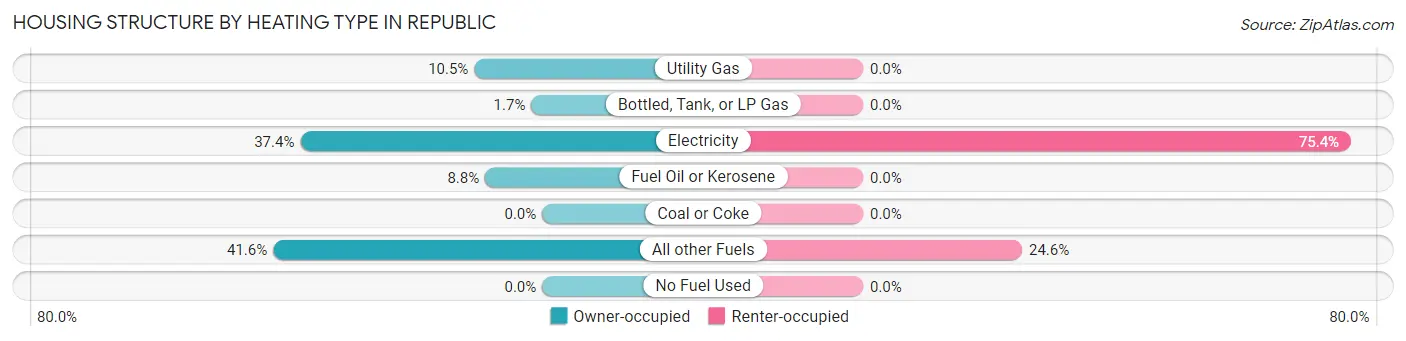
| Heating Type | Owner-occupied | Renter-occupied |
| Utility Gas | 25 (10.5%) | 0 (0.0%) |
| Bottled, Tank, or LP Gas | 4 (1.7%) | 0 (0.0%) |
| Electricity | 89 (37.4%) | 181 (75.4%) |
| Fuel Oil or Kerosene | 21 (8.8%) | 0 (0.0%) |
| Coal or Coke | 0 (0.0%) | 0 (0.0%) |
| All other Fuels | 99 (41.6%) | 59 (24.6%) |
| No Fuel Used | 0 (0.0%) | 0 (0.0%) |
| Total | 238 (100.0%) | 240 (100.0%) |
Household Vehicle Usage in Republic
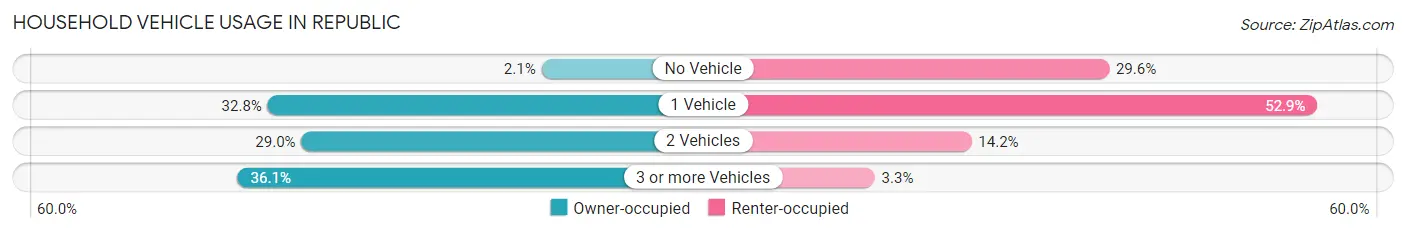
| Vehicles per Household | Owner-occupied | Renter-occupied |
| No Vehicle | 5 (2.1%) | 71 (29.6%) |
| 1 Vehicle | 78 (32.8%) | 127 (52.9%) |
| 2 Vehicles | 69 (29.0%) | 34 (14.2%) |
| 3 or more Vehicles | 86 (36.1%) | 8 (3.3%) |
| Total | 238 (100.0%) | 240 (100.0%) |
Real Estate & Mortgages in Republic
Real Estate and Mortgage Overview in Republic
| Characteristic | Without Mortgage | With Mortgage |
| Housing Units | 107 | 131 |
| Median Property Value | $184,200 | $174,200 |
| Median Household Income | $67,188 | $6 |
| Monthly Housing Costs | $668 | $0 |
| Real Estate Taxes | $1,229 | $3 |
Property Value by Mortgage Status in Republic
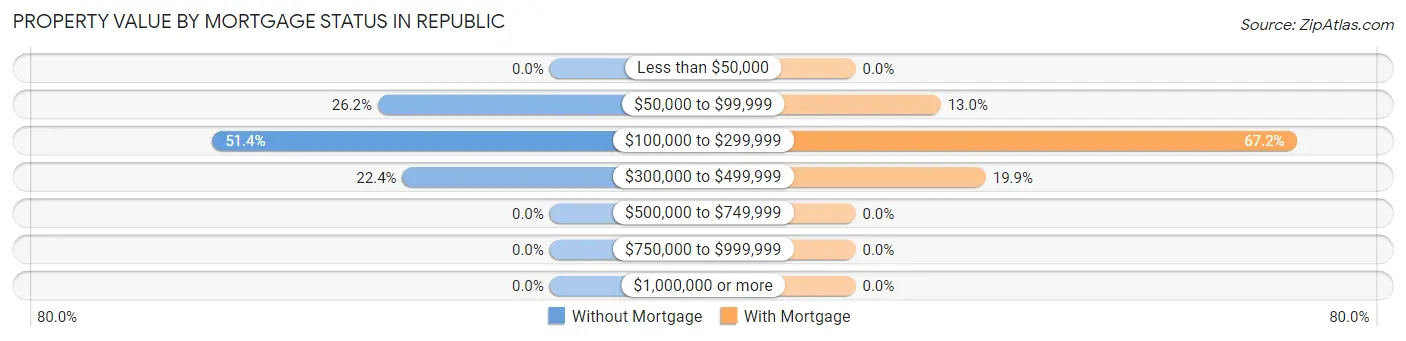
| Property Value | Without Mortgage | With Mortgage |
| Less than $50,000 | 0 (0.0%) | 0 (0.0%) |
| $50,000 to $99,999 | 28 (26.2%) | 17 (13.0%) |
| $100,000 to $299,999 | 55 (51.4%) | 88 (67.2%) |
| $300,000 to $499,999 | 24 (22.4%) | 26 (19.9%) |
| $500,000 to $749,999 | 0 (0.0%) | 0 (0.0%) |
| $750,000 to $999,999 | 0 (0.0%) | 0 (0.0%) |
| $1,000,000 or more | 0 (0.0%) | 0 (0.0%) |
| Total | 107 (100.0%) | 131 (100.0%) |
Household Income by Mortgage Status in Republic
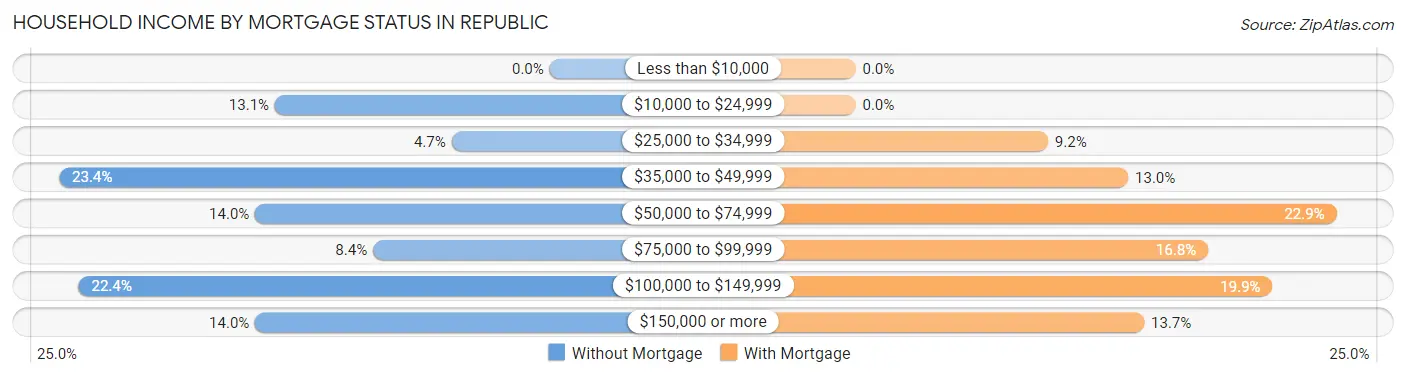
| Household Income | Without Mortgage | With Mortgage |
| Less than $10,000 | 0 (0.0%) | 0 (0.0%) |
| $10,000 to $24,999 | 14 (13.1%) | 0 (0.0%) |
| $25,000 to $34,999 | 5 (4.7%) | 12 (9.2%) |
| $35,000 to $49,999 | 25 (23.4%) | 17 (13.0%) |
| $50,000 to $74,999 | 15 (14.0%) | 30 (22.9%) |
| $75,000 to $99,999 | 9 (8.4%) | 22 (16.8%) |
| $100,000 to $149,999 | 24 (22.4%) | 26 (19.9%) |
| $150,000 or more | 15 (14.0%) | 18 (13.7%) |
| Total | 107 (100.0%) | 131 (100.0%) |
Property Value to Household Income Ratio in Republic
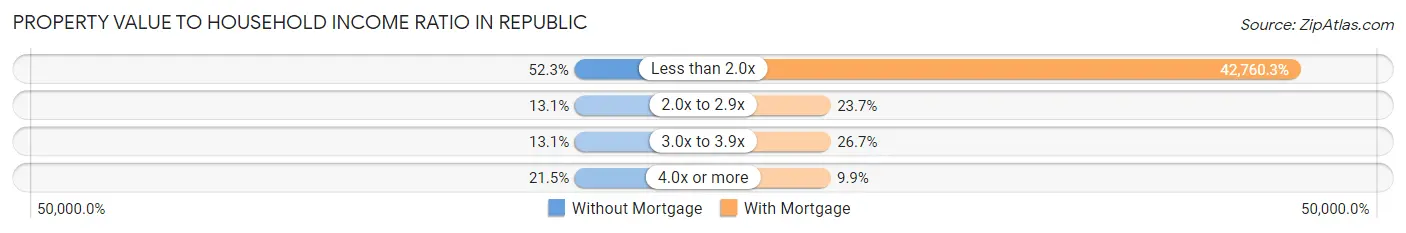
| Value-to-Income Ratio | Without Mortgage | With Mortgage |
| Less than 2.0x | 56 (52.3%) | 56,016 (42,760.3%) |
| 2.0x to 2.9x | 14 (13.1%) | 31 (23.7%) |
| 3.0x to 3.9x | 14 (13.1%) | 35 (26.7%) |
| 4.0x or more | 23 (21.5%) | 13 (9.9%) |
| Total | 107 (100.0%) | 131 (100.0%) |
Real Estate Taxes by Mortgage Status in Republic
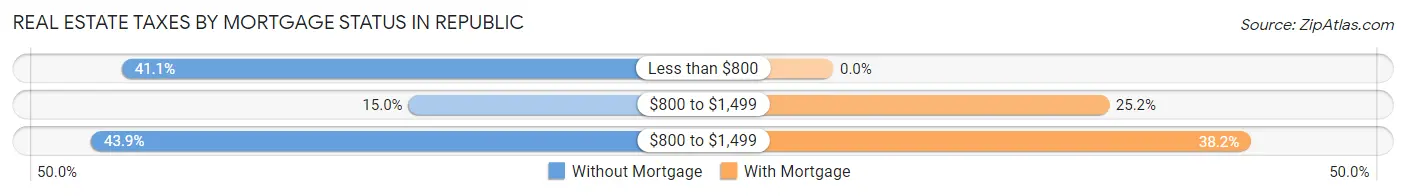
| Property Taxes | Without Mortgage | With Mortgage |
| Less than $800 | 44 (41.1%) | 0 (0.0%) |
| $800 to $1,499 | 16 (14.9%) | 33 (25.2%) |
| $800 to $1,499 | 47 (43.9%) | 50 (38.2%) |
| Total | 107 (100.0%) | 131 (100.0%) |
Health & Disability in Republic
Health Insurance Coverage by Age in Republic
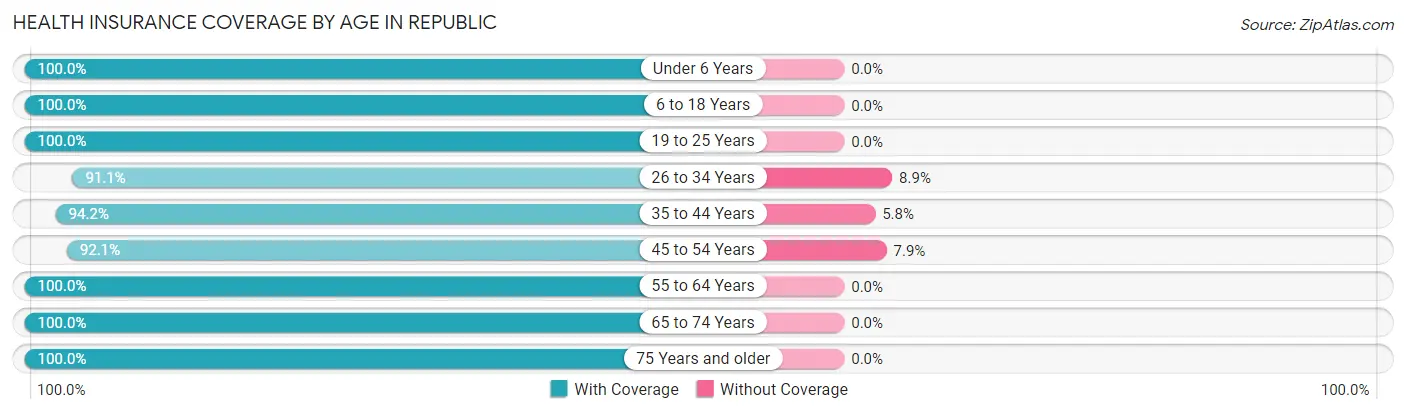
| Age Bracket | With Coverage | Without Coverage |
| Under 6 Years | 90 (100.0%) | 0 (0.0%) |
| 6 to 18 Years | 142 (100.0%) | 0 (0.0%) |
| 19 to 25 Years | 71 (100.0%) | 0 (0.0%) |
| 26 to 34 Years | 102 (91.1%) | 10 (8.9%) |
| 35 to 44 Years | 98 (94.2%) | 6 (5.8%) |
| 45 to 54 Years | 70 (92.1%) | 6 (7.9%) |
| 55 to 64 Years | 154 (100.0%) | 0 (0.0%) |
| 65 to 74 Years | 176 (100.0%) | 0 (0.0%) |
| 75 Years and older | 130 (100.0%) | 0 (0.0%) |
| Total | 1,033 (97.9%) | 22 (2.1%) |
Health Insurance Coverage by Citizenship Status in Republic
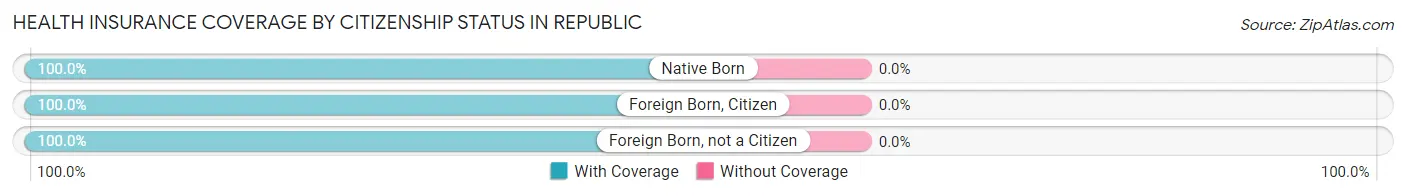
| Citizenship Status | With Coverage | Without Coverage |
| Native Born | 90 (100.0%) | 0 (0.0%) |
| Foreign Born, Citizen | 142 (100.0%) | 0 (0.0%) |
| Foreign Born, not a Citizen | 71 (100.0%) | 0 (0.0%) |
Health Insurance Coverage by Household Income in Republic
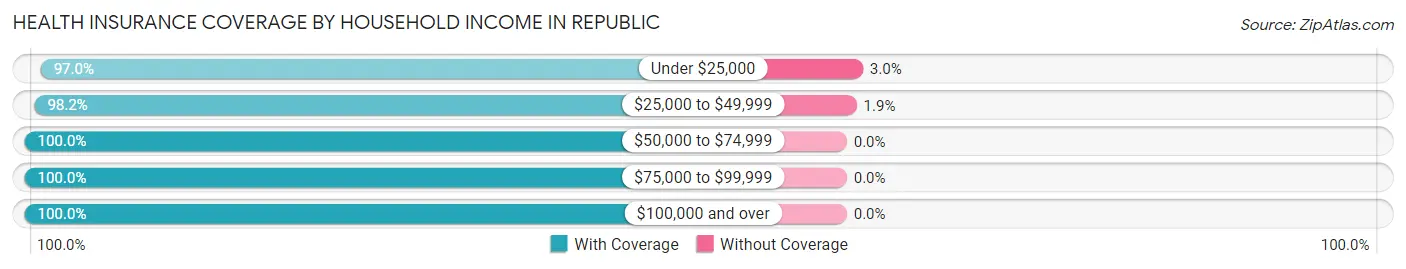
| Household Income | With Coverage | Without Coverage |
| Under $25,000 | 193 (97.0%) | 6 (3.0%) |
| $25,000 to $49,999 | 319 (98.2%) | 6 (1.8%) |
| $50,000 to $74,999 | 223 (100.0%) | 0 (0.0%) |
| $75,000 to $99,999 | 95 (100.0%) | 0 (0.0%) |
| $100,000 and over | 185 (100.0%) | 0 (0.0%) |
Public vs Private Health Insurance Coverage by Age in Republic
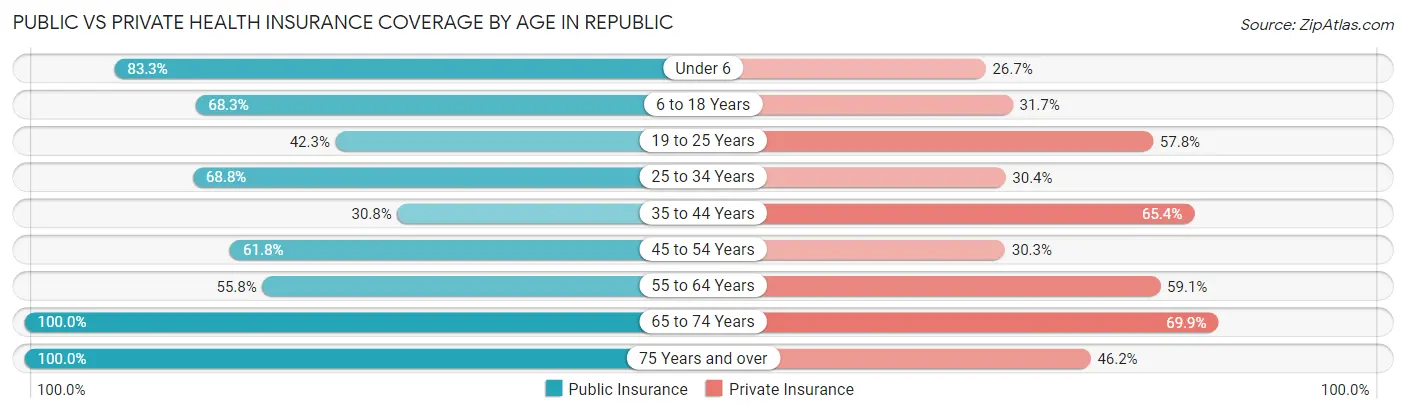
| Age Bracket | Public Insurance | Private Insurance |
| Under 6 | 75 (83.3%) | 24 (26.7%) |
| 6 to 18 Years | 97 (68.3%) | 45 (31.7%) |
| 19 to 25 Years | 30 (42.2%) | 41 (57.8%) |
| 25 to 34 Years | 77 (68.8%) | 34 (30.4%) |
| 35 to 44 Years | 32 (30.8%) | 68 (65.4%) |
| 45 to 54 Years | 47 (61.8%) | 23 (30.3%) |
| 55 to 64 Years | 86 (55.8%) | 91 (59.1%) |
| 65 to 74 Years | 176 (100.0%) | 123 (69.9%) |
| 75 Years and over | 130 (100.0%) | 60 (46.2%) |
| Total | 750 (71.1%) | 509 (48.2%) |
Disability Status by Sex by Age in Republic
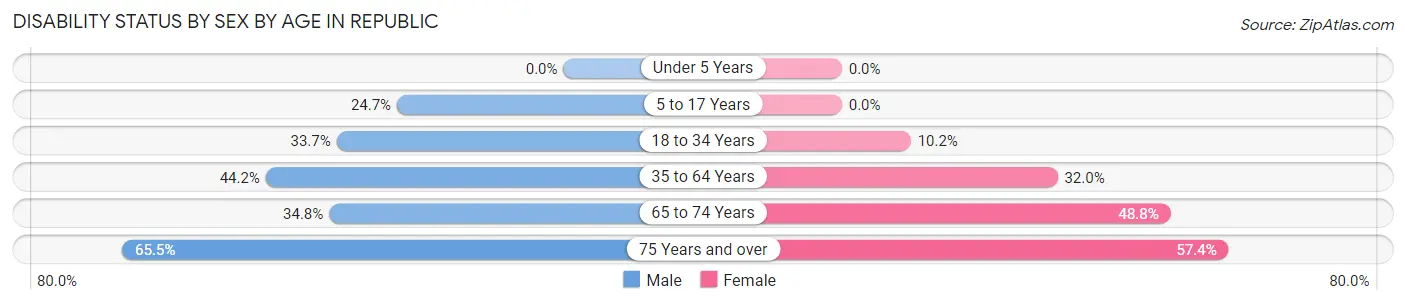
| Age Bracket | Male | Female |
| Under 5 Years | 0 (0.0%) | 0 (0.0%) |
| 5 to 17 Years | 21 (24.7%) | 0 (0.0%) |
| 18 to 34 Years | 32 (33.7%) | 9 (10.2%) |
| 35 to 64 Years | 80 (44.2%) | 49 (32.0%) |
| 65 to 74 Years | 32 (34.8%) | 41 (48.8%) |
| 75 Years and over | 19 (65.5%) | 58 (57.4%) |
Disability Class by Sex by Age in Republic
Disability Class: Hearing Difficulty
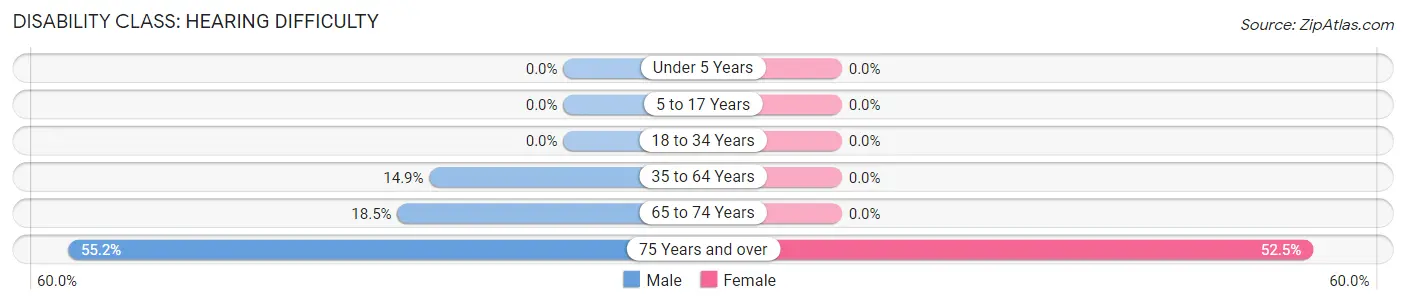
| Age Bracket | Male | Female |
| Under 5 Years | 0 (0.0%) | 0 (0.0%) |
| 5 to 17 Years | 0 (0.0%) | 0 (0.0%) |
| 18 to 34 Years | 0 (0.0%) | 0 (0.0%) |
| 35 to 64 Years | 27 (14.9%) | 0 (0.0%) |
| 65 to 74 Years | 17 (18.5%) | 0 (0.0%) |
| 75 Years and over | 16 (55.2%) | 53 (52.5%) |
Disability Class: Vision Difficulty
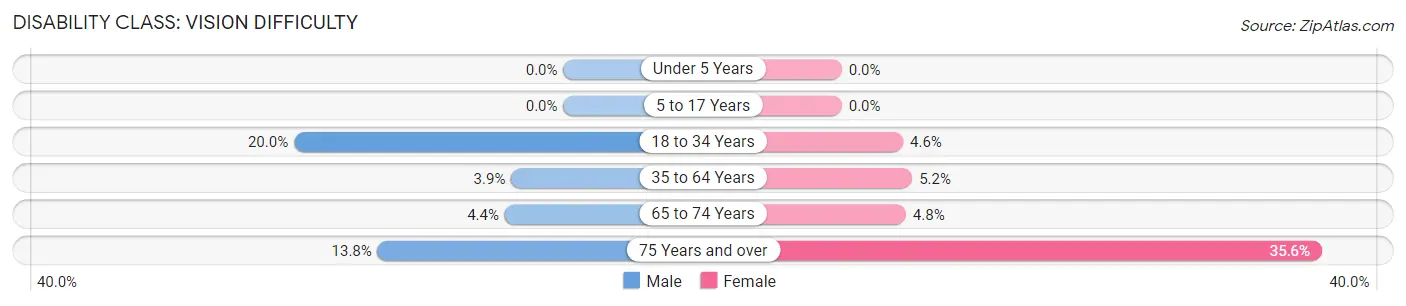
| Age Bracket | Male | Female |
| Under 5 Years | 0 (0.0%) | 0 (0.0%) |
| 5 to 17 Years | 0 (0.0%) | 0 (0.0%) |
| 18 to 34 Years | 19 (20.0%) | 4 (4.5%) |
| 35 to 64 Years | 7 (3.9%) | 8 (5.2%) |
| 65 to 74 Years | 4 (4.3%) | 4 (4.8%) |
| 75 Years and over | 4 (13.8%) | 36 (35.6%) |
Disability Class: Cognitive Difficulty
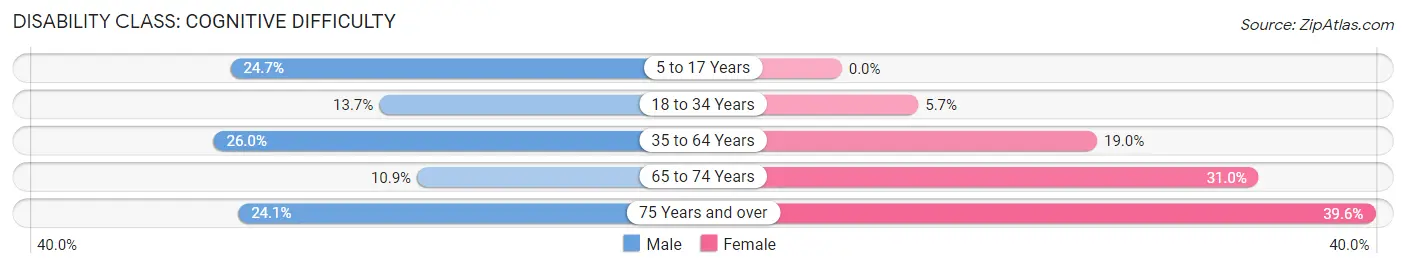
| Age Bracket | Male | Female |
| 5 to 17 Years | 21 (24.7%) | 0 (0.0%) |
| 18 to 34 Years | 13 (13.7%) | 5 (5.7%) |
| 35 to 64 Years | 47 (26.0%) | 29 (19.0%) |
| 65 to 74 Years | 10 (10.9%) | 26 (30.9%) |
| 75 Years and over | 7 (24.1%) | 40 (39.6%) |
Disability Class: Ambulatory Difficulty
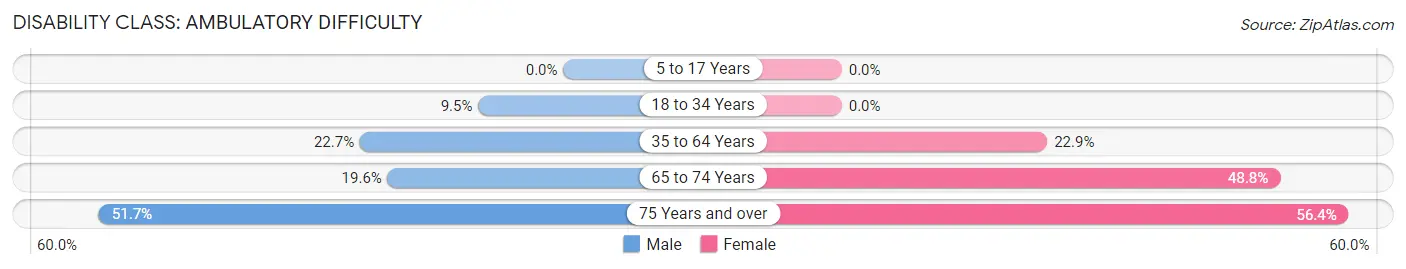
| Age Bracket | Male | Female |
| 5 to 17 Years | 0 (0.0%) | 0 (0.0%) |
| 18 to 34 Years | 9 (9.5%) | 0 (0.0%) |
| 35 to 64 Years | 41 (22.7%) | 35 (22.9%) |
| 65 to 74 Years | 18 (19.6%) | 41 (48.8%) |
| 75 Years and over | 15 (51.7%) | 57 (56.4%) |
Disability Class: Self-Care Difficulty
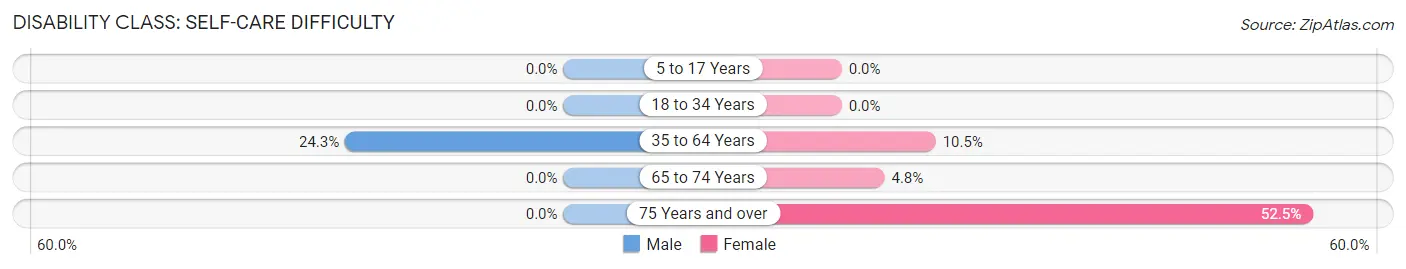
| Age Bracket | Male | Female |
| 5 to 17 Years | 0 (0.0%) | 0 (0.0%) |
| 18 to 34 Years | 0 (0.0%) | 0 (0.0%) |
| 35 to 64 Years | 44 (24.3%) | 16 (10.5%) |
| 65 to 74 Years | 0 (0.0%) | 4 (4.8%) |
| 75 Years and over | 0 (0.0%) | 53 (52.5%) |
Technology Access in Republic
Computing Device Access in Republic
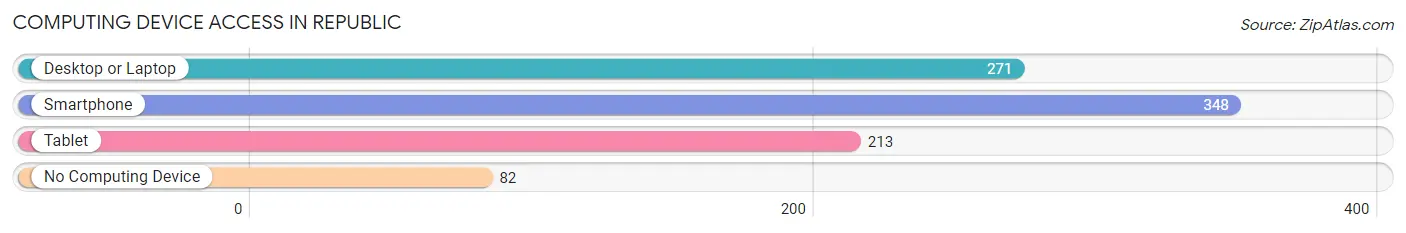
| Device Type | # Households | % Households |
| Desktop or Laptop | 271 | 56.7% |
| Smartphone | 348 | 72.8% |
| Tablet | 213 | 44.6% |
| No Computing Device | 82 | 17.2% |
| Total | 478 | 100.0% |
Internet Access in Republic
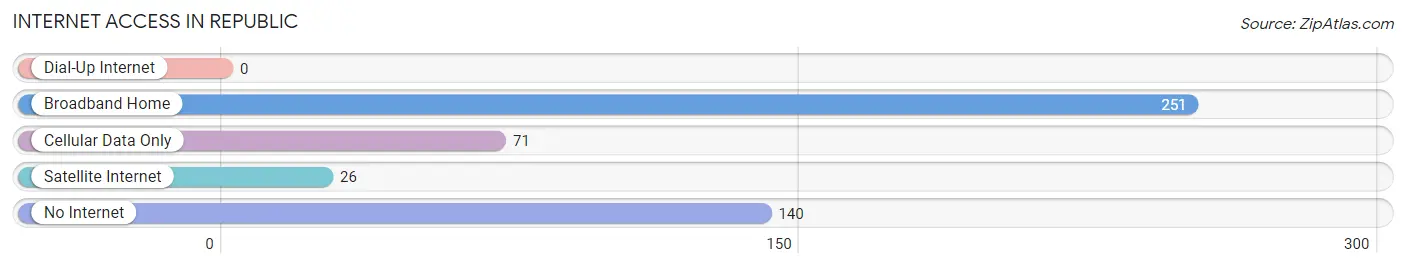
| Internet Type | # Households | % Households |
| Dial-Up Internet | 0 | 0.0% |
| Broadband Home | 251 | 52.5% |
| Cellular Data Only | 71 | 14.8% |
| Satellite Internet | 26 | 5.4% |
| No Internet | 140 | 29.3% |
| Total | 478 | 100.0% |
Republic Summary
Republic is a city located in Ferry County, Washington, United States. The population was 1,074 at the 2010 census. It is the county seat of Ferry County.
History
The area around Republic was first settled in the late 1800s by miners and homesteaders. The town was officially founded in 1891 and named after the Republic Mining Company. The town was incorporated in 1909.
Geography
Republic is located in the northeast corner of Washington, near the Canadian border. It is situated in the Kettle River Valley, at an elevation of 1,845 feet (562 m). The Kettle River flows through the city.
The city is surrounded by the Colville National Forest and is located near the Salmo-Priest Wilderness. The area is known for its outdoor recreation opportunities, including hiking, camping, fishing, and hunting.
Climate
Republic has a semi-arid climate, with hot summers and cold winters. The average annual temperature is 44.3°F (6.8°C). The average annual precipitation is 16.3 inches (414 mm).
Economy
The economy of Republic is largely based on agriculture and timber. The city is home to several timber mills and farms. The city also has a small retail sector, with several stores and restaurants.
Demographics
As of the 2010 census, there were 1,074 people, 441 households, and 270 families residing in the city. The population density was 1,074 people per square mile (414/km2). The racial makeup of the city was 94.2% White, 0.3% African American, 1.2% Native American, 0.3% Asian, 0.1% Pacific Islander, 0.7% from other races, and 2.5% from two or more races. Hispanic or Latino of any race were 3.2% of the population.
The median income for a household in the city was $30,938, and the median income for a family was $37,500. Males had a median income of $30,000 versus $20,000 for females. The per capita income for the city was $15,945. About 11.2% of families and 15.2% of the population were below the poverty line, including 19.2% of those under age 18 and 8.3% of those age 65 or over.
Common Questions
What is Per Capita Income in Republic?
Per Capita income in Republic is $29,582.
What is the Median Family Income in Republic?
Median Family Income in Republic is $57,250.
What is the Median Household income in Republic?
Median Household Income in Republic is $45,658.
What is Income or Wage Gap in Republic?
Income or Wage Gap in Republic is 24.9%.
Women in Republic earn 75.1 cents for every dollar earned by a man.
What is Inequality or Gini Index in Republic?
Inequality or Gini Index in Republic is 0.50.
What is the Total Population of Republic?
Total Population of Republic is 1,120.
What is the Total Male Population of Republic?
Total Male Population of Republic is 585.
What is the Total Female Population of Republic?
Total Female Population of Republic is 535.
What is the Ratio of Males per 100 Females in Republic?
There are 109.35 Males per 100 Females in Republic.
What is the Ratio of Females per 100 Males in Republic?
There are 91.45 Females per 100 Males in Republic.
What is the Median Population Age in Republic?
Median Population Age in Republic is 44.8 Years.
What is the Average Family Size in Republic
Average Family Size in Republic is 2.9 People.
What is the Average Household Size in Republic
Average Household Size in Republic is 2.1 People.
How Large is the Labor Force in Republic?
There are 370 People in the Labor Forcein in Republic.
What is the Percentage of People in the Labor Force in Republic?
41.1% of People are in the Labor Force in Republic.
What is the Unemployment Rate in Republic?
Unemployment Rate in Republic is 5.4%.