Cities with the Most Immigrants from Russia in Washington
RELATED REPORTS & OPTIONS
Russia
Washington
Compare Cities
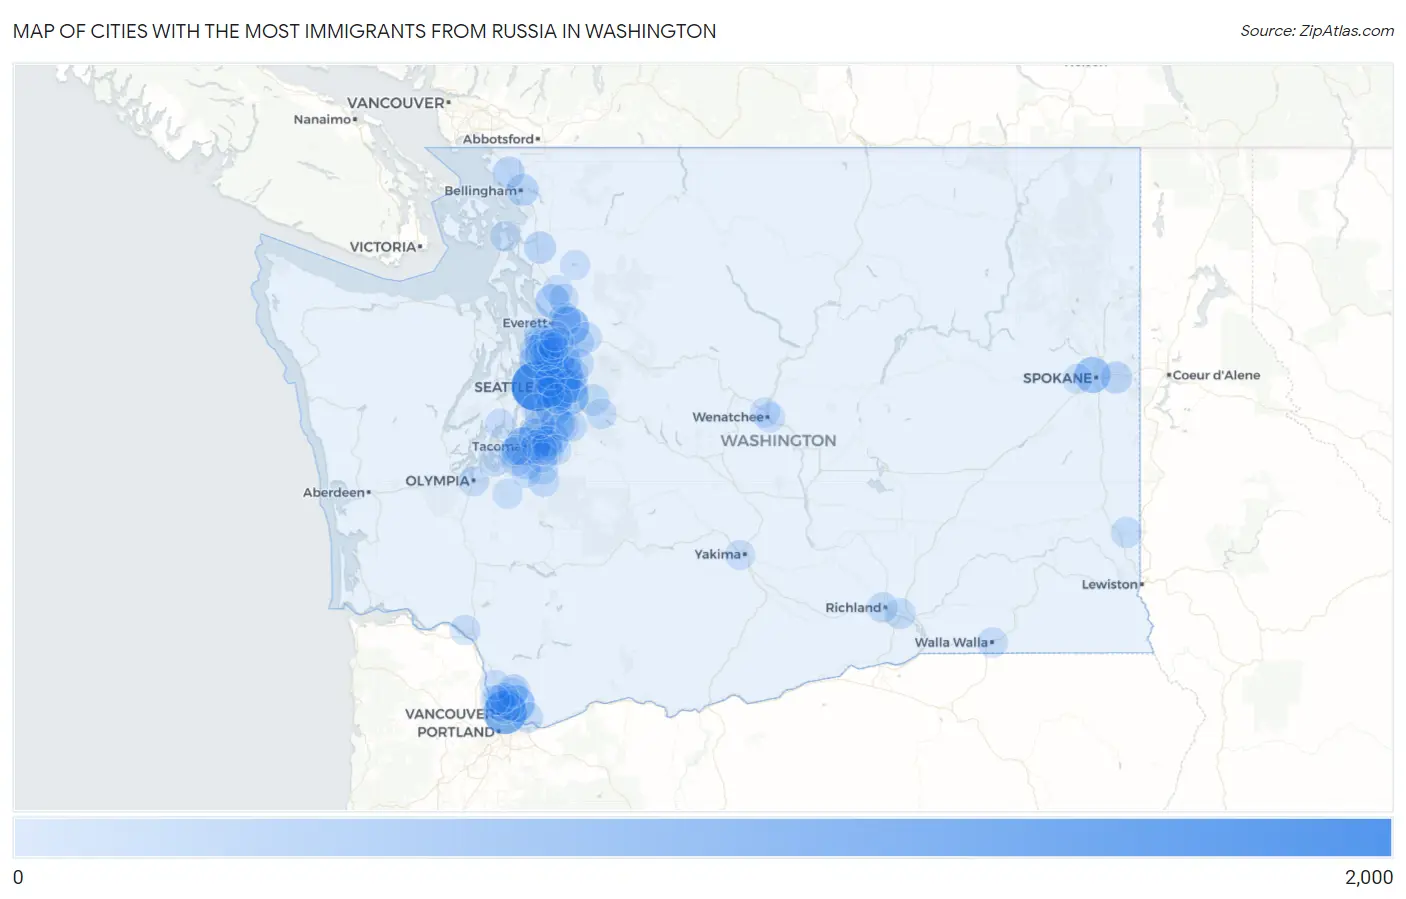
Map of Cities with the Most Immigrants from Russia in Washington
0
2,000
Cities with the Most Immigrants from Russia in Washington
| City | Russia | vs State | vs National | |
| 1. | Seattle | 1,908 | 21,540(8.86%)#1 | 406,732(0.47%)#10 |
| 2. | Vancouver | 1,276 | 21,540(5.92%)#2 | 406,732(0.31%)#18 |
| 3. | Bellevue | 1,182 | 21,540(5.49%)#3 | 406,732(0.29%)#21 |
| 4. | Tacoma | 811 | 21,540(3.77%)#4 | 406,732(0.20%)#40 |
| 5. | Everett | 758 | 21,540(3.52%)#5 | 406,732(0.19%)#43 |
| 6. | Redmond | 752 | 21,540(3.49%)#6 | 406,732(0.18%)#45 |
| 7. | Orchards | 684 | 21,540(3.18%)#7 | 406,732(0.17%)#52 |
| 8. | Issaquah | 654 | 21,540(3.04%)#8 | 406,732(0.16%)#58 |
| 9. | Spokane | 590 | 21,540(2.74%)#9 | 406,732(0.15%)#65 |
| 10. | Renton | 567 | 21,540(2.63%)#10 | 406,732(0.14%)#71 |
| 11. | Kirkland | 563 | 21,540(2.61%)#11 | 406,732(0.14%)#74 |
| 12. | Federal Way | 537 | 21,540(2.49%)#12 | 406,732(0.13%)#80 |
| 13. | Auburn | 435 | 21,540(2.02%)#13 | 406,732(0.11%)#109 |
| 14. | Shoreline | 425 | 21,540(1.97%)#14 | 406,732(0.10%)#114 |
| 15. | Marysville | 392 | 21,540(1.82%)#15 | 406,732(0.10%)#127 |
| 16. | Kent | 387 | 21,540(1.80%)#16 | 406,732(0.10%)#130 |
| 17. | Sammamish | 327 | 21,540(1.52%)#17 | 406,732(0.08%)#156 |
| 18. | Bothell | 316 | 21,540(1.47%)#18 | 406,732(0.08%)#164 |
| 19. | Maltby | 294 | 21,540(1.36%)#19 | 406,732(0.07%)#176 |
| 20. | Bellingham | 217 | 21,540(1.01%)#20 | 406,732(0.05%)#239 |
| 21. | Lynnwood | 216 | 21,540(1.00%)#21 | 406,732(0.05%)#243 |
| 22. | Mount Vernon | 214 | 21,540(0.99%)#22 | 406,732(0.05%)#245 |
| 23. | Lake Stevens | 206 | 21,540(0.96%)#23 | 406,732(0.05%)#261 |
| 24. | Union Hill Novelty Hill | 202 | 21,540(0.94%)#24 | 406,732(0.05%)#270 |
| 25. | Mukilteo | 197 | 21,540(0.91%)#25 | 406,732(0.05%)#281 |
| 26. | Spokane Valley | 195 | 21,540(0.91%)#26 | 406,732(0.05%)#284 |
| 27. | Ferndale | 190 | 21,540(0.88%)#27 | 406,732(0.05%)#299 |
| 28. | Battle Ground | 175 | 21,540(0.81%)#28 | 406,732(0.04%)#334 |
| 29. | Woodinville | 170 | 21,540(0.79%)#29 | 406,732(0.04%)#341 |
| 30. | Lake Stickney | 164 | 21,540(0.76%)#30 | 406,732(0.04%)#355 |
| 31. | Bothell West | 148 | 21,540(0.69%)#31 | 406,732(0.04%)#394 |
| 32. | Picnic Point | 141 | 21,540(0.65%)#32 | 406,732(0.03%)#408 |
| 33. | Snoqualmie | 139 | 21,540(0.65%)#33 | 406,732(0.03%)#413 |
| 34. | South Hill | 135 | 21,540(0.63%)#34 | 406,732(0.03%)#425 |
| 35. | Maple Valley | 123 | 21,540(0.57%)#35 | 406,732(0.03%)#471 |
| 36. | Parkland | 121 | 21,540(0.56%)#36 | 406,732(0.03%)#476 |
| 37. | Graham | 119 | 21,540(0.55%)#37 | 406,732(0.03%)#490 |
| 38. | Cottage Lake | 116 | 21,540(0.54%)#38 | 406,732(0.03%)#500 |
| 39. | Camas | 115 | 21,540(0.53%)#39 | 406,732(0.03%)#506 |
| 40. | Hazel Dell | 112 | 21,540(0.52%)#40 | 406,732(0.03%)#519 |
| 41. | Lakeland South | 108 | 21,540(0.50%)#41 | 406,732(0.03%)#540 |
| 42. | Five Corners | 106 | 21,540(0.49%)#42 | 406,732(0.03%)#549 |
| 43. | Woods Creek | 104 | 21,540(0.48%)#43 | 406,732(0.03%)#562 |
| 44. | Pullman | 100 | 21,540(0.46%)#44 | 406,732(0.02%)#587 |
| 45. | Pasco | 99 | 21,540(0.46%)#45 | 406,732(0.02%)#590 |
| 46. | North Lynnwood | 93 | 21,540(0.43%)#46 | 406,732(0.02%)#610 |
| 47. | Richland | 92 | 21,540(0.43%)#47 | 406,732(0.02%)#616 |
| 48. | Kenmore | 89 | 21,540(0.41%)#48 | 406,732(0.02%)#642 |
| 49. | Mercer Island | 88 | 21,540(0.41%)#49 | 406,732(0.02%)#650 |
| 50. | Martha Lake | 87 | 21,540(0.40%)#50 | 406,732(0.02%)#662 |
| 51. | Mountlake Terrace | 86 | 21,540(0.40%)#51 | 406,732(0.02%)#669 |
| 52. | Bothell East | 85 | 21,540(0.39%)#52 | 406,732(0.02%)#680 |
| 53. | Covington | 83 | 21,540(0.39%)#53 | 406,732(0.02%)#697 |
| 54. | Monroe | 80 | 21,540(0.37%)#54 | 406,732(0.02%)#718 |
| 55. | Wilderness Rim | 79 | 21,540(0.37%)#55 | 406,732(0.02%)#727 |
| 56. | Minnehaha | 76 | 21,540(0.35%)#56 | 406,732(0.02%)#750 |
| 57. | University Place | 68 | 21,540(0.32%)#57 | 406,732(0.02%)#824 |
| 58. | Salmon Creek | 65 | 21,540(0.30%)#58 | 406,732(0.02%)#873 |
| 59. | Pacific | 64 | 21,540(0.30%)#59 | 406,732(0.02%)#888 |
| 60. | Burien | 60 | 21,540(0.28%)#60 | 406,732(0.01%)#930 |
| 61. | Algona | 59 | 21,540(0.27%)#61 | 406,732(0.01%)#952 |
| 62. | Cavalero | 57 | 21,540(0.26%)#62 | 406,732(0.01%)#989 |
| 63. | Edmonds | 55 | 21,540(0.26%)#63 | 406,732(0.01%)#1,009 |
| 64. | Walla Walla | 54 | 21,540(0.25%)#64 | 406,732(0.01%)#1,027 |
| 65. | Ridgefield | 54 | 21,540(0.25%)#65 | 406,732(0.01%)#1,033 |
| 66. | Olympia | 53 | 21,540(0.25%)#66 | 406,732(0.01%)#1,044 |
| 67. | Longview | 52 | 21,540(0.24%)#67 | 406,732(0.01%)#1,060 |
| 68. | Duvall | 52 | 21,540(0.24%)#68 | 406,732(0.01%)#1,068 |
| 69. | Lake Tapps | 50 | 21,540(0.23%)#69 | 406,732(0.01%)#1,113 |
| 70. | Brier | 50 | 21,540(0.23%)#70 | 406,732(0.01%)#1,117 |
| 71. | Mill Creek | 47 | 21,540(0.22%)#71 | 406,732(0.01%)#1,166 |
| 72. | Clyde Hill | 47 | 21,540(0.22%)#72 | 406,732(0.01%)#1,172 |
| 73. | Anderson Island | 45 | 21,540(0.21%)#73 | 406,732(0.01%)#1,217 |
| 74. | Spanaway | 41 | 21,540(0.19%)#74 | 406,732(0.01%)#1,307 |
| 75. | Newcastle | 40 | 21,540(0.19%)#75 | 406,732(0.01%)#1,353 |
| 76. | Fife | 40 | 21,540(0.19%)#76 | 406,732(0.01%)#1,355 |
| 77. | Lake Cavanaugh | 40 | 21,540(0.19%)#77 | 406,732(0.01%)#1,361 |
| 78. | Lakewood | 39 | 21,540(0.18%)#78 | 406,732(0.01%)#1,366 |
| 79. | Fife Heights | 39 | 21,540(0.18%)#79 | 406,732(0.01%)#1,387 |
| 80. | Silver Firs | 38 | 21,540(0.18%)#80 | 406,732(0.01%)#1,397 |
| 81. | North Yelm | 38 | 21,540(0.18%)#81 | 406,732(0.01%)#1,410 |
| 82. | Meadow Glade | 38 | 21,540(0.18%)#82 | 406,732(0.01%)#1,411 |
| 83. | Sumner | 36 | 21,540(0.17%)#83 | 406,732(0.01%)#1,454 |
| 84. | Mount Vista | 36 | 21,540(0.17%)#84 | 406,732(0.01%)#1,455 |
| 85. | Puyallup | 35 | 21,540(0.16%)#85 | 406,732(0.01%)#1,469 |
| 86. | Arlington | 34 | 21,540(0.16%)#86 | 406,732(0.01%)#1,511 |
| 87. | East Wenatchee | 33 | 21,540(0.15%)#87 | 406,732(0.01%)#1,551 |
| 88. | Mill Creek East | 32 | 21,540(0.15%)#88 | 406,732(0.01%)#1,577 |
| 89. | Edgewood | 32 | 21,540(0.15%)#89 | 406,732(0.01%)#1,583 |
| 90. | Wenatchee | 30 | 21,540(0.14%)#90 | 406,732(0.01%)#1,641 |
| 91. | Des Moines | 28 | 21,540(0.13%)#91 | 406,732(0.01%)#1,713 |
| 92. | Anacortes | 28 | 21,540(0.13%)#92 | 406,732(0.01%)#1,719 |
| 93. | Felida | 28 | 21,540(0.13%)#93 | 406,732(0.01%)#1,724 |
| 94. | Yakima | 27 | 21,540(0.13%)#94 | 406,732(0.01%)#1,740 |
| 95. | Wauna | 27 | 21,540(0.13%)#95 | 406,732(0.01%)#1,764 |
| 96. | Sisco Heights | 27 | 21,540(0.13%)#96 | 406,732(0.01%)#1,768 |
| 97. | Fairwood Cdp King County | 26 | 21,540(0.12%)#97 | 406,732(0.01%)#1,796 |
| 98. | Eastmont | 25 | 21,540(0.12%)#98 | 406,732(0.01%)#1,830 |
| 99. | Airway Heights | 25 | 21,540(0.12%)#99 | 406,732(0.01%)#1,849 |
| 100. | Fircrest | 25 | 21,540(0.12%)#100 | 406,732(0.01%)#1,855 |
Common Questions
What are the Top 10 Cities with the Most Immigrants from Russia in Washington?
Top 10 Cities with the Most Immigrants from Russia in Washington are:
What city has the Most Immigrants from Russia in Washington?
Seattle has the Most Immigrants from Russia in Washington with 1,908.
What is the Total Immigrants from Russia in the State of Washington?
Total Immigrants from Russia in Washington is 21,540.
What is the Total Immigrants from Russia in the United States?
Total Immigrants from Russia in the United States is 406,732.