Zip Codes with the Highest Percentage of Population Employed in Food Preparation & Serving in Vancouver, WA
RELATED REPORTS & OPTIONS
Food Preparation & Serving
Vancouver
Compare Zip Codes
Map of Zip Codes with the Highest Percentage of Population Employed in Food Preparation & Serving in Vancouver
2.7%
7.7%
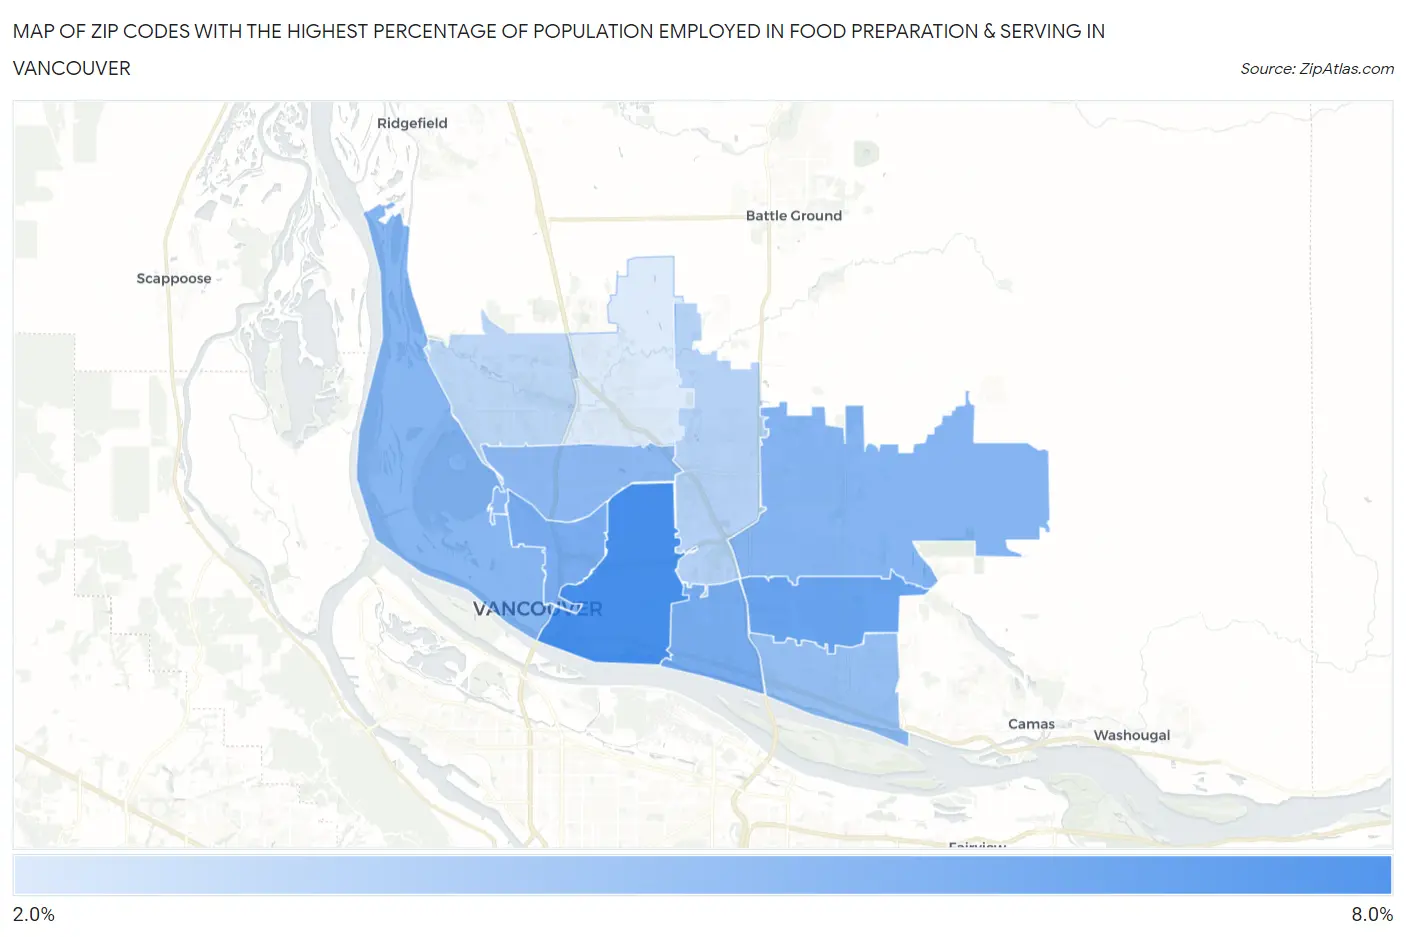
Zip Codes with the Highest Percentage of Population Employed in Food Preparation & Serving in Vancouver, WA
| Zip Code | % Employed | vs State | vs National | |
| 1. | 98661 | 7.7% | 5.1% (+2.57)#91 | 5.3% (+2.43)#5,191 |
| 2. | 98684 | 6.5% | 5.1% (+1.41)#125 | 5.3% (+1.26)#7,737 |
| 3. | 98664 | 6.1% | 5.1% (+0.928)#163 | 5.3% (+0.785)#9,111 |
| 4. | 98663 | 6.0% | 5.1% (+0.857)#164 | 5.3% (+0.714)#9,344 |
| 5. | 98682 | 5.6% | 5.1% (+0.456)#185 | 5.3% (+0.313)#10,703 |
| 6. | 98660 | 5.5% | 5.1% (+0.365)#194 | 5.3% (+0.222)#11,041 |
| 7. | 98665 | 5.4% | 5.1% (+0.213)#207 | 5.3% (+0.070)#11,558 |
| 8. | 98683 | 5.0% | 5.1% (-0.106)#241 | 5.3% (-0.249)#12,793 |
| 9. | 98662 | 3.9% | 5.1% (-1.20)#324 | 5.3% (-1.34)#17,349 |
| 10. | 98685 | 3.8% | 5.1% (-1.39)#337 | 5.3% (-1.53)#18,120 |
| 11. | 98686 | 2.7% | 5.1% (-2.48)#420 | 5.3% (-2.62)#22,554 |
1
Common Questions
What are the Top 10 Zip Codes with the Highest Percentage of Population Employed in Food Preparation & Serving in Vancouver, WA?
Top 10 Zip Codes with the Highest Percentage of Population Employed in Food Preparation & Serving in Vancouver, WA are:
What zip code has the Highest Percentage of Population Employed in Food Preparation & Serving in Vancouver, WA?
98661 has the Highest Percentage of Population Employed in Food Preparation & Serving in Vancouver, WA with 7.7%.
What is the Percentage of Population Employed in Food Preparation & Serving in Vancouver, WA?
Percentage of Population Employed in Food Preparation & Serving in Vancouver is 6.4%.
What is the Percentage of Population Employed in Food Preparation & Serving in Washington?
Percentage of Population Employed in Food Preparation & Serving in Washington is 5.1%.
What is the Percentage of Population Employed in Food Preparation & Serving in the United States?
Percentage of Population Employed in Food Preparation & Serving in the United States is 5.3%.