Cities with the Highest Percentage of Immigrants from Burma / Myanmar in Washington
RELATED REPORTS & OPTIONS
Burma / Myanmar
Washington
Compare Cities
Map of Cities with the Highest Percentage of Immigrants from Burma / Myanmar in Washington
0.00%
2.00%
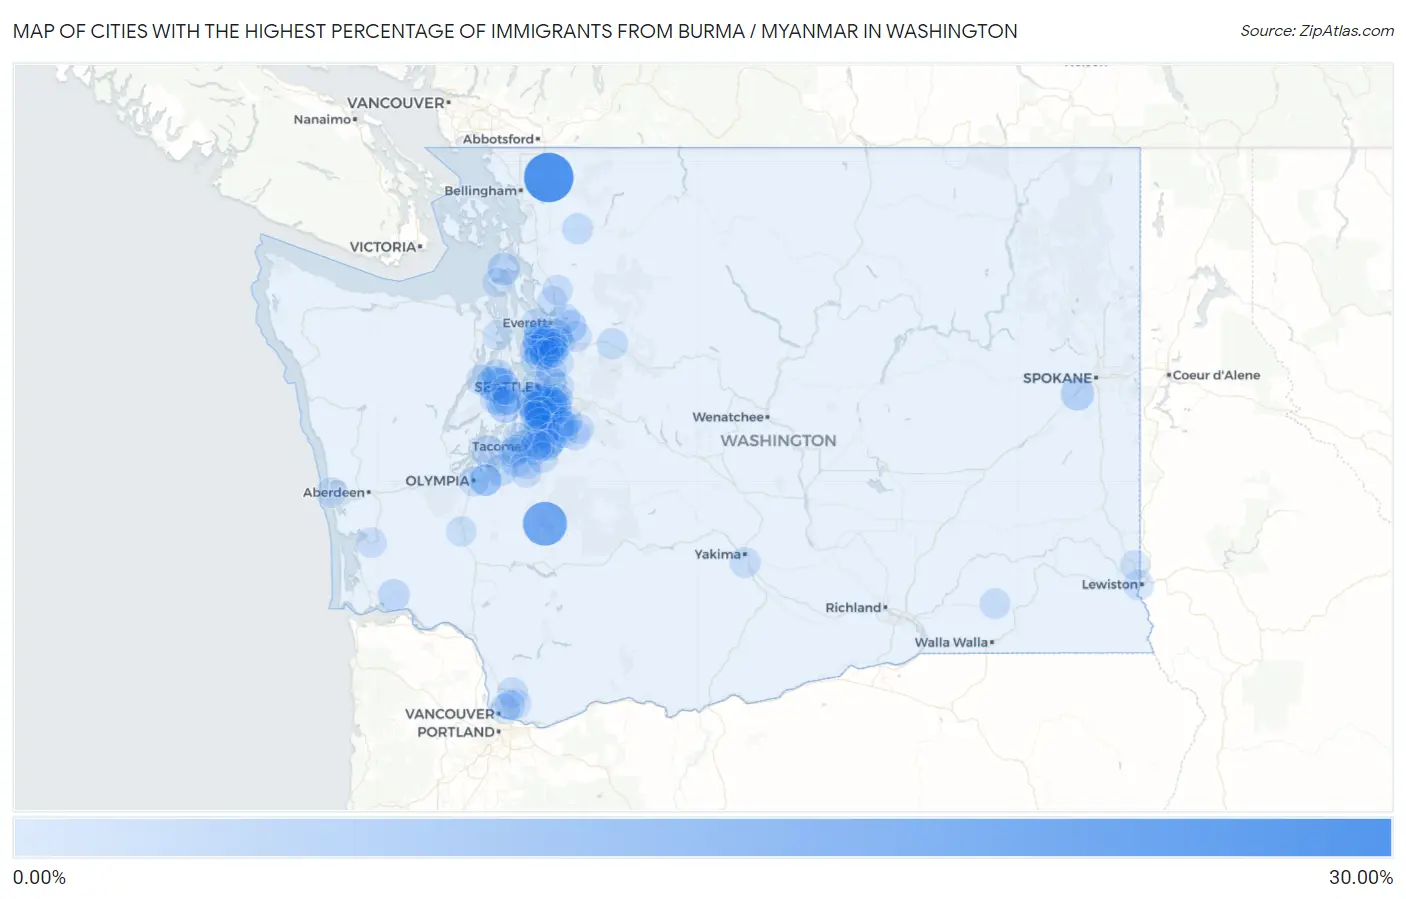
Cities with the Highest Percentage of Immigrants from Burma / Myanmar in Washington
| City | Burma / Myanmar | vs State | vs National | |
| 1. | Tukwila | 1.73% | 0.041%(+1.69)#3 | 0.047%(+1.68)#97 |
| 2. | Peaceful Valley | 0.99% | 0.041%(+0.953)#109 | 0.047%(+0.947)#1,880 |
| 3. | Winlock | 0.92% | 0.041%(+0.878)#201 | 0.047%(+0.872)#3,923 |
| 4. | Selah | 0.74% | 0.041%(+0.702)#202 | 0.047%(+0.696)#3,924 |
| 5. | Quincy | 0.72% | 0.041%(+0.681)#203 | 0.047%(+0.675)#3,925 |
| 6. | Kent | 0.70% | 0.041%(+0.659)#204 | 0.047%(+0.653)#3,926 |
| 7. | Seatac | 0.70% | 0.041%(+0.657)#205 | 0.047%(+0.651)#3,927 |
| 8. | Fairwood Cdp Spokane County | 0.58% | 0.041%(+0.536)#206 | 0.047%(+0.529)#3,928 |
| 9. | Black Diamond | 0.55% | 0.041%(+0.504)#207 | 0.047%(+0.498)#3,929 |
| 10. | Wilderness Rim | 0.53% | 0.041%(+0.493)#252 | 0.047%(+0.487)#5,853 |
| 11. | Alderwood Manor | 0.31% | 0.041%(+0.272)#253 | 0.047%(+0.266)#5,854 |
| 12. | Pasco | 0.24% | 0.041%(+0.201)#254 | 0.047%(+0.195)#5,855 |
| 13. | Hockinson | 0.24% | 0.041%(+0.199)#281 | 0.047%(+0.193)#7,281 |
| 14. | Camas | 0.19% | 0.041%(+0.144)#282 | 0.047%(+0.138)#7,282 |
| 15. | Picnic Point | 0.18% | 0.041%(+0.140)#283 | 0.047%(+0.133)#7,283 |
| 16. | Mukilteo | 0.15% | 0.041%(+0.113)#284 | 0.047%(+0.107)#7,284 |
| 17. | Kennewick | 0.15% | 0.041%(+0.107)#285 | 0.047%(+0.101)#7,285 |
| 18. | Fort Lewis | 0.14% | 0.041%(+0.100)#286 | 0.047%(+0.094)#7,286 |
| 19. | North Lynnwood | 0.13% | 0.041%(+0.091)#287 | 0.047%(+0.085)#7,287 |
| 20. | Spokane | 0.12% | 0.041%(+0.076)#288 | 0.047%(+0.070)#7,288 |
| 21. | Shoreline | 0.073% | 0.041%(+0.032)#289 | 0.047%(+0.026)#7,289 |
| 22. | Bellevue | 0.062% | 0.041%(+0.021)#290 | 0.047%(+0.015)#7,290 |
| 23. | Tacoma | 0.043% | 0.041%(+0.002)#291 | 0.047%(-0.005)#7,291 |
| 24. | South Hill | 0.040% | 0.041%(-0.001)#292 | 0.047%(-0.008)#7,292 |
| 25. | Everett | 0.038% | 0.041%(-0.003)#293 | 0.047%(-0.010)#7,293 |
| 26. | Auburn | 0.037% | 0.041%(-0.004)#294 | 0.047%(-0.010)#7,294 |
| 27. | Federal Way | 0.036% | 0.041%(-0.005)#295 | 0.047%(-0.011)#7,295 |
| 28. | Pullman | 0.034% | 0.041%(-0.007)#296 | 0.047%(-0.013)#7,296 |
| 29. | Camano | 0.034% | 0.041%(-0.007)#297 | 0.047%(-0.013)#7,297 |
| 30. | Vancouver | 0.030% | 0.041%(-0.011)#298 | 0.047%(-0.017)#7,298 |
| 31. | Bellingham | 0.027% | 0.041%(-0.014)#299 | 0.047%(-0.020)#7,299 |
| 32. | Burien | 0.023% | 0.041%(-0.018)#300 | 0.047%(-0.024)#7,300 |
| 33. | Fairwood Cdp King County | 0.021% | 0.041%(-0.020)#301 | 0.047%(-0.026)#7,301 |
| 34. | Kirkland | 0.011% | 0.041%(-0.030)#302 | 0.047%(-0.037)#7,302 |
| 35. | Seattle | 0.0068% | 0.041%(-0.034)#303 | 0.047%(-0.041)#7,303 |
| 36. | Lakewood | 0.0032% | 0.041%(-0.038)#304 | 0.047%(-0.044)#7,304 |
Common Questions
What are the Top 10 Cities with the Highest Percentage of Immigrants from Burma / Myanmar in Washington?
Top 10 Cities with the Highest Percentage of Immigrants from Burma / Myanmar in Washington are:
#1
1.73%
#2
0.99%
#3
0.92%
#4
0.74%
#5
0.72%
#6
0.70%
#7
0.70%
#8
0.55%
#9
0.53%
#10
0.31%
What city has the Highest Percentage of Immigrants from Burma / Myanmar in Washington?
Tukwila has the Highest Percentage of Immigrants from Burma / Myanmar in Washington with 1.73%.
What is the Percentage of Immigrants from Burma / Myanmar in the State of Washington?
Percentage of Immigrants from Burma / Myanmar in Washington is 0.041%.
What is the Percentage of Immigrants from Burma / Myanmar in the United States?
Percentage of Immigrants from Burma / Myanmar in the United States is 0.047%.