Cities with the Highest Percentage of Immigrants from Spain in Washington
RELATED REPORTS & OPTIONS
Spain
Washington
Compare Cities
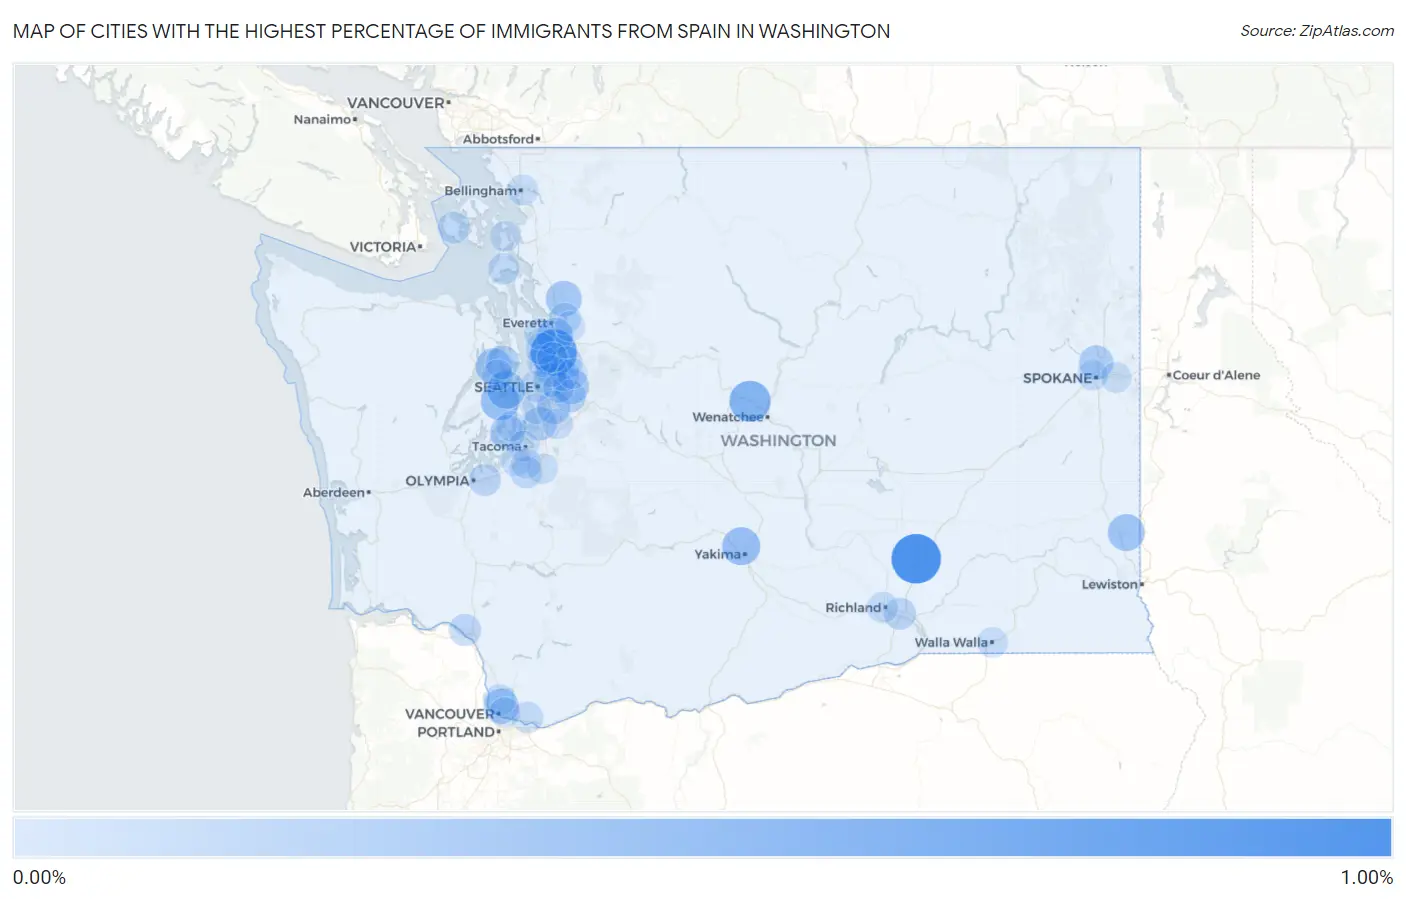
Map of Cities with the Highest Percentage of Immigrants from Spain in Washington
0.00%
1.00%
Cities with the Highest Percentage of Immigrants from Spain in Washington
| City | Spain | vs State | vs National | |
| 1. | Mesa | 0.84% | 0.027%(+0.810)#1 | 0.037%(+0.800)#104 |
| 2. | Bothell East | 0.70% | 0.027%(+0.668)#2 | 0.037%(+0.659)#136 |
| 3. | Cashmere | 0.46% | 0.027%(+0.435)#3 | 0.037%(+0.426)#233 |
| 4. | Port Orchard | 0.34% | 0.027%(+0.314)#4 | 0.037%(+0.305)#333 |
| 5. | Selah | 0.33% | 0.027%(+0.302)#5 | 0.037%(+0.293)#344 |
| 6. | Enetai | 0.32% | 0.027%(+0.294)#6 | 0.037%(+0.284)#356 |
| 7. | Pullman | 0.28% | 0.027%(+0.254)#7 | 0.037%(+0.245)#415 |
| 8. | Eastmont | 0.25% | 0.027%(+0.223)#8 | 0.037%(+0.214)#484 |
| 9. | Bangor Base | 0.25% | 0.027%(+0.221)#9 | 0.037%(+0.212)#489 |
| 10. | Sisco Heights | 0.24% | 0.027%(+0.208)#10 | 0.037%(+0.199)#517 |
| 11. | Sammamish | 0.22% | 0.027%(+0.197)#11 | 0.037%(+0.187)#539 |
| 12. | Hazel Dell | 0.20% | 0.027%(+0.175)#12 | 0.037%(+0.166)#590 |
| 13. | Gig Harbor | 0.20% | 0.027%(+0.174)#13 | 0.037%(+0.165)#594 |
| 14. | Country Homes | 0.18% | 0.027%(+0.149)#14 | 0.037%(+0.140)#655 |
| 15. | Yarrow Point | 0.16% | 0.027%(+0.129)#15 | 0.037%(+0.120)#711 |
| 16. | Poulsbo | 0.15% | 0.027%(+0.125)#16 | 0.037%(+0.116)#720 |
| 17. | Des Moines | 0.15% | 0.027%(+0.123)#17 | 0.037%(+0.113)#731 |
| 18. | Renton | 0.13% | 0.027%(+0.106)#18 | 0.037%(+0.096)#785 |
| 19. | Cottage Lake | 0.099% | 0.027%(+0.072)#19 | 0.037%(+0.062)#926 |
| 20. | Issaquah | 0.091% | 0.027%(+0.064)#20 | 0.037%(+0.055)#975 |
| 21. | Longview | 0.085% | 0.027%(+0.058)#21 | 0.037%(+0.048)#1,001 |
| 22. | Pasco | 0.084% | 0.027%(+0.057)#22 | 0.037%(+0.048)#1,005 |
| 23. | Lacey | 0.078% | 0.027%(+0.051)#23 | 0.037%(+0.042)#1,046 |
| 24. | Redmond | 0.076% | 0.027%(+0.049)#24 | 0.037%(+0.039)#1,065 |
| 25. | Friday Harbor | 0.076% | 0.027%(+0.048)#25 | 0.037%(+0.039)#1,066 |
| 26. | Spanaway | 0.068% | 0.027%(+0.040)#26 | 0.037%(+0.031)#1,131 |
| 27. | Lake Stevens | 0.064% | 0.027%(+0.037)#27 | 0.037%(+0.028)#1,159 |
| 28. | Kirkland | 0.061% | 0.027%(+0.034)#28 | 0.037%(+0.024)#1,186 |
| 29. | Camas | 0.061% | 0.027%(+0.033)#29 | 0.037%(+0.024)#1,190 |
| 30. | Lake Forest Park | 0.059% | 0.027%(+0.032)#30 | 0.037%(+0.023)#1,201 |
| 31. | Salmon Creek | 0.059% | 0.027%(+0.032)#31 | 0.037%(+0.023)#1,204 |
| 32. | Lynnwood | 0.058% | 0.027%(+0.031)#32 | 0.037%(+0.021)#1,213 |
| 33. | Oak Harbor | 0.057% | 0.027%(+0.030)#33 | 0.037%(+0.021)#1,219 |
| 34. | Mukilteo | 0.056% | 0.027%(+0.029)#34 | 0.037%(+0.020)#1,227 |
| 35. | Seattle | 0.051% | 0.027%(+0.024)#35 | 0.037%(+0.014)#1,277 |
| 36. | Richland | 0.048% | 0.027%(+0.020)#36 | 0.037%(+0.011)#1,323 |
| 37. | Bellingham | 0.034% | 0.027%(+0.007)#37 | 0.037%(-0.003)#1,488 |
| 38. | Silverdale | 0.032% | 0.027%(+0.005)#38 | 0.037%(-0.004)#1,507 |
| 39. | Walla Walla | 0.030% | 0.027%(+0.002)#39 | 0.037%(-0.007)#1,538 |
| 40. | Spokane | 0.029% | 0.027%(+0.002)#40 | 0.037%(-0.007)#1,539 |
| 41. | Spokane Valley | 0.026% | 0.027%(-0.001)#41 | 0.037%(-0.011)#1,586 |
| 42. | Tacoma | 0.025% | 0.027%(-0.002)#42 | 0.037%(-0.011)#1,599 |
| 43. | Bellevue | 0.025% | 0.027%(-0.003)#43 | 0.037%(-0.012)#1,610 |
| 44. | Burien | 0.019% | 0.027%(-0.008)#44 | 0.037%(-0.017)#1,688 |
| 45. | Maplewood | 0.018% | 0.027%(-0.009)#45 | 0.037%(-0.018)#1,708 |
| 46. | Vancouver | 0.018% | 0.027%(-0.009)#46 | 0.037%(-0.019)#1,712 |
| 47. | Kent | 0.012% | 0.027%(-0.015)#47 | 0.037%(-0.025)#1,790 |
| 48. | Anacortes | 0.011% | 0.027%(-0.016)#48 | 0.037%(-0.025)#1,801 |
| 49. | Lakewood | 0.011% | 0.027%(-0.016)#49 | 0.037%(-0.025)#1,805 |
| 50. | Bothell | 0.010% | 0.027%(-0.017)#50 | 0.037%(-0.026)#1,817 |
| 51. | Union Hill Novelty Hill | 0.0086% | 0.027%(-0.019)#51 | 0.037%(-0.028)#1,847 |
| 52. | South Hill | 0.0074% | 0.027%(-0.020)#52 | 0.037%(-0.029)#1,864 |
| 53. | Parkland | 0.0051% | 0.027%(-0.022)#53 | 0.037%(-0.031)#1,893 |
| 54. | Everett | 0.0036% | 0.027%(-0.024)#54 | 0.037%(-0.033)#1,907 |
Common Questions
What are the Top 10 Cities with the Highest Percentage of Immigrants from Spain in Washington?
Top 10 Cities with the Highest Percentage of Immigrants from Spain in Washington are:
#1
0.84%
#2
0.70%
#3
0.46%
#4
0.34%
#5
0.33%
#6
0.32%
#7
0.28%
#8
0.25%
#9
0.25%
#10
0.24%
What city has the Highest Percentage of Immigrants from Spain in Washington?
Mesa has the Highest Percentage of Immigrants from Spain in Washington with 0.84%.
What is the Percentage of Immigrants from Spain in the State of Washington?
Percentage of Immigrants from Spain in Washington is 0.027%.
What is the Percentage of Immigrants from Spain in the United States?
Percentage of Immigrants from Spain in the United States is 0.037%.