Cities with the Highest Percentage of Immigrants from Western Europe in Washington
RELATED REPORTS & OPTIONS
Western Europe
Washington
Compare Cities
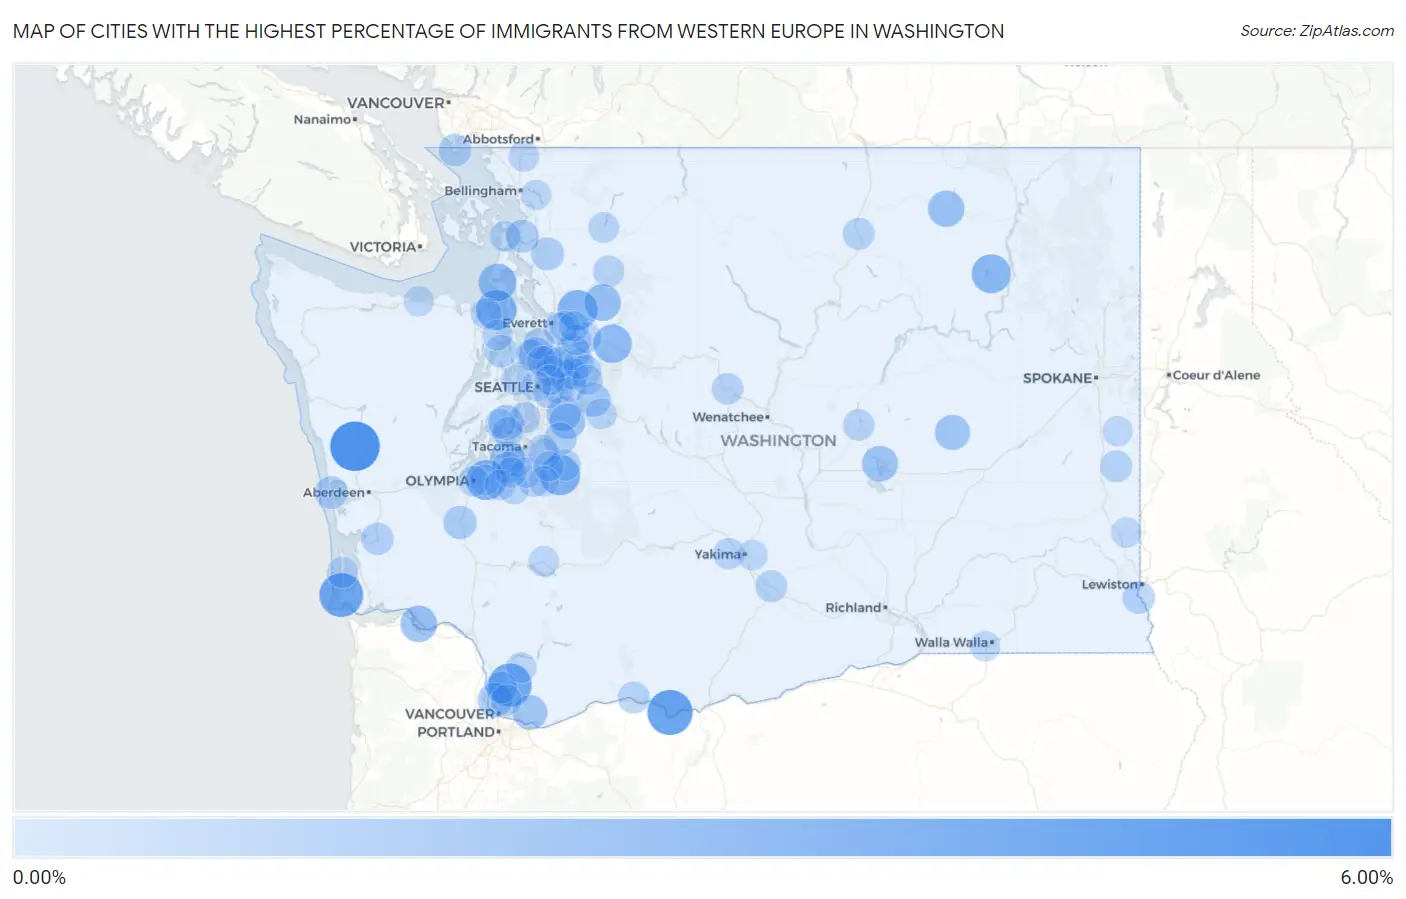
Map of Cities with the Highest Percentage of Immigrants from Western Europe in Washington
0.00%
6.00%
Cities with the Highest Percentage of Immigrants from Western Europe in Washington
| City | Western Europe | vs State | vs National | |
| 1. | Humptulips | 5.31% | 0.38%(+4.93)#1 | 0.28%(+5.03)#112 |
| 2. | Dallesport | 4.21% | 0.38%(+3.83)#2 | 0.28%(+3.93)#162 |
| 3. | Long Beach | 3.88% | 0.38%(+3.50)#3 | 0.28%(+3.60)#173 |
| 4. | Cherry Grove | 3.73% | 0.38%(+3.35)#4 | 0.28%(+3.45)#183 |
| 5. | Crocker | 3.04% | 0.38%(+2.66)#5 | 0.28%(+2.76)#253 |
| 6. | Tanglewilde | 2.97% | 0.38%(+2.59)#6 | 0.28%(+2.69)#262 |
| 7. | Marrowstone | 2.95% | 0.38%(+2.57)#7 | 0.28%(+2.67)#266 |
| 8. | Lake Bosworth | 2.93% | 0.38%(+2.55)#8 | 0.28%(+2.65)#268 |
| 9. | Twin Lakes | 2.70% | 0.38%(+2.32)#9 | 0.28%(+2.42)#312 |
| 10. | May Creek | 2.52% | 0.38%(+2.14)#10 | 0.28%(+2.24)#351 |
| 11. | Coupeville | 2.40% | 0.38%(+2.02)#11 | 0.28%(+2.12)#374 |
| 12. | Verlot | 2.13% | 0.38%(+1.75)#12 | 0.28%(+1.85)#462 |
| 13. | Puget Island | 2.08% | 0.38%(+1.70)#13 | 0.28%(+1.80)#478 |
| 14. | Republic | 2.05% | 0.38%(+1.68)#14 | 0.28%(+1.77)#493 |
| 15. | Cascade Valley | 1.91% | 0.38%(+1.53)#15 | 0.28%(+1.63)#554 |
| 16. | Shadow Lake | 1.84% | 0.38%(+1.47)#16 | 0.28%(+1.56)#580 |
| 17. | Purdy | 1.76% | 0.38%(+1.38)#17 | 0.28%(+1.48)#631 |
| 18. | Odessa | 1.75% | 0.38%(+1.38)#18 | 0.28%(+1.48)#633 |
| 19. | High Bridge | 1.71% | 0.38%(+1.33)#19 | 0.28%(+1.43)#648 |
| 20. | Steilacoom | 1.71% | 0.38%(+1.33)#20 | 0.28%(+1.43)#649 |
| 21. | Esperance | 1.69% | 0.38%(+1.31)#21 | 0.28%(+1.41)#664 |
| 22. | Fern Prairie | 1.64% | 0.38%(+1.27)#22 | 0.28%(+1.37)#693 |
| 23. | Maple Heights Lake Desire | 1.63% | 0.38%(+1.25)#23 | 0.28%(+1.35)#706 |
| 24. | Felida | 1.62% | 0.38%(+1.24)#24 | 0.28%(+1.34)#713 |
| 25. | Suncrest | 1.48% | 0.38%(+1.10)#25 | 0.28%(+1.20)#808 |
| 26. | Snoqualmie | 1.38% | 0.38%(+1.00)#26 | 0.28%(+1.10)#894 |
| 27. | Grand Mound | 1.34% | 0.38%(+0.959)#27 | 0.28%(+1.06)#938 |
| 28. | Bay View | 1.26% | 0.38%(+0.882)#28 | 0.28%(+0.981)#1,027 |
| 29. | Big Lake | 1.24% | 0.38%(+0.857)#29 | 0.28%(+0.956)#1,050 |
| 30. | Roche Harbor | 1.20% | 0.38%(+0.817)#30 | 0.28%(+0.916)#1,099 |
| 31. | Lake Holm | 1.18% | 0.38%(+0.799)#31 | 0.28%(+0.898)#1,134 |
| 32. | Ocean Shores | 1.14% | 0.38%(+0.763)#32 | 0.28%(+0.861)#1,185 |
| 33. | Lofall | 1.13% | 0.38%(+0.751)#33 | 0.28%(+0.849)#1,201 |
| 34. | Point Roberts | 1.12% | 0.38%(+0.743)#34 | 0.28%(+0.842)#1,210 |
| 35. | Asotin | 1.09% | 0.38%(+0.713)#35 | 0.28%(+0.811)#1,256 |
| 36. | Fobes Hill | 1.08% | 0.38%(+0.704)#36 | 0.28%(+0.803)#1,270 |
| 37. | Lake Marcel Stillwater | 1.07% | 0.38%(+0.697)#37 | 0.28%(+0.795)#1,284 |
| 38. | Raymond | 1.07% | 0.38%(+0.689)#38 | 0.28%(+0.788)#1,299 |
| 39. | Duluth | 0.99% | 0.38%(+0.608)#39 | 0.28%(+0.706)#1,458 |
| 40. | Zillah | 0.98% | 0.38%(+0.605)#40 | 0.28%(+0.704)#1,467 |
| 41. | Redmond | 0.97% | 0.38%(+0.596)#41 | 0.28%(+0.695)#1,483 |
| 42. | White Salmon | 0.96% | 0.38%(+0.580)#42 | 0.28%(+0.679)#1,513 |
| 43. | Riverside | 0.94% | 0.38%(+0.566)#43 | 0.28%(+0.664)#1,547 |
| 44. | Oakesdale | 0.94% | 0.38%(+0.559)#44 | 0.28%(+0.657)#1,562 |
| 45. | North Fort Lewis | 0.93% | 0.38%(+0.552)#45 | 0.28%(+0.651)#1,573 |
| 46. | Bellevue | 0.91% | 0.38%(+0.534)#46 | 0.28%(+0.633)#1,622 |
| 47. | Leavenworth | 0.88% | 0.38%(+0.500)#47 | 0.28%(+0.599)#1,720 |
| 48. | Union Hill Novelty Hill | 0.85% | 0.38%(+0.472)#48 | 0.28%(+0.571)#1,782 |
| 49. | South Prairie | 0.85% | 0.38%(+0.472)#49 | 0.28%(+0.571)#1,784 |
| 50. | Lakeview | 0.84% | 0.38%(+0.466)#50 | 0.28%(+0.565)#1,806 |
| 51. | Ocean Park | 0.84% | 0.38%(+0.462)#51 | 0.28%(+0.560)#1,814 |
| 52. | Summitview | 0.83% | 0.38%(+0.448)#52 | 0.28%(+0.546)#1,847 |
| 53. | Mercer Island | 0.82% | 0.38%(+0.447)#53 | 0.28%(+0.545)#1,850 |
| 54. | Swede Heaven | 0.82% | 0.38%(+0.446)#54 | 0.28%(+0.545)#1,853 |
| 55. | Elk Plain | 0.81% | 0.38%(+0.431)#55 | 0.28%(+0.529)#1,895 |
| 56. | Woodway | 0.81% | 0.38%(+0.427)#56 | 0.28%(+0.526)#1,911 |
| 57. | Kenmore | 0.79% | 0.38%(+0.410)#57 | 0.28%(+0.508)#1,964 |
| 58. | Kirkland | 0.78% | 0.38%(+0.405)#58 | 0.28%(+0.503)#1,981 |
| 59. | Sammamish | 0.78% | 0.38%(+0.400)#59 | 0.28%(+0.499)#1,997 |
| 60. | Meadowdale | 0.77% | 0.38%(+0.390)#60 | 0.28%(+0.489)#2,027 |
| 61. | Roy | 0.76% | 0.38%(+0.383)#61 | 0.28%(+0.482)#2,051 |
| 62. | Concrete | 0.76% | 0.38%(+0.380)#62 | 0.28%(+0.478)#2,064 |
| 63. | Barberton | 0.76% | 0.38%(+0.377)#63 | 0.28%(+0.476)#2,071 |
| 64. | Woodinville | 0.75% | 0.38%(+0.374)#64 | 0.28%(+0.473)#2,076 |
| 65. | Port Hadlock Irondale | 0.75% | 0.38%(+0.374)#65 | 0.28%(+0.472)#2,077 |
| 66. | Duvall | 0.75% | 0.38%(+0.373)#66 | 0.28%(+0.471)#2,081 |
| 67. | Wilderness Rim | 0.75% | 0.38%(+0.370)#67 | 0.28%(+0.469)#2,085 |
| 68. | Lakewood | 0.73% | 0.38%(+0.351)#68 | 0.28%(+0.449)#2,176 |
| 69. | Lynden | 0.73% | 0.38%(+0.347)#69 | 0.28%(+0.446)#2,186 |
| 70. | Woods Creek | 0.72% | 0.38%(+0.346)#70 | 0.28%(+0.444)#2,192 |
| 71. | Lacey | 0.72% | 0.38%(+0.338)#71 | 0.28%(+0.437)#2,213 |
| 72. | Vashon | 0.69% | 0.38%(+0.317)#72 | 0.28%(+0.415)#2,277 |
| 73. | Olympia | 0.69% | 0.38%(+0.317)#73 | 0.28%(+0.415)#2,279 |
| 74. | Monroe North | 0.69% | 0.38%(+0.314)#74 | 0.28%(+0.412)#2,288 |
| 75. | Port Ludlow | 0.68% | 0.38%(+0.300)#75 | 0.28%(+0.399)#2,343 |
| 76. | Nisqually Indian Community | 0.67% | 0.38%(+0.297)#76 | 0.28%(+0.395)#2,357 |
| 77. | Anacortes | 0.67% | 0.38%(+0.296)#77 | 0.28%(+0.394)#2,362 |
| 78. | Gig Harbor | 0.67% | 0.38%(+0.293)#78 | 0.28%(+0.392)#2,371 |
| 79. | Lake Forest Park | 0.67% | 0.38%(+0.291)#79 | 0.28%(+0.389)#2,388 |
| 80. | Bainbridge Island | 0.66% | 0.38%(+0.283)#80 | 0.28%(+0.381)#2,415 |
| 81. | Bunk Foss | 0.66% | 0.38%(+0.282)#81 | 0.28%(+0.380)#2,422 |
| 82. | Amboy | 0.65% | 0.38%(+0.277)#82 | 0.28%(+0.375)#2,446 |
| 83. | North Puyallup | 0.65% | 0.38%(+0.270)#83 | 0.28%(+0.368)#2,485 |
| 84. | Terrace Heights | 0.64% | 0.38%(+0.266)#84 | 0.28%(+0.365)#2,503 |
| 85. | Snohomish | 0.64% | 0.38%(+0.264)#85 | 0.28%(+0.362)#2,517 |
| 86. | Spanaway | 0.64% | 0.38%(+0.263)#86 | 0.28%(+0.362)#2,522 |
| 87. | Fort Lewis | 0.64% | 0.38%(+0.262)#87 | 0.28%(+0.361)#2,526 |
| 88. | Carnation | 0.64% | 0.38%(+0.258)#88 | 0.28%(+0.357)#2,549 |
| 89. | Yarrow Point | 0.63% | 0.38%(+0.247)#89 | 0.28%(+0.346)#2,608 |
| 90. | College Place | 0.62% | 0.38%(+0.245)#90 | 0.28%(+0.343)#2,616 |
| 91. | Edgewood | 0.62% | 0.38%(+0.243)#91 | 0.28%(+0.342)#2,623 |
| 92. | Seattle | 0.62% | 0.38%(+0.242)#92 | 0.28%(+0.340)#2,632 |
| 93. | Pullman | 0.62% | 0.38%(+0.238)#93 | 0.28%(+0.337)#2,655 |
| 94. | Graham | 0.61% | 0.38%(+0.232)#94 | 0.28%(+0.330)#2,701 |
| 95. | Sudden Valley | 0.61% | 0.38%(+0.228)#95 | 0.28%(+0.326)#2,726 |
| 96. | Morton | 0.60% | 0.38%(+0.222)#96 | 0.28%(+0.321)#2,754 |
| 97. | Port Angeles East | 0.59% | 0.38%(+0.215)#97 | 0.28%(+0.314)#2,777 |
| 98. | Mcmillin | 0.59% | 0.38%(+0.208)#98 | 0.28%(+0.307)#2,814 |
| 99. | Waverly | 0.58% | 0.38%(+0.207)#99 | 0.28%(+0.306)#2,829 |
| 100. | Wauna | 0.58% | 0.38%(+0.198)#100 | 0.28%(+0.297)#2,864 |
Common Questions
What are the Top 10 Cities with the Highest Percentage of Immigrants from Western Europe in Washington?
Top 10 Cities with the Highest Percentage of Immigrants from Western Europe in Washington are:
#1
5.31%
#2
4.21%
#3
3.88%
#4
3.73%
#5
3.04%
#6
2.97%
#7
2.95%
#8
2.93%
#9
2.70%
#10
2.52%
What city has the Highest Percentage of Immigrants from Western Europe in Washington?
Humptulips has the Highest Percentage of Immigrants from Western Europe in Washington with 5.31%.
What is the Percentage of Immigrants from Western Europe in the State of Washington?
Percentage of Immigrants from Western Europe in Washington is 0.38%.
What is the Percentage of Immigrants from Western Europe in the United States?
Percentage of Immigrants from Western Europe in the United States is 0.28%.