Cities with the Highest Percentage of Indian (Asian) Population in Washington
RELATED REPORTS & OPTIONS
Indian (Asian)
Washington
Compare Cities
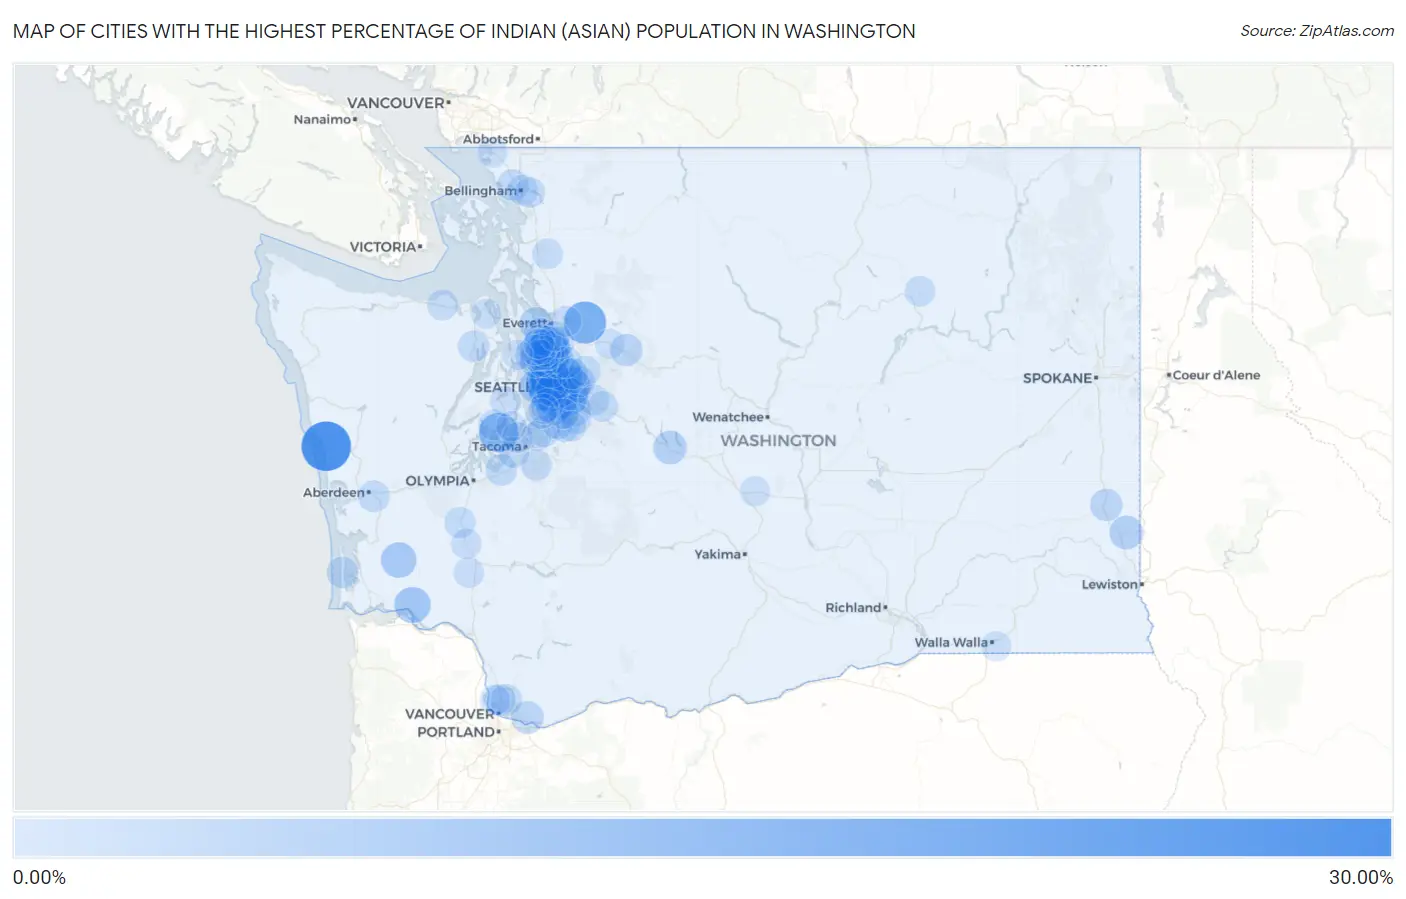
Map of Cities with the Highest Percentage of Indian (Asian) Population in Washington
0.00%
30.00%
Cities with the Highest Percentage of Indian (Asian) Population in Washington
| City | Indian (Asian) | vs State | vs National | |
| 1. | Qui Nai Elt Village | 28.57% | 2.65%(+25.9)#1 | 1.61%(+27.0)#30 |
| 2. | Medina | 18.85% | 2.65%(+16.2)#2 | 1.61%(+17.2)#83 |
| 3. | Lake Roesiger | 18.17% | 2.65%(+15.5)#3 | 1.61%(+16.6)#94 |
| 4. | Clyde Hill | 17.70% | 2.65%(+15.0)#4 | 1.61%(+16.1)#102 |
| 5. | Yarrow Point | 17.50% | 2.65%(+14.8)#5 | 1.61%(+15.9)#105 |
| 6. | Bellevue | 15.32% | 2.65%(+12.7)#6 | 1.61%(+13.7)#142 |
| 7. | Newcastle | 15.06% | 2.65%(+12.4)#7 | 1.61%(+13.4)#155 |
| 8. | Raft Island | 14.41% | 2.65%(+11.8)#8 | 1.61%(+12.8)#167 |
| 9. | Mercer Island | 13.60% | 2.65%(+10.9)#9 | 1.61%(+12.0)#174 |
| 10. | Sammamish | 13.03% | 2.65%(+10.4)#10 | 1.61%(+11.4)#184 |
| 11. | Redmond | 11.60% | 2.65%(+8.95)#11 | 1.61%(+9.99)#233 |
| 12. | Issaquah | 10.95% | 2.65%(+8.29)#12 | 1.61%(+9.34)#256 |
| 13. | Hunts Point | 10.53% | 2.65%(+7.87)#13 | 1.61%(+8.92)#271 |
| 14. | Skamokawa Valley | 10.07% | 2.65%(+7.42)#14 | 1.61%(+8.46)#299 |
| 15. | Lebam | 8.93% | 2.65%(+6.28)#15 | 1.61%(+7.32)#358 |
| 16. | Martha Lake | 8.38% | 2.65%(+5.73)#16 | 1.61%(+6.78)#389 |
| 17. | Bothell East | 8.09% | 2.65%(+5.44)#17 | 1.61%(+6.48)#404 |
| 18. | Renton | 7.59% | 2.65%(+4.94)#18 | 1.61%(+5.98)#440 |
| 19. | Seattle | 7.14% | 2.65%(+4.49)#19 | 1.61%(+5.53)#471 |
| 20. | Pullman | 6.42% | 2.65%(+3.77)#20 | 1.61%(+4.82)#535 |
| 21. | Easton | 6.40% | 2.65%(+3.75)#21 | 1.61%(+4.79)#539 |
| 22. | Kirkland | 6.40% | 2.65%(+3.75)#22 | 1.61%(+4.79)#540 |
| 23. | Fairwood Cdp King County | 6.33% | 2.65%(+3.68)#23 | 1.61%(+4.73)#550 |
| 24. | Mill Creek | 6.29% | 2.65%(+3.64)#24 | 1.61%(+4.68)#557 |
| 25. | Clinton | 6.09% | 2.65%(+3.44)#25 | 1.61%(+4.49)#581 |
| 26. | Shoreline | 5.84% | 2.65%(+3.19)#26 | 1.61%(+4.23)#618 |
| 27. | Bryn Mawr Skyway | 5.75% | 2.65%(+3.10)#27 | 1.61%(+4.14)#633 |
| 28. | Kenmore | 5.69% | 2.65%(+3.04)#28 | 1.61%(+4.08)#638 |
| 29. | Bothell | 5.66% | 2.65%(+3.01)#29 | 1.61%(+4.05)#641 |
| 30. | Beaux Arts Village | 5.43% | 2.65%(+2.77)#30 | 1.61%(+3.82)#667 |
| 31. | Larch Way | 5.39% | 2.65%(+2.74)#31 | 1.61%(+3.78)#677 |
| 32. | Mill Creek East | 5.20% | 2.65%(+2.55)#32 | 1.61%(+3.59)#713 |
| 33. | Camas | 5.12% | 2.65%(+2.47)#33 | 1.61%(+3.51)#730 |
| 34. | Colfax | 4.64% | 2.65%(+1.99)#34 | 1.61%(+3.04)#820 |
| 35. | Index | 4.55% | 2.65%(+1.89)#35 | 1.61%(+2.94)#853 |
| 36. | Ames Lake | 4.51% | 2.65%(+1.86)#36 | 1.61%(+2.90)#864 |
| 37. | Woodway | 4.47% | 2.65%(+1.82)#37 | 1.61%(+2.86)#874 |
| 38. | Woodinville | 4.39% | 2.65%(+1.74)#38 | 1.61%(+2.78)#887 |
| 39. | Mirrormont | 4.31% | 2.65%(+1.66)#39 | 1.61%(+2.71)#902 |
| 40. | Lakeland North | 4.22% | 2.65%(+1.57)#40 | 1.61%(+2.61)#916 |
| 41. | Bothell West | 4.21% | 2.65%(+1.56)#41 | 1.61%(+2.60)#917 |
| 42. | Mukilteo | 4.17% | 2.65%(+1.51)#42 | 1.61%(+2.56)#923 |
| 43. | Esperance | 4.15% | 2.65%(+1.50)#43 | 1.61%(+2.54)#927 |
| 44. | Ocean Park | 3.93% | 2.65%(+1.28)#44 | 1.61%(+2.33)#979 |
| 45. | North Lynnwood | 3.89% | 2.65%(+1.23)#45 | 1.61%(+2.28)#994 |
| 46. | Cosmopolis | 3.86% | 2.65%(+1.21)#46 | 1.61%(+2.25)#1,003 |
| 47. | Barberton | 3.85% | 2.65%(+1.20)#47 | 1.61%(+2.24)#1,008 |
| 48. | Marietta Alderwood | 3.81% | 2.65%(+1.16)#48 | 1.61%(+2.20)#1,018 |
| 49. | Lake Forest Park | 3.80% | 2.65%(+1.15)#49 | 1.61%(+2.19)#1,019 |
| 50. | Covington | 3.78% | 2.65%(+1.12)#50 | 1.61%(+2.17)#1,024 |
| 51. | Quilcene | 3.77% | 2.65%(+1.12)#51 | 1.61%(+2.16)#1,025 |
| 52. | Cottage Lake | 3.71% | 2.65%(+1.05)#52 | 1.61%(+2.10)#1,044 |
| 53. | Dupont | 3.63% | 2.65%(+0.974)#53 | 1.61%(+2.02)#1,069 |
| 54. | Grand Mound | 3.40% | 2.65%(+0.747)#54 | 1.61%(+1.79)#1,140 |
| 55. | Salmon Creek | 3.37% | 2.65%(+0.715)#55 | 1.61%(+1.76)#1,151 |
| 56. | Brier | 3.14% | 2.65%(+0.483)#56 | 1.61%(+1.53)#1,236 |
| 57. | Lake Marcel Stillwater | 3.08% | 2.65%(+0.428)#57 | 1.61%(+1.47)#1,261 |
| 58. | Kent | 3.06% | 2.65%(+0.409)#58 | 1.61%(+1.45)#1,269 |
| 59. | Picnic Point | 3.04% | 2.65%(+0.393)#59 | 1.61%(+1.44)#1,276 |
| 60. | Clear Lake Cdp Skagit County | 3.03% | 2.65%(+0.381)#60 | 1.61%(+1.42)#1,281 |
| 61. | Summit View | 3.01% | 2.65%(+0.354)#61 | 1.61%(+1.40)#1,302 |
| 62. | Snoqualmie | 2.96% | 2.65%(+0.313)#62 | 1.61%(+1.36)#1,321 |
| 63. | Union Hill Novelty Hill | 2.95% | 2.65%(+0.295)#63 | 1.61%(+1.34)#1,330 |
| 64. | Stansberry Lake | 2.87% | 2.65%(+0.221)#64 | 1.61%(+1.26)#1,349 |
| 65. | Erlands Point | 2.86% | 2.65%(+0.212)#65 | 1.61%(+1.26)#1,355 |
| 66. | University Place | 2.77% | 2.65%(+0.121)#66 | 1.61%(+1.16)#1,398 |
| 67. | Alderwood Manor | 2.76% | 2.65%(+0.113)#67 | 1.61%(+1.16)#1,404 |
| 68. | North Bend | 2.76% | 2.65%(+0.103)#68 | 1.61%(+1.15)#1,412 |
| 69. | Silver Firs | 2.75% | 2.65%(+0.097)#69 | 1.61%(+1.14)#1,416 |
| 70. | Carlsborg | 2.68% | 2.65%(+0.030)#70 | 1.61%(+1.07)#1,456 |
| 71. | Lake Stickney | 2.68% | 2.65%(+0.027)#71 | 1.61%(+1.07)#1,457 |
| 72. | Ruston | 2.68% | 2.65%(+0.025)#72 | 1.61%(+1.07)#1,459 |
| 73. | Mountlake Terrace | 2.62% | 2.65%(-0.029)#73 | 1.61%(+1.01)#1,489 |
| 74. | Nespelem | 2.58% | 2.65%(-0.071)#74 | 1.61%(+0.972)#1,516 |
| 75. | Hobart | 2.57% | 2.65%(-0.080)#75 | 1.61%(+0.963)#1,521 |
| 76. | Big Lake | 2.56% | 2.65%(-0.094)#76 | 1.61%(+0.950)#1,534 |
| 77. | Cavalero | 2.54% | 2.65%(-0.113)#77 | 1.61%(+0.931)#1,549 |
| 78. | Edmonds | 2.50% | 2.65%(-0.156)#78 | 1.61%(+0.887)#1,583 |
| 79. | Bellingham | 2.40% | 2.65%(-0.256)#79 | 1.61%(+0.787)#1,645 |
| 80. | Felida | 2.39% | 2.65%(-0.266)#80 | 1.61%(+0.777)#1,656 |
| 81. | Lynnwood | 2.37% | 2.65%(-0.279)#81 | 1.61%(+0.764)#1,669 |
| 82. | Winlock | 2.35% | 2.65%(-0.303)#82 | 1.61%(+0.741)#1,687 |
| 83. | Chehalis | 2.26% | 2.65%(-0.389)#83 | 1.61%(+0.654)#1,751 |
| 84. | Maple Valley | 2.22% | 2.65%(-0.436)#84 | 1.61%(+0.607)#1,779 |
| 85. | Kingston | 2.17% | 2.65%(-0.485)#85 | 1.61%(+0.559)#1,815 |
| 86. | Clear Lake Cdp Pierce County | 2.16% | 2.65%(-0.491)#86 | 1.61%(+0.552)#1,822 |
| 87. | Geneva | 2.15% | 2.65%(-0.505)#87 | 1.61%(+0.538)#1,828 |
| 88. | East Port Orchard | 2.15% | 2.65%(-0.507)#88 | 1.61%(+0.536)#1,831 |
| 89. | Port Hadlock Irondale | 2.04% | 2.65%(-0.608)#89 | 1.61%(+0.436)#1,901 |
| 90. | Maple Heights Lake Desire | 2.01% | 2.65%(-0.644)#90 | 1.61%(+0.399)#1,934 |
| 91. | Blaine | 1.99% | 2.65%(-0.657)#91 | 1.61%(+0.386)#1,946 |
| 92. | Eastmont | 1.98% | 2.65%(-0.671)#92 | 1.61%(+0.372)#1,969 |
| 93. | Federal Way | 1.98% | 2.65%(-0.673)#93 | 1.61%(+0.370)#1,972 |
| 94. | Seatac | 1.97% | 2.65%(-0.680)#94 | 1.61%(+0.364)#1,976 |
| 95. | Tukwila | 1.95% | 2.65%(-0.700)#95 | 1.61%(+0.343)#1,999 |
| 96. | Gold Bar | 1.92% | 2.65%(-0.727)#96 | 1.61%(+0.316)#2,023 |
| 97. | Meadowdale | 1.90% | 2.65%(-0.749)#97 | 1.61%(+0.294)#2,044 |
| 98. | Kittitas | 1.87% | 2.65%(-0.778)#98 | 1.61%(+0.265)#2,068 |
| 99. | Maplewood | 1.87% | 2.65%(-0.785)#99 | 1.61%(+0.258)#2,080 |
| 100. | Walla Walla East | 1.86% | 2.65%(-0.790)#100 | 1.61%(+0.253)#2,084 |
Common Questions
What are the Top 10 Cities with the Highest Percentage of Indian (Asian) Population in Washington?
Top 10 Cities with the Highest Percentage of Indian (Asian) Population in Washington are:
#1
28.57%
#2
18.85%
#3
18.17%
#4
17.70%
#5
17.50%
#6
15.32%
#7
15.06%
#8
14.41%
#9
13.60%
#10
13.03%
What city has the Highest Percentage of Indian (Asian) Population in Washington?
Qui nai elt Village has the Highest Percentage of Indian (Asian) Population in Washington with 28.57%.
What is the Percentage of Indian (Asian) Population in the State of Washington?
Percentage of Indian (Asian) Population in Washington is 2.65%.
What is the Percentage of Indian (Asian) Population in the United States?
Percentage of Indian (Asian) Population in the United States is 1.61%.