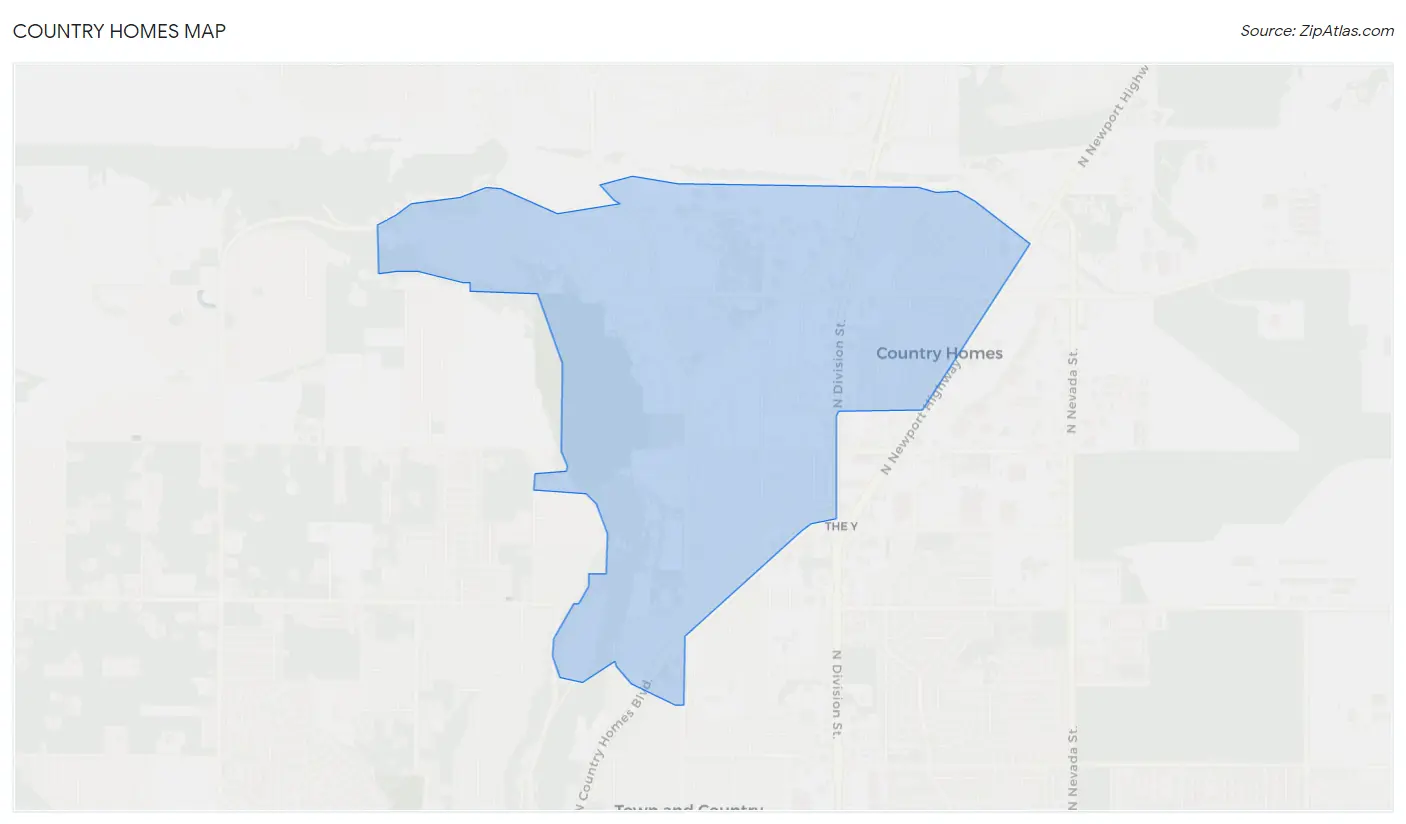
Country Homes, WA Map & Demographics
Country Homes Map
Country Homes Overview
$28,807
PER CAPITA INCOME
$80,965
AVG FAMILY INCOME
$71,985
AVG HOUSEHOLD INCOME
7.8%
WAGE / INCOME GAP [ % ]
92.2¢/ $1
WAGE / INCOME GAP [ $ ]
0.51
INEQUALITY / GINI INDEX
6,248
TOTAL POPULATION
2,935
MALE POPULATION
3,313
FEMALE POPULATION
88.59
MALES / 100 FEMALES
112.88
FEMALES / 100 MALES
27.3
MEDIAN AGE
3.0
AVG FAMILY SIZE
2.7
AVG HOUSEHOLD SIZE
2,750
LABOR FORCE [ PEOPLE ]
51.2%
PERCENT IN LABOR FORCE
9.7%
UNEMPLOYMENT RATE
Income in Country Homes
Income Overview in Country Homes
Per Capita Income in Country Homes is $28,807, while median incomes of families and households are $80,965 and $71,985 respectively.
| Characteristic | Number | Measure |
| Per Capita Income | 6,248 | $28,807 |
| Median Family Income | 1,150 | $80,965 |
| Mean Family Income | 1,150 | $115,951 |
| Median Household Income | 1,825 | $71,985 |
| Mean Household Income | 1,825 | $93,776 |
| Income Deficit | 1,150 | $0 |
| Wage / Income Gap (%) | 6,248 | 7.82% |
| Wage / Income Gap ($) | 6,248 | 92.18¢ per $1 |
| Gini / Inequality Index | 6,248 | 0.51 |
Earnings by Sex in Country Homes
Average Earnings in Country Homes are $12,857, $13,415 for men and $12,366 for women, a difference of 7.8%.
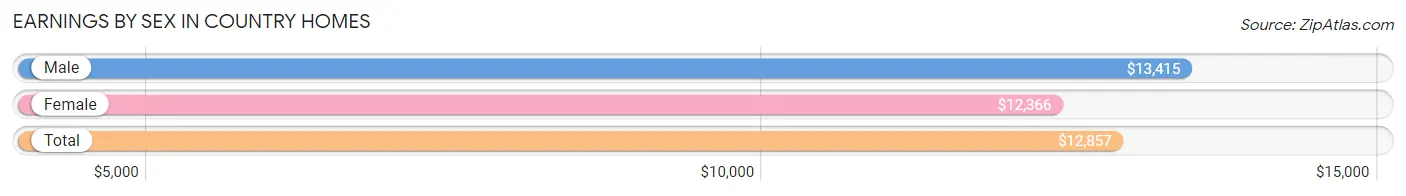
| Sex | Number | Average Earnings |
| Male | 1,692 (47.4%) | $13,415 |
| Female | 1,874 (52.5%) | $12,366 |
| Total | 3,566 (100.0%) | $12,857 |
Earnings by Sex by Income Bracket in Country Homes
The most common earnings brackets in Country Homes are $2,499 or less for men (290 | 17.1%) and $2,500 to $4,999 for women (305 | 16.3%).
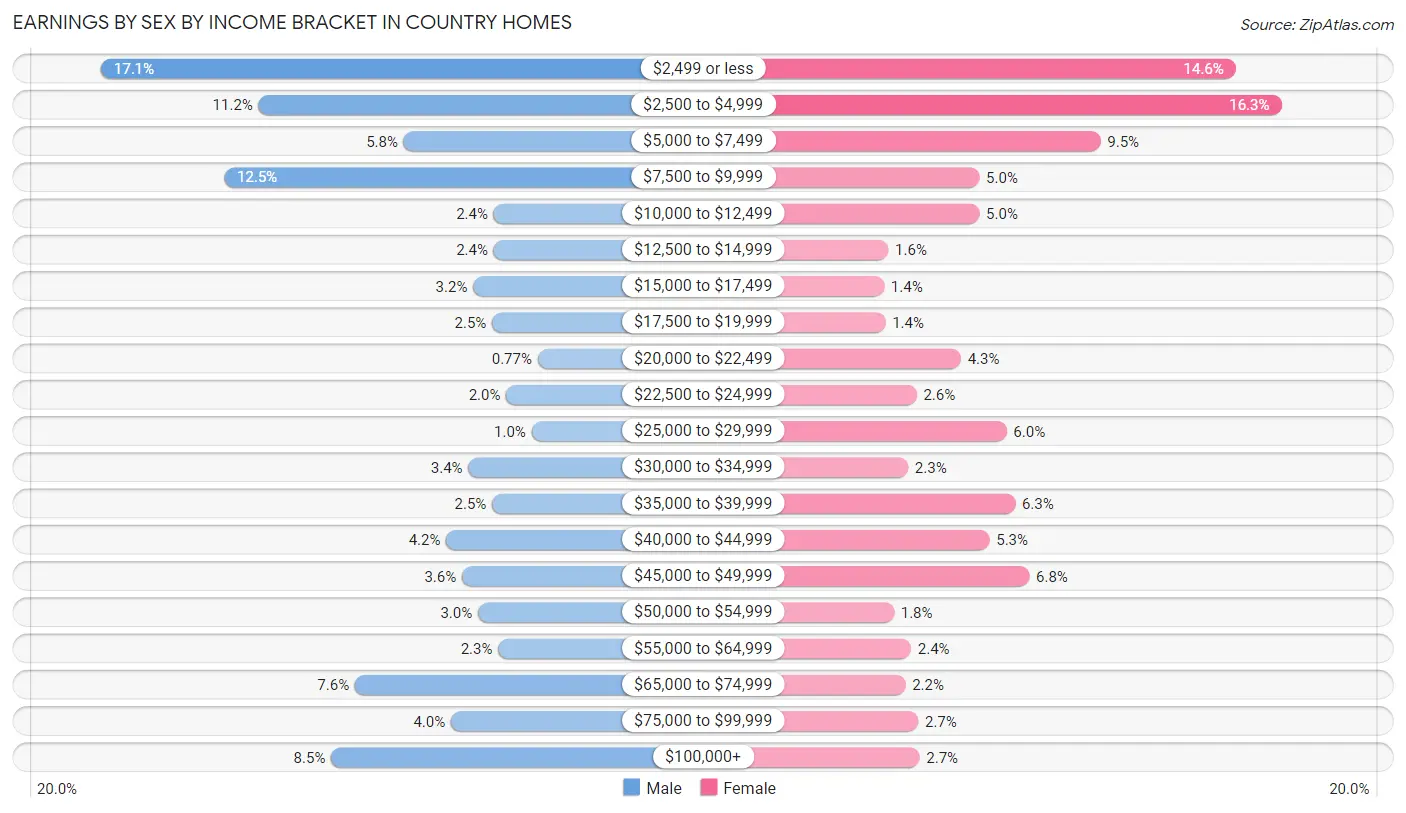
| Income | Male | Female |
| $2,499 or less | 290 (17.1%) | 273 (14.6%) |
| $2,500 to $4,999 | 190 (11.2%) | 305 (16.3%) |
| $5,000 to $7,499 | 98 (5.8%) | 178 (9.5%) |
| $7,500 to $9,999 | 212 (12.5%) | 93 (5.0%) |
| $10,000 to $12,499 | 41 (2.4%) | 93 (5.0%) |
| $12,500 to $14,999 | 41 (2.4%) | 29 (1.5%) |
| $15,000 to $17,499 | 54 (3.2%) | 26 (1.4%) |
| $17,500 to $19,999 | 42 (2.5%) | 27 (1.4%) |
| $20,000 to $22,499 | 13 (0.8%) | 80 (4.3%) |
| $22,500 to $24,999 | 33 (1.9%) | 49 (2.6%) |
| $25,000 to $29,999 | 17 (1.0%) | 112 (6.0%) |
| $30,000 to $34,999 | 57 (3.4%) | 43 (2.3%) |
| $35,000 to $39,999 | 42 (2.5%) | 118 (6.3%) |
| $40,000 to $44,999 | 71 (4.2%) | 100 (5.3%) |
| $45,000 to $49,999 | 61 (3.6%) | 128 (6.8%) |
| $50,000 to $54,999 | 51 (3.0%) | 33 (1.8%) |
| $55,000 to $64,999 | 38 (2.2%) | 45 (2.4%) |
| $65,000 to $74,999 | 129 (7.6%) | 41 (2.2%) |
| $75,000 to $99,999 | 68 (4.0%) | 50 (2.7%) |
| $100,000+ | 144 (8.5%) | 51 (2.7%) |
| Total | 1,692 (100.0%) | 1,874 (100.0%) |
Earnings by Sex by Educational Attainment in Country Homes
Average earnings in Country Homes are $49,313 for men and $38,750 for women, a difference of 21.4%. Men with an educational attainment of graduate degree enjoy the highest average annual earnings of $140,478, while those with less than high school education earn the least with $23,603. Women with an educational attainment of graduate degree earn the most with the average annual earnings of $62,500, while those with high school diploma education have the smallest earnings of $29,300.
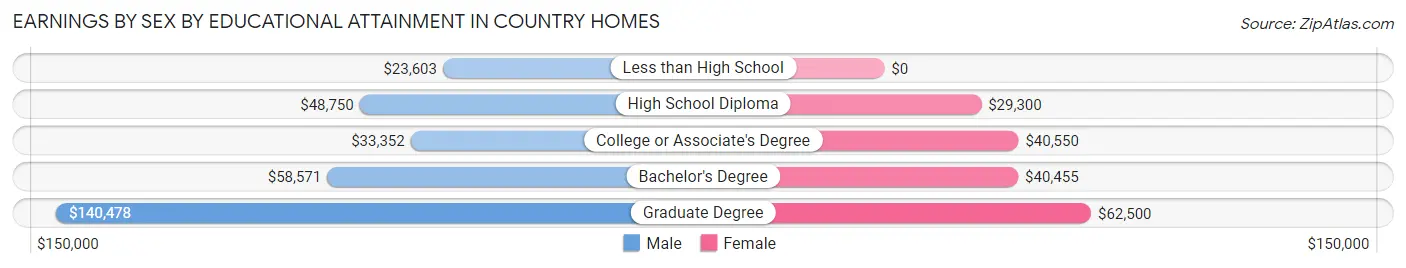
| Educational Attainment | Male Income | Female Income |
| Less than High School | $23,603 | $0 |
| High School Diploma | $48,750 | $29,300 |
| College or Associate's Degree | $33,352 | $40,550 |
| Bachelor's Degree | $58,571 | $40,455 |
| Graduate Degree | $140,478 | $62,500 |
| Total | $49,313 | $38,750 |
Family Income in Country Homes
Family Income Brackets in Country Homes
According to the Country Homes family income data, there are 307 families falling into the $75,000 to $99,999 income range, which is the most common income bracket and makes up 26.7% of all families.
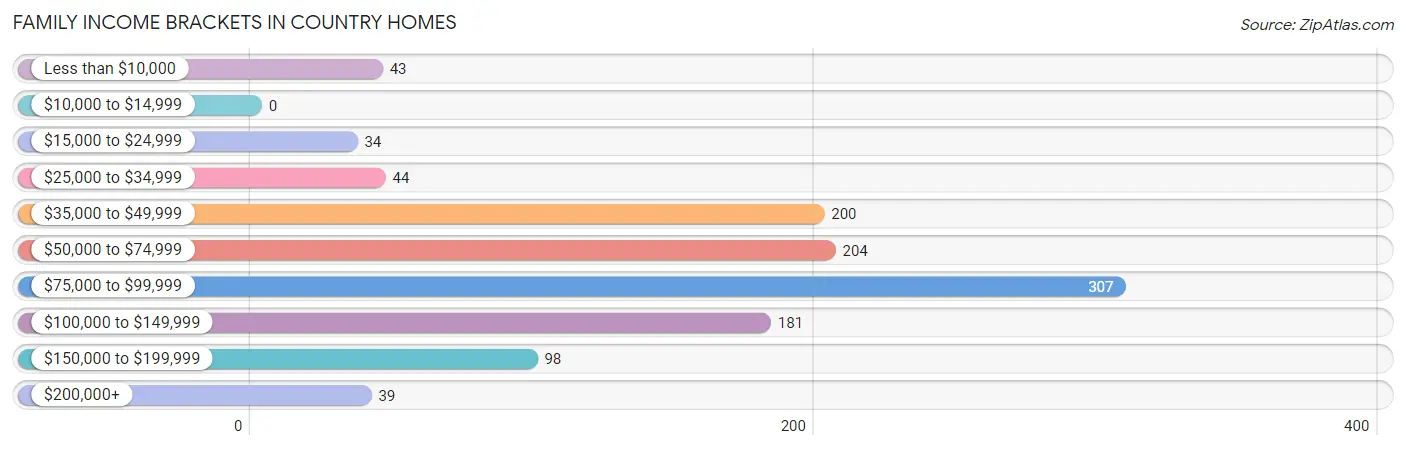
| Income Bracket | # Families | % Families |
| Less than $10,000 | 43 | 3.7% |
| $10,000 to $14,999 | 0 | 0.0% |
| $15,000 to $24,999 | 34 | 3.0% |
| $25,000 to $34,999 | 44 | 3.8% |
| $35,000 to $49,999 | 200 | 17.4% |
| $50,000 to $74,999 | 204 | 17.7% |
| $75,000 to $99,999 | 307 | 26.7% |
| $100,000 to $149,999 | 181 | 15.7% |
| $150,000 to $199,999 | 98 | 8.5% |
| $200,000+ | 39 | 3.4% |
Family Income by Famaliy Size in Country Homes
2-person families (622 | 54.1%) account for the highest median family income in Country Homes with $85,793 per family, while 2-person families (622 | 54.1%) have the highest median income of $42,896 per family member.
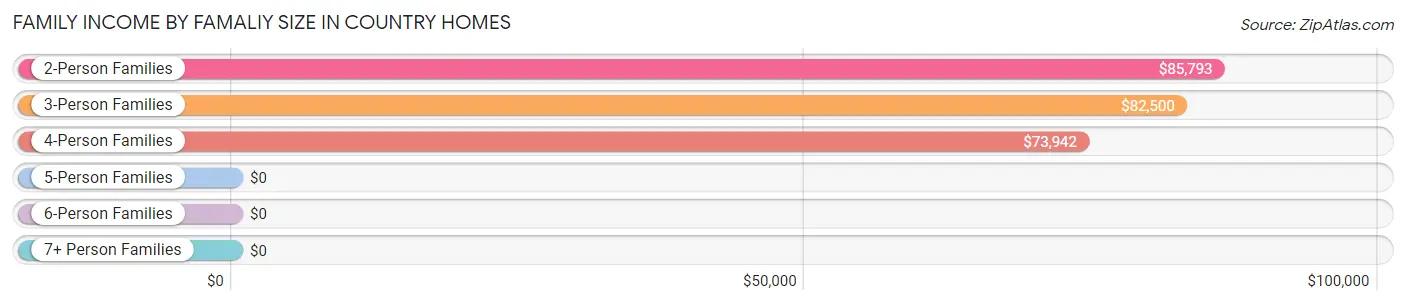
| Income Bracket | # Families | Median Income |
| 2-Person Families | 622 (54.1%) | $85,793 |
| 3-Person Families | 248 (21.6%) | $82,500 |
| 4-Person Families | 130 (11.3%) | $73,942 |
| 5-Person Families | 117 (10.2%) | $0 |
| 6-Person Families | 10 (0.9%) | $0 |
| 7+ Person Families | 23 (2.0%) | $0 |
| Total | 1,150 (100.0%) | $80,965 |
Family Income by Number of Earners in Country Homes
The median family income in Country Homes is $80,965, with families comprising 3+ earners (100) having the highest median family income of $129,000, while families with no earners (272) have the lowest median family income of $60,357, accounting for 8.7% and 23.6% of families, respectively.
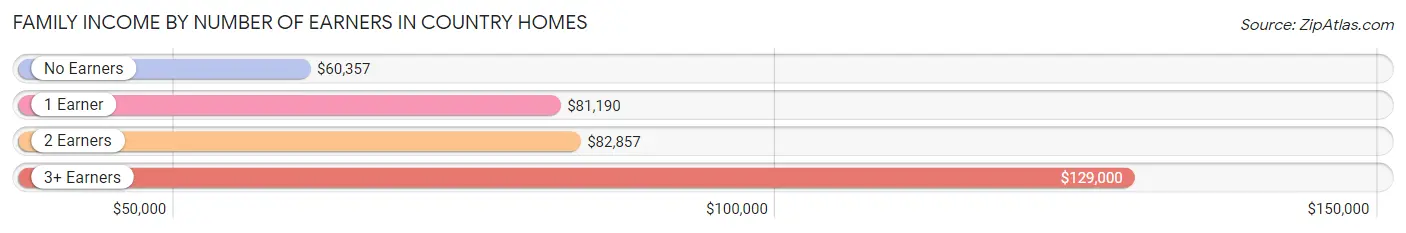
| Number of Earners | # Families | Median Income |
| No Earners | 272 (23.6%) | $60,357 |
| 1 Earner | 396 (34.4%) | $81,190 |
| 2 Earners | 382 (33.2%) | $82,857 |
| 3+ Earners | 100 (8.7%) | $129,000 |
| Total | 1,150 (100.0%) | $80,965 |
Household Income in Country Homes
Household Income Brackets in Country Homes
With 374 households falling in the category, the $75,000 to $99,999 income range is the most frequent in Country Homes, accounting for 20.5% of all households. In contrast, only 60 households (3.3%) fall into the $200,000+ income bracket, making it the least populous group.
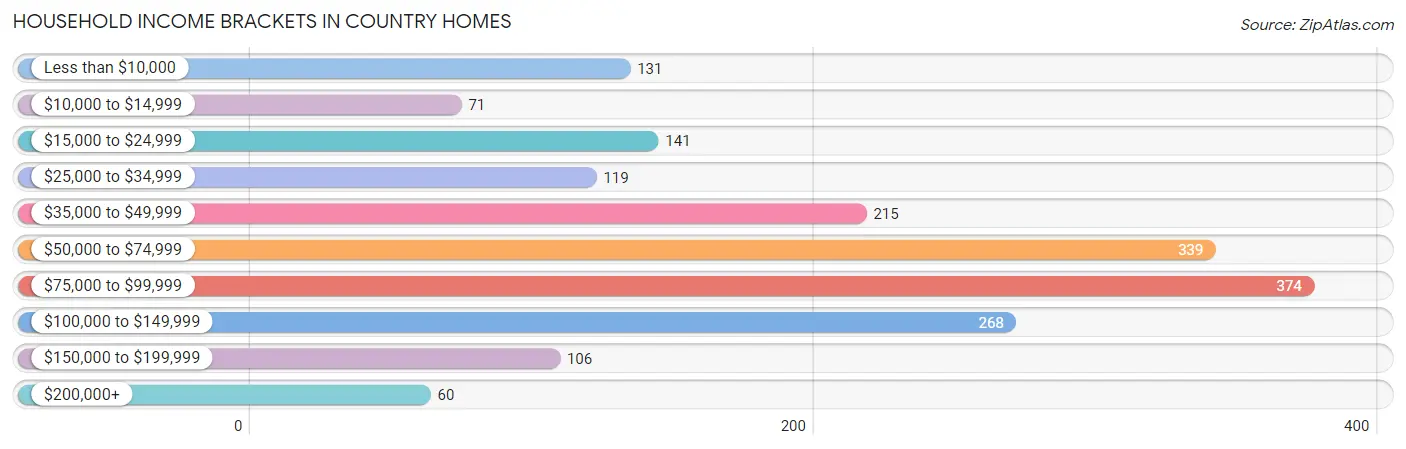
| Income Bracket | # Households | % Households |
| Less than $10,000 | 131 | 7.2% |
| $10,000 to $14,999 | 71 | 3.9% |
| $15,000 to $24,999 | 141 | 7.7% |
| $25,000 to $34,999 | 119 | 6.5% |
| $35,000 to $49,999 | 215 | 11.8% |
| $50,000 to $74,999 | 339 | 18.6% |
| $75,000 to $99,999 | 374 | 20.5% |
| $100,000 to $149,999 | 268 | 14.7% |
| $150,000 to $199,999 | 106 | 5.8% |
| $200,000+ | 60 | 3.3% |
Household Income by Householder Age in Country Homes
The median household income in Country Homes is $71,985, with the highest median household income of $85,341 found in the 45 to 64 years age bracket for the primary householder. A total of 606 households (33.2%) fall into this category. Meanwhile, the 15 to 24 years age bracket for the primary householder has the lowest median household income of $24,028, with 158 households (8.7%) in this group.
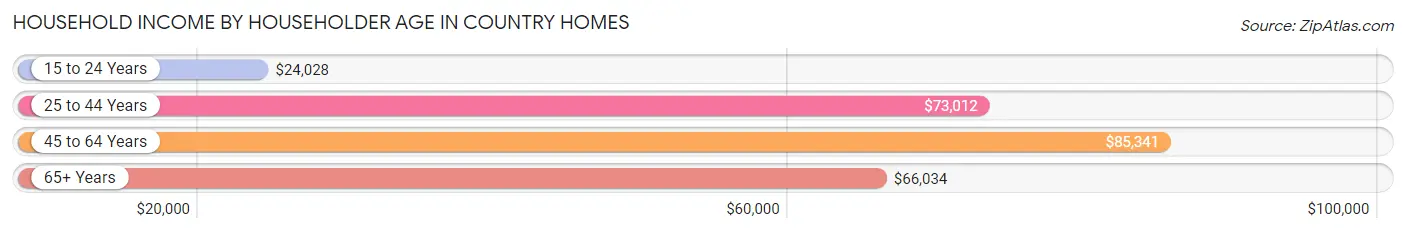
| Income Bracket | # Households | Median Income |
| 15 to 24 Years | 158 (8.7%) | $24,028 |
| 25 to 44 Years | 529 (29.0%) | $73,012 |
| 45 to 64 Years | 606 (33.2%) | $85,341 |
| 65+ Years | 532 (29.1%) | $66,034 |
| Total | 1,825 (100.0%) | $71,985 |
Poverty in Country Homes
Income Below Poverty by Sex and Age in Country Homes
With 22.1% poverty level for males and 22.6% for females among the residents of Country Homes, 18 to 24 year old males and 5 year old females are the most vulnerable to poverty, with 230 males (71.4%) and 18 females (100.0%) in their respective age groups living below the poverty level.
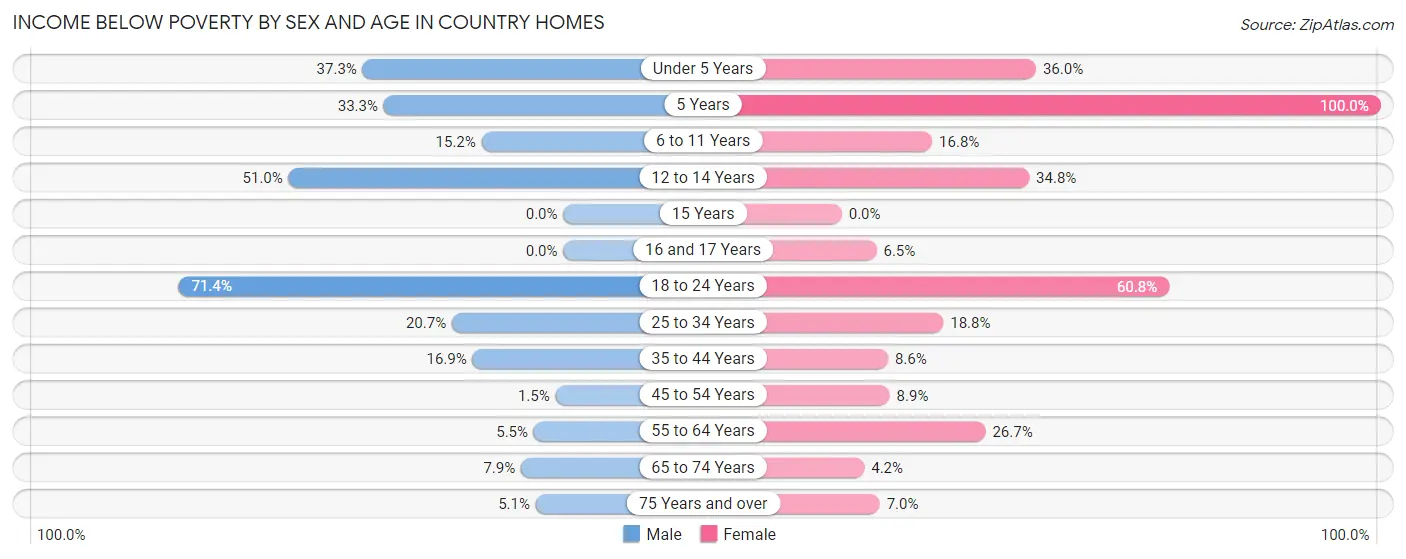
| Age Bracket | Male | Female |
| Under 5 Years | 19 (37.2%) | 40 (36.0%) |
| 5 Years | 12 (33.3%) | 18 (100.0%) |
| 6 to 11 Years | 32 (15.2%) | 26 (16.8%) |
| 12 to 14 Years | 51 (51.0%) | 24 (34.8%) |
| 15 Years | 0 (0.0%) | 0 (0.0%) |
| 16 and 17 Years | 0 (0.0%) | 8 (6.5%) |
| 18 to 24 Years | 230 (71.4%) | 260 (60.8%) |
| 25 to 34 Years | 62 (20.7%) | 55 (18.8%) |
| 35 to 44 Years | 46 (16.9%) | 24 (8.6%) |
| 45 to 54 Years | 4 (1.5%) | 30 (8.9%) |
| 55 to 64 Years | 15 (5.5%) | 92 (26.7%) |
| 65 to 74 Years | 15 (7.9%) | 9 (4.2%) |
| 75 Years and over | 7 (5.1%) | 20 (7.0%) |
| Total | 493 (22.1%) | 606 (22.6%) |
Income Above Poverty by Sex and Age in Country Homes
According to the poverty statistics in Country Homes, males aged 15 years and females aged 15 years are the age groups that are most secure financially, with 100.0% of males and 100.0% of females in these age groups living above the poverty line.
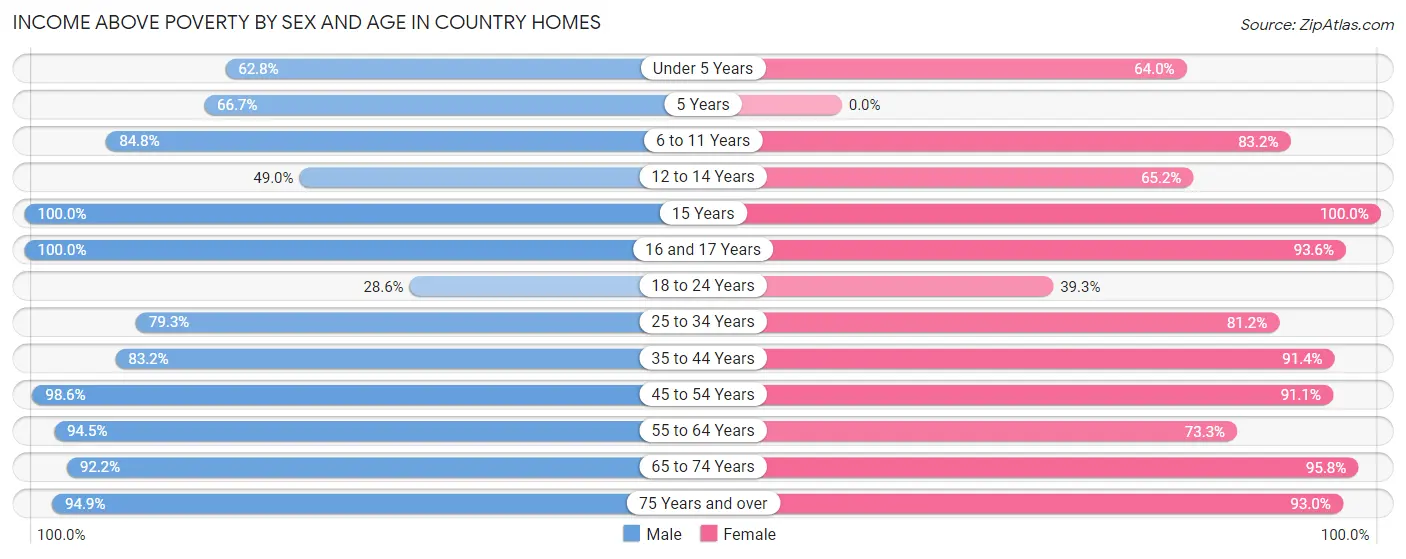
| Age Bracket | Male | Female |
| Under 5 Years | 32 (62.7%) | 71 (64.0%) |
| 5 Years | 24 (66.7%) | 0 (0.0%) |
| 6 to 11 Years | 179 (84.8%) | 129 (83.2%) |
| 12 to 14 Years | 49 (49.0%) | 45 (65.2%) |
| 15 Years | 13 (100.0%) | 19 (100.0%) |
| 16 and 17 Years | 51 (100.0%) | 116 (93.5%) |
| 18 to 24 Years | 92 (28.6%) | 168 (39.3%) |
| 25 to 34 Years | 238 (79.3%) | 237 (81.2%) |
| 35 to 44 Years | 227 (83.2%) | 256 (91.4%) |
| 45 to 54 Years | 271 (98.6%) | 308 (91.1%) |
| 55 to 64 Years | 259 (94.5%) | 253 (73.3%) |
| 65 to 74 Years | 176 (92.1%) | 207 (95.8%) |
| 75 Years and over | 130 (94.9%) | 264 (93.0%) |
| Total | 1,741 (77.9%) | 2,073 (77.4%) |
Income Below Poverty Among Married-Couple Families in Country Homes
The poverty statistics for married-couple families in Country Homes show that 1.9% or 15 of the total 800 families live below the poverty line. Families with no children have the highest poverty rate of 2.8%, comprising of 15 families. On the other hand, families with 1 or 2 children have the lowest poverty rate of 0.0%, which includes 0 families.
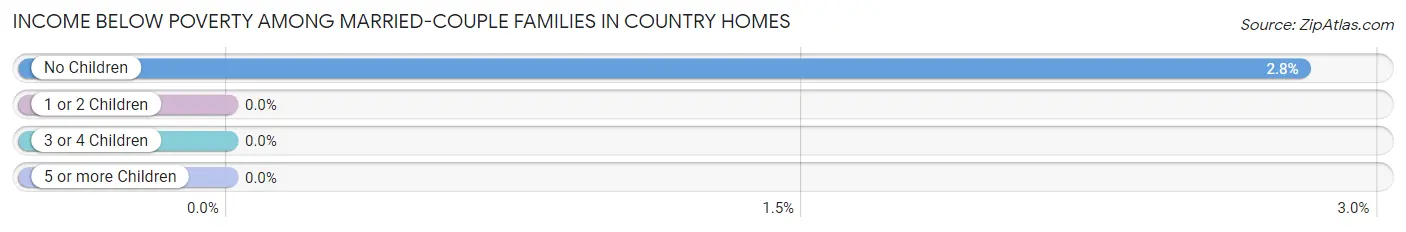
| Children | Above Poverty | Below Poverty |
| No Children | 521 (97.2%) | 15 (2.8%) |
| 1 or 2 Children | 206 (100.0%) | 0 (0.0%) |
| 3 or 4 Children | 58 (100.0%) | 0 (0.0%) |
| 5 or more Children | 0 (0.0%) | 0 (0.0%) |
| Total | 785 (98.1%) | 15 (1.9%) |
Income Below Poverty Among Single-Parent Households in Country Homes
According to the poverty data in Country Homes, 7.0% or 8 single-father households and 26.4% or 62 single-mother households are living below the poverty line. Among single-father households, those with 3 or 4 children have the highest poverty rate, with 8 households (100.0%) experiencing poverty. Likewise, among single-mother households, those with 3 or 4 children have the highest poverty rate, with 54 households (94.7%) falling below the poverty line.
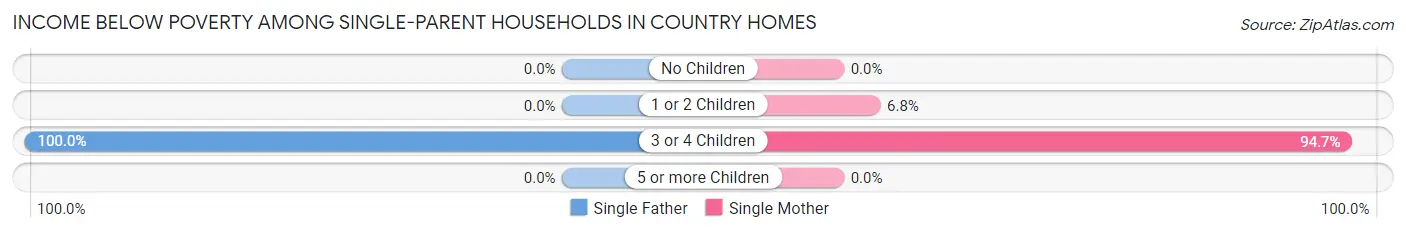
| Children | Single Father | Single Mother |
| No Children | 0 (0.0%) | 0 (0.0%) |
| 1 or 2 Children | 0 (0.0%) | 8 (6.8%) |
| 3 or 4 Children | 8 (100.0%) | 54 (94.7%) |
| 5 or more Children | 0 (0.0%) | 0 (0.0%) |
| Total | 8 (7.0%) | 62 (26.4%) |
Income Below Poverty Among Married-Couple vs Single-Parent Households in Country Homes
The poverty data for Country Homes shows that 15 of the married-couple family households (1.9%) and 70 of the single-parent households (20.0%) are living below the poverty level. Within the married-couple family households, those with no children have the highest poverty rate, with 15 households (2.8%) falling below the poverty line. Among the single-parent households, those with 3 or 4 children have the highest poverty rate, with 62 household (95.4%) living below poverty.
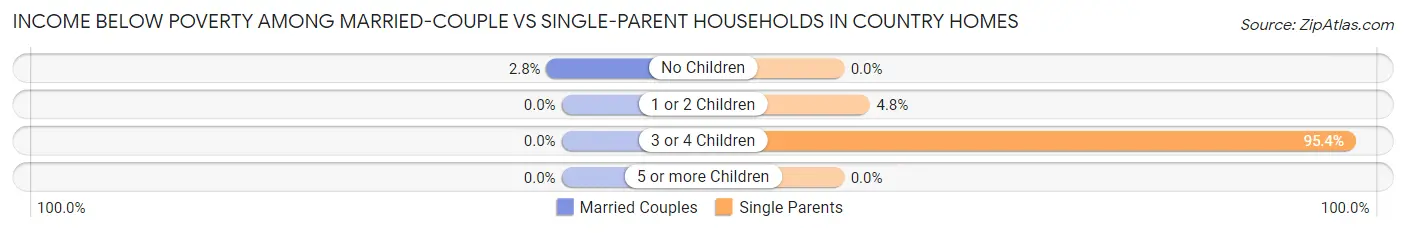
| Children | Married-Couple Families | Single-Parent Households |
| No Children | 15 (2.8%) | 0 (0.0%) |
| 1 or 2 Children | 0 (0.0%) | 8 (4.8%) |
| 3 or 4 Children | 0 (0.0%) | 62 (95.4%) |
| 5 or more Children | 0 (0.0%) | 0 (0.0%) |
| Total | 15 (1.9%) | 70 (20.0%) |
Race in Country Homes
The most populous races in Country Homes are White / Caucasian (5,024 | 80.4%), Two or more Races (659 | 10.5%), and Hispanic or Latino (465 | 7.4%).
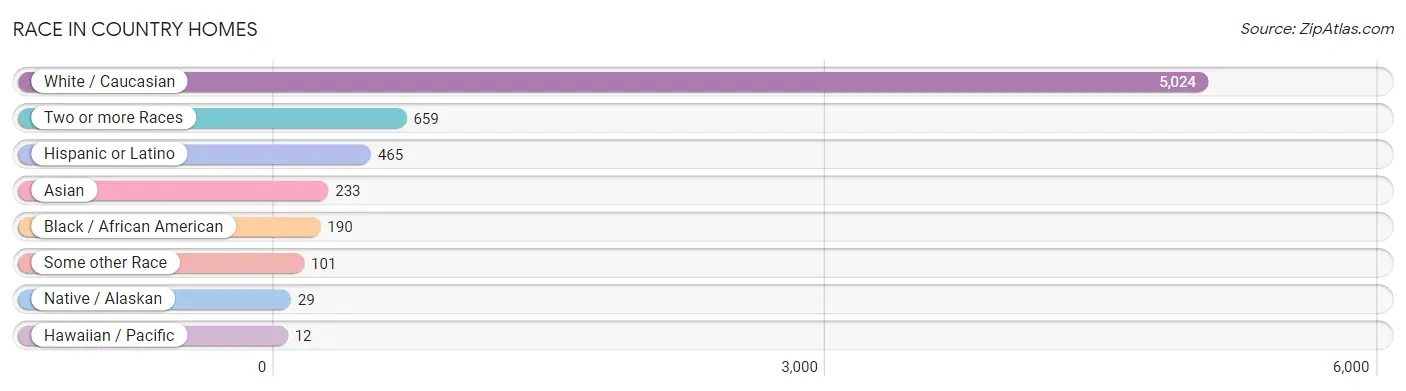
| Race | # Population | % Population |
| Asian | 233 | 3.7% |
| Black / African American | 190 | 3.0% |
| Hawaiian / Pacific | 12 | 0.2% |
| Hispanic or Latino | 465 | 7.4% |
| Native / Alaskan | 29 | 0.5% |
| White / Caucasian | 5,024 | 80.4% |
| Two or more Races | 659 | 10.5% |
| Some other Race | 101 | 1.6% |
| Total | 6,248 | 100.0% |
Ancestry in Country Homes
The most populous ancestries reported in Country Homes are German (1,565 | 25.1%), English (892 | 14.3%), Irish (891 | 14.3%), American (457 | 7.3%), and Mexican (371 | 5.9%), together accounting for 66.8% of all Country Homes residents.
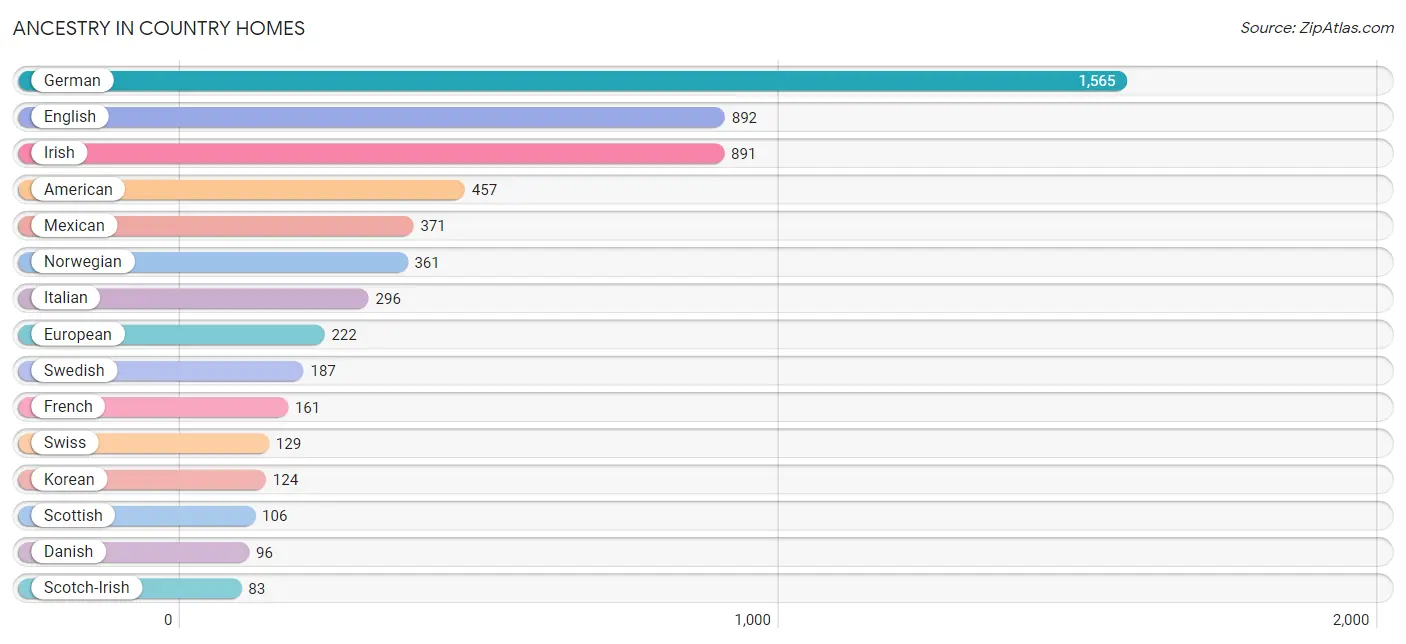
| Ancestry | # Population | % Population |
| African | 15 | 0.2% |
| Alaskan Athabascan | 16 | 0.3% |
| American | 457 | 7.3% |
| Arab | 52 | 0.8% |
| Armenian | 28 | 0.4% |
| Austrian | 65 | 1.0% |
| Basque | 5 | 0.1% |
| Bhutanese | 79 | 1.3% |
| British | 81 | 1.3% |
| Burmese | 30 | 0.5% |
| Cambodian | 4 | 0.1% |
| Canadian | 7 | 0.1% |
| Central American | 5 | 0.1% |
| Cherokee | 28 | 0.4% |
| Chippewa | 4 | 0.1% |
| Choctaw | 3 | 0.1% |
| Colville | 13 | 0.2% |
| Croatian | 12 | 0.2% |
| Cuban | 6 | 0.1% |
| Czech | 65 | 1.0% |
| Danish | 96 | 1.5% |
| Dutch | 59 | 0.9% |
| Eastern European | 19 | 0.3% |
| English | 892 | 14.3% |
| Ethiopian | 4 | 0.1% |
| European | 222 | 3.5% |
| Filipino | 6 | 0.1% |
| Finnish | 13 | 0.2% |
| French | 161 | 2.6% |
| French American Indian | 16 | 0.3% |
| German | 1,565 | 25.1% |
| Guatemalan | 5 | 0.1% |
| Hungarian | 53 | 0.9% |
| Indian (Asian) | 14 | 0.2% |
| Iranian | 6 | 0.1% |
| Irish | 891 | 14.3% |
| Italian | 296 | 4.7% |
| Korean | 124 | 2.0% |
| Laotian | 22 | 0.4% |
| Lebanese | 7 | 0.1% |
| Mexican | 371 | 5.9% |
| Native Hawaiian | 23 | 0.4% |
| Northern European | 32 | 0.5% |
| Norwegian | 361 | 5.8% |
| Peruvian | 4 | 0.1% |
| Polish | 66 | 1.1% |
| Portuguese | 34 | 0.5% |
| Puerto Rican | 9 | 0.1% |
| Romanian | 9 | 0.1% |
| Russian | 25 | 0.4% |
| Samoan | 18 | 0.3% |
| Scandinavian | 53 | 0.9% |
| Scotch-Irish | 83 | 1.3% |
| Scottish | 106 | 1.7% |
| Sioux | 7 | 0.1% |
| Slovak | 4 | 0.1% |
| South American | 4 | 0.1% |
| Spaniard | 51 | 0.8% |
| Spanish | 7 | 0.1% |
| Sri Lankan | 12 | 0.2% |
| Subsaharan African | 19 | 0.3% |
| Swedish | 187 | 3.0% |
| Swiss | 129 | 2.1% |
| Syrian | 3 | 0.1% |
| Thai | 15 | 0.2% |
| Ukrainian | 15 | 0.2% |
| Welsh | 51 | 0.8% |
| Yugoslavian | 29 | 0.5% |
| Yup'ik | 4 | 0.1% | View All 69 Rows |
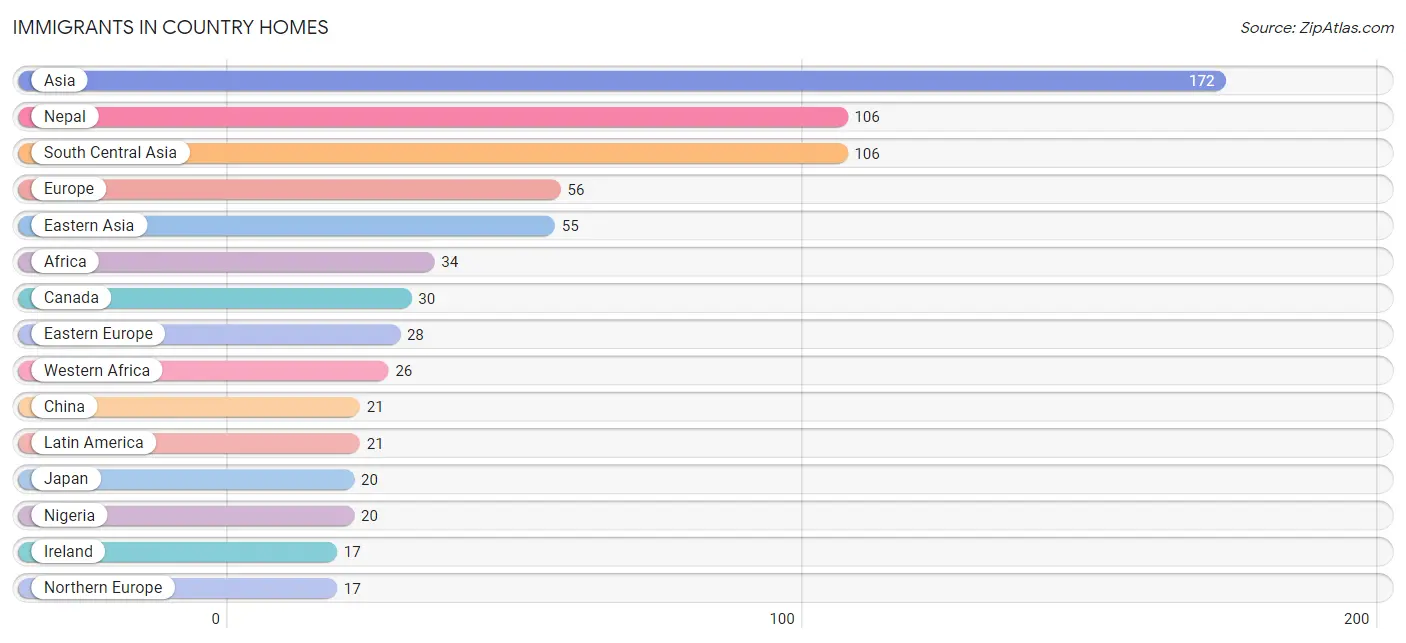
Immigrants in Country Homes
The most numerous immigrant groups reported in Country Homes came from Asia (172 | 2.8%), Nepal (106 | 1.7%), South Central Asia (106 | 1.7%), Europe (56 | 0.9%), and Eastern Asia (55 | 0.9%), together accounting for 7.9% of all Country Homes residents.
| Immigration Origin | # Population | % Population |
| Africa | 34 | 0.5% |
| Asia | 172 | 2.8% |
| Bosnia and Herzegovina | 14 | 0.2% |
| Brazil | 10 | 0.2% |
| Canada | 30 | 0.5% |
| Central America | 11 | 0.2% |
| China | 21 | 0.3% |
| Eastern Africa | 8 | 0.1% |
| Eastern Asia | 55 | 0.9% |
| Eastern Europe | 28 | 0.4% |
| Ethiopia | 8 | 0.1% |
| Europe | 56 | 0.9% |
| Ghana | 6 | 0.1% |
| Guatemala | 5 | 0.1% |
| Indonesia | 8 | 0.1% |
| Ireland | 17 | 0.3% |
| Japan | 20 | 0.3% |
| Korea | 10 | 0.2% |
| Latin America | 21 | 0.3% |
| Mexico | 6 | 0.1% |
| Nepal | 106 | 1.7% |
| Nigeria | 20 | 0.3% |
| Northern Europe | 17 | 0.3% |
| Philippines | 3 | 0.1% |
| Russia | 2 | 0.0% |
| South America | 10 | 0.2% |
| South Central Asia | 106 | 1.7% |
| South Eastern Asia | 11 | 0.2% |
| Southern Europe | 11 | 0.2% |
| Spain | 11 | 0.2% |
| Taiwan | 15 | 0.2% |
| Ukraine | 12 | 0.2% |
| Western Africa | 26 | 0.4% | View All 33 Rows |
Sex and Age in Country Homes
Sex and Age in Country Homes
The most populous age groups in Country Homes are 15 to 19 Years (621 | 21.2%) for men and 15 to 19 Years (660 | 19.9%) for women.
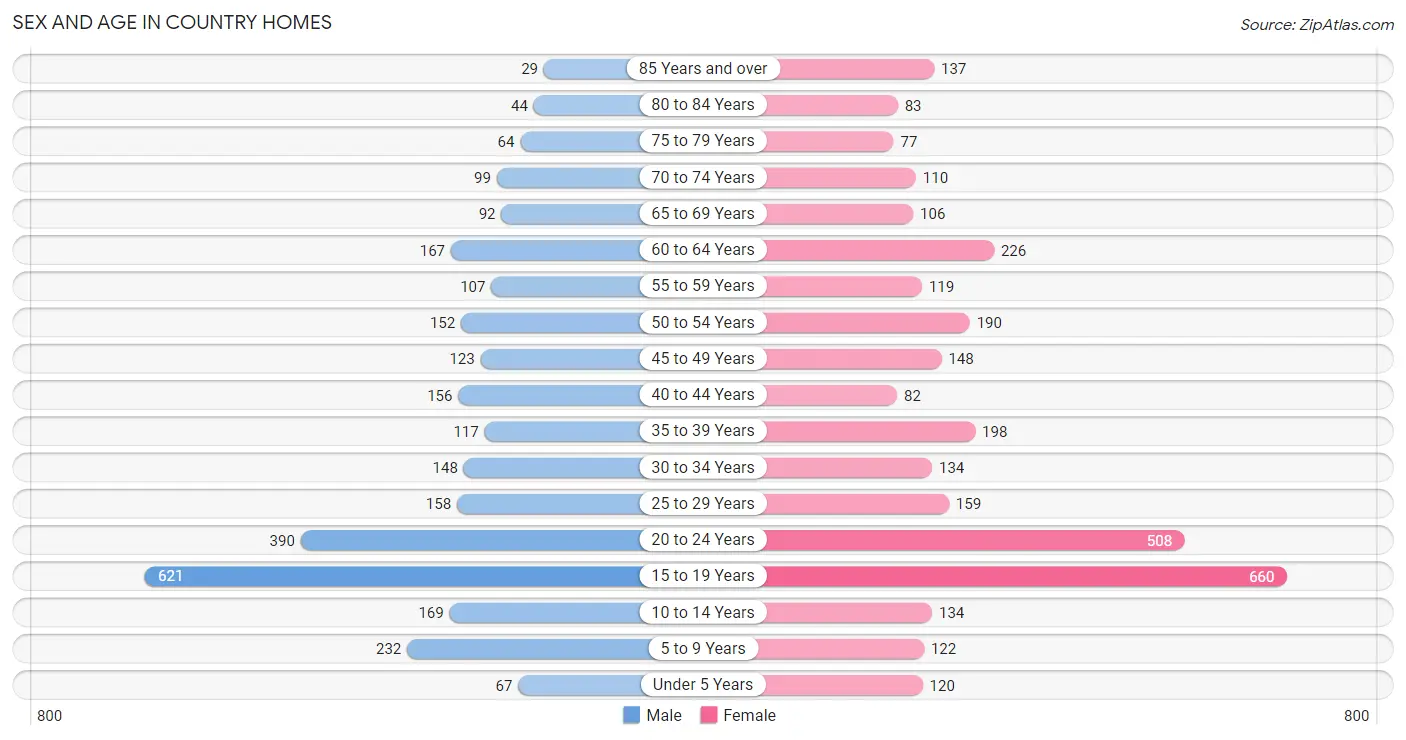
| Age Bracket | Male | Female |
| Under 5 Years | 67 (2.3%) | 120 (3.6%) |
| 5 to 9 Years | 232 (7.9%) | 122 (3.7%) |
| 10 to 14 Years | 169 (5.8%) | 134 (4.0%) |
| 15 to 19 Years | 621 (21.2%) | 660 (19.9%) |
| 20 to 24 Years | 390 (13.3%) | 508 (15.3%) |
| 25 to 29 Years | 158 (5.4%) | 159 (4.8%) |
| 30 to 34 Years | 148 (5.0%) | 134 (4.0%) |
| 35 to 39 Years | 117 (4.0%) | 198 (6.0%) |
| 40 to 44 Years | 156 (5.3%) | 82 (2.5%) |
| 45 to 49 Years | 123 (4.2%) | 148 (4.5%) |
| 50 to 54 Years | 152 (5.2%) | 190 (5.7%) |
| 55 to 59 Years | 107 (3.6%) | 119 (3.6%) |
| 60 to 64 Years | 167 (5.7%) | 226 (6.8%) |
| 65 to 69 Years | 92 (3.1%) | 106 (3.2%) |
| 70 to 74 Years | 99 (3.4%) | 110 (3.3%) |
| 75 to 79 Years | 64 (2.2%) | 77 (2.3%) |
| 80 to 84 Years | 44 (1.5%) | 83 (2.5%) |
| 85 Years and over | 29 (1.0%) | 137 (4.1%) |
| Total | 2,935 (100.0%) | 3,313 (100.0%) |
Families and Households in Country Homes
Median Family Size in Country Homes
The median family size in Country Homes is 2.95 persons per family, with single female/mother families (235 | 20.4%) accounting for the largest median family size of 3.27 persons per family. On the other hand, single male/father families (115 | 10.0%) represent the smallest median family size with 2.63 persons per family.
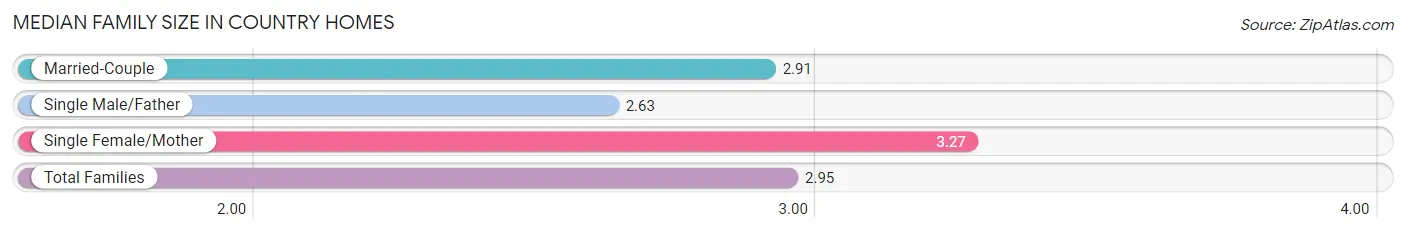
| Family Type | # Families | Family Size |
| Married-Couple | 800 (69.6%) | 2.91 |
| Single Male/Father | 115 (10.0%) | 2.63 |
| Single Female/Mother | 235 (20.4%) | 3.27 |
| Total Families | 1,150 (100.0%) | 2.95 |
Median Household Size in Country Homes
The median household size in Country Homes is 2.72 persons per household, with single female/mother households (235 | 12.9%) accounting for the largest median household size of 3.71 persons per household. non-family households (675 | 37.0%) represent the smallest median household size with 1.89 persons per household.
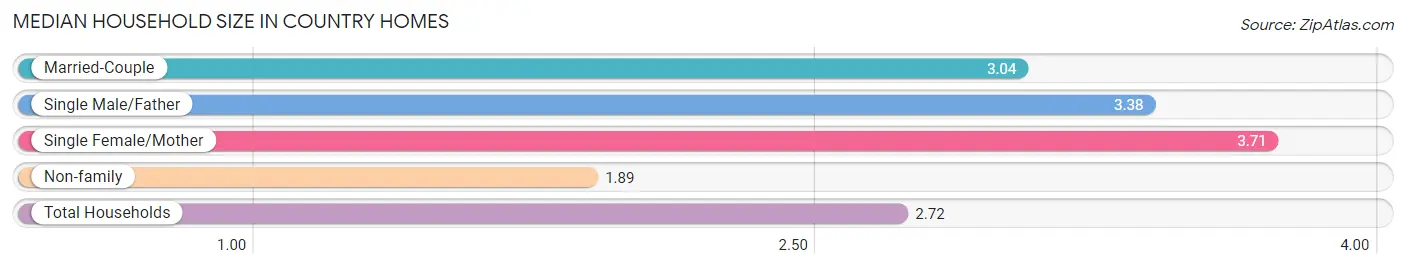
| Household Type | # Households | Household Size |
| Married-Couple | 800 (43.8%) | 3.04 |
| Single Male/Father | 115 (6.3%) | 3.38 |
| Single Female/Mother | 235 (12.9%) | 3.71 |
| Non-family | 675 (37.0%) | 1.89 |
| Total Households | 1,825 (100.0%) | 2.72 |
Household Size by Marriage Status in Country Homes
Out of a total of 1,825 households in Country Homes, 1,150 (63.0%) are family households, while 675 (37.0%) are nonfamily households. The most numerous type of family households are 2-person households, comprising 569, and the most common type of nonfamily households are 1-person households, comprising 436.
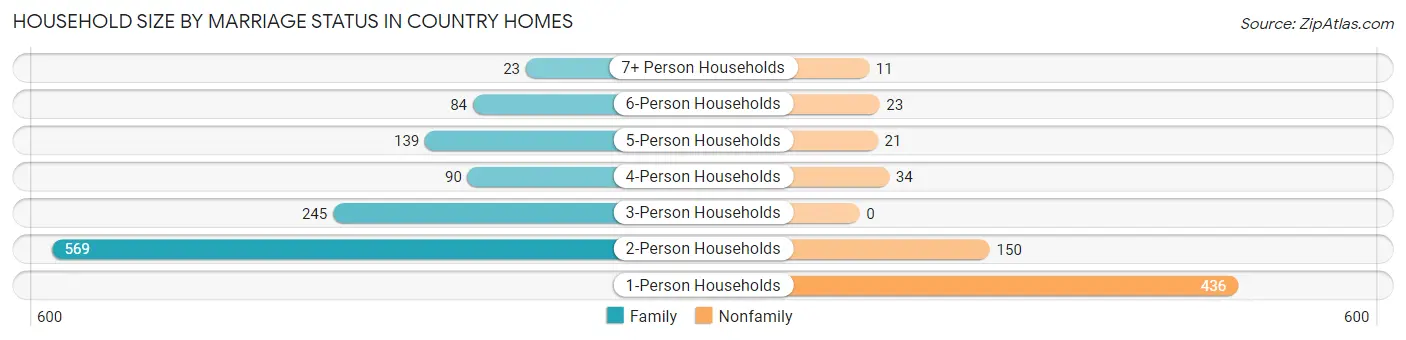
| Household Size | Family Households | Nonfamily Households |
| 1-Person Households | - | 436 (23.9%) |
| 2-Person Households | 569 (31.2%) | 150 (8.2%) |
| 3-Person Households | 245 (13.4%) | 0 (0.0%) |
| 4-Person Households | 90 (4.9%) | 34 (1.9%) |
| 5-Person Households | 139 (7.6%) | 21 (1.1%) |
| 6-Person Households | 84 (4.6%) | 23 (1.3%) |
| 7+ Person Households | 23 (1.3%) | 11 (0.6%) |
| Total | 1,150 (63.0%) | 675 (37.0%) |
Female Fertility in Country Homes
Fertility by Age in Country Homes
Average fertility rate in Country Homes is 22.0 births per 1,000 women. Women in the age bracket of 35 to 50 years have the highest fertility rate with 60.0 births per 1,000 women. Women in the age bracket of 35 to 50 years acount for 61.9% of all women with births.
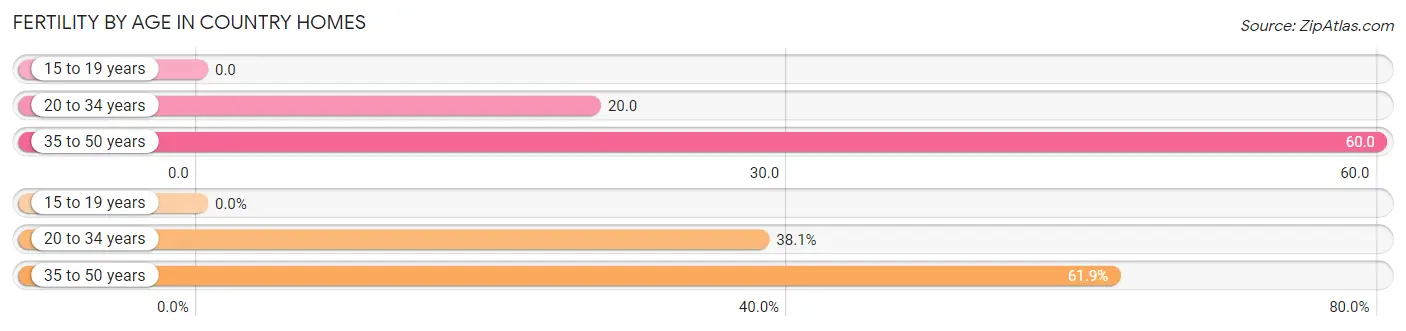
| Age Bracket | Women with Births | Births / 1,000 Women |
| 15 to 19 years | 0 (0.0%) | 0.0 |
| 20 to 34 years | 16 (38.1%) | 20.0 |
| 35 to 50 years | 26 (61.9%) | 60.0 |
| Total | 42 (100.0%) | 22.0 |
Fertility by Age by Marriage Status in Country Homes
31.0% of women with births (42) in Country Homes are married. The highest percentage of unmarried women with births falls into 20 to 34 years age bracket with 75.0% of them unmarried at the time of birth, while the lowest percentage of unmarried women with births belong to 35 to 50 years age bracket with 65.4% of them unmarried.
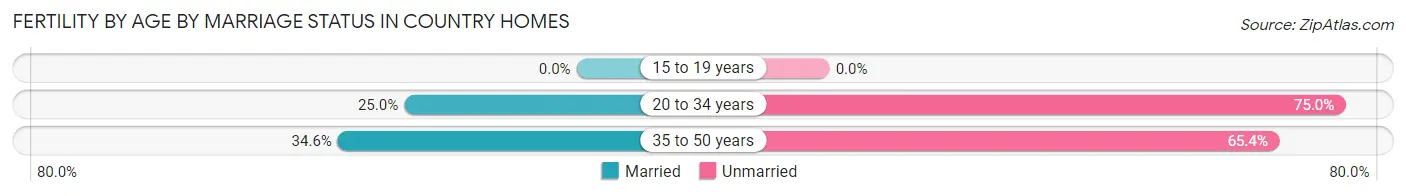
| Age Bracket | Married | Unmarried |
| 15 to 19 years | 0 (0.0%) | 0 (0.0%) |
| 20 to 34 years | 4 (25.0%) | 12 (75.0%) |
| 35 to 50 years | 9 (34.6%) | 17 (65.4%) |
| Total | 13 (30.9%) | 29 (69.1%) |
Fertility by Education in Country Homes
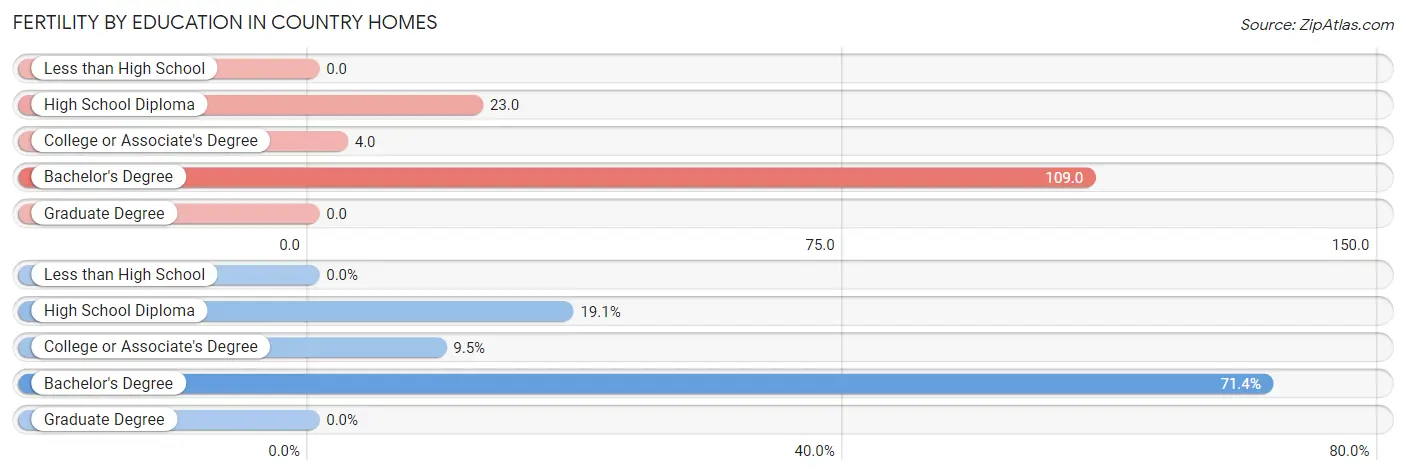
| Educational Attainment | Women with Births | Births / 1,000 Women |
| Less than High School | 0 (0.0%) | 0.0 |
| High School Diploma | 8 (19.1%) | 23.0 |
| College or Associate's Degree | 4 (9.5%) | 4.0 |
| Bachelor's Degree | 30 (71.4%) | 109.0 |
| Graduate Degree | 0 (0.0%) | 0.0 |
| Total | 42 (100.0%) | 22.0 |
Fertility by Education by Marriage Status in Country Homes
69.1% of women with births in Country Homes are unmarried. Women with the educational attainment of bachelor's degree are most likely to be married with 43.3% of them married at childbirth, while women with the educational attainment of high school diploma are least likely to be married with 100.0% of them unmarried at childbirth.
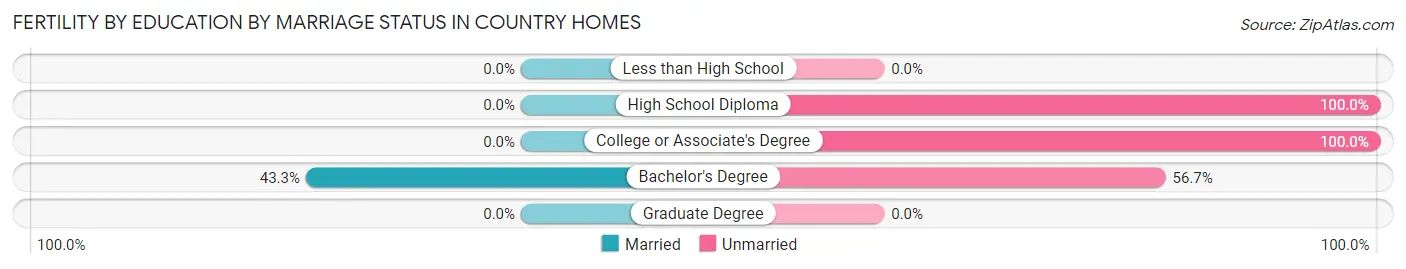
| Educational Attainment | Married | Unmarried |
| Less than High School | 0 (0.0%) | 0 (0.0%) |
| High School Diploma | 0 (0.0%) | 8 (100.0%) |
| College or Associate's Degree | 0 (0.0%) | 4 (100.0%) |
| Bachelor's Degree | 13 (43.3%) | 17 (56.7%) |
| Graduate Degree | 0 (0.0%) | 0 (0.0%) |
| Total | 13 (30.9%) | 29 (69.1%) |
Employment Characteristics in Country Homes
Employment by Class of Employer in Country Homes
Among the 2,316 employed individuals in Country Homes, private company employees (1,364 | 58.9%), not-for-profit organizations (412 | 17.8%), and self-employed (not incorporated) (171 | 7.4%) make up the most common classes of employment.
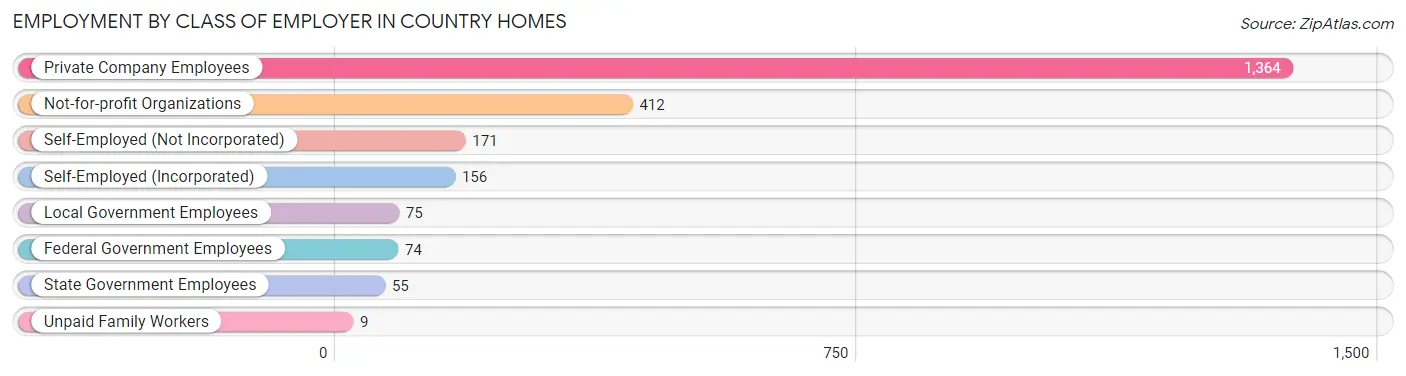
| Employer Class | # Employees | % Employees |
| Private Company Employees | 1,364 | 58.9% |
| Self-Employed (Incorporated) | 156 | 6.7% |
| Self-Employed (Not Incorporated) | 171 | 7.4% |
| Not-for-profit Organizations | 412 | 17.8% |
| Local Government Employees | 75 | 3.2% |
| State Government Employees | 55 | 2.4% |
| Federal Government Employees | 74 | 3.2% |
| Unpaid Family Workers | 9 | 0.4% |
| Total | 2,316 | 100.0% |
Employment Status by Age in Country Homes
According to the labor force statistics for Country Homes, out of the total population over 16 years of age (5,372), 51.2% or 2,750 individuals are in the labor force, with 9.7% or 267 of them unemployed. The age group with the highest labor force participation rate is 55 to 59 years, with 79.2% or 179 individuals in the labor force. Within the labor force, the 16 to 19 years age range has the highest percentage of unemployed individuals, with 20.7% or 100 of them being unemployed.
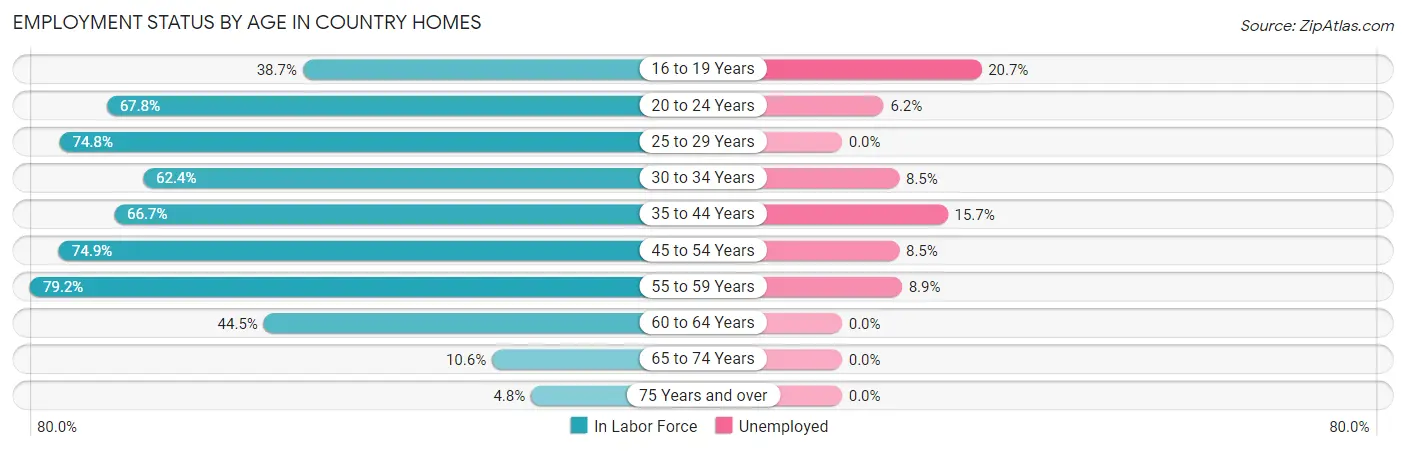
| Age Bracket | In Labor Force | Unemployed |
| 16 to 19 Years | 483 (38.7%) | 100 (20.7%) |
| 20 to 24 Years | 609 (67.8%) | 38 (6.2%) |
| 25 to 29 Years | 237 (74.8%) | 0 (0.0%) |
| 30 to 34 Years | 176 (62.4%) | 15 (8.5%) |
| 35 to 44 Years | 369 (66.7%) | 58 (15.7%) |
| 45 to 54 Years | 459 (74.9%) | 39 (8.5%) |
| 55 to 59 Years | 179 (79.2%) | 16 (8.9%) |
| 60 to 64 Years | 175 (44.5%) | 0 (0.0%) |
| 65 to 74 Years | 43 (10.6%) | 0 (0.0%) |
| 75 Years and over | 21 (4.8%) | 0 (0.0%) |
| Total | 2,750 (51.2%) | 267 (9.7%) |
Employment Status by Educational Attainment in Country Homes
According to labor force statistics for Country Homes, 66.9% of individuals (1,595) out of the total population between 25 and 64 years of age (2,384) are in the labor force, with 8.0% or 128 of them being unemployed. The group with the highest labor force participation rate are those with the educational attainment of bachelor's degree or higher, with 80.0% or 591 individuals in the labor force. Within the labor force, individuals with college / associate degree education have the highest percentage of unemployment, with 12.6% or 74 of them being unemployed.
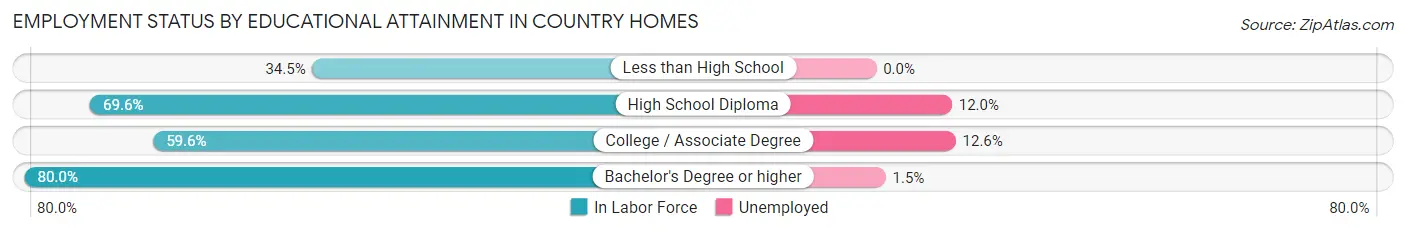
| Educational Attainment | In Labor Force | Unemployed |
| Less than High School | 41 (34.5%) | 0 (0.0%) |
| High School Diploma | 374 (69.6%) | 64 (12.0%) |
| College / Associate Degree | 589 (59.6%) | 125 (12.6%) |
| Bachelor's Degree or higher | 591 (80.0%) | 11 (1.5%) |
| Total | 1,595 (66.9%) | 191 (8.0%) |
Employment Occupations by Sex in Country Homes
Management, Business, Science and Arts Occupations
The most common Management, Business, Science and Arts occupations in Country Homes are Management (323 | 13.0%), Community & Social Service (278 | 11.2%), Education Instruction & Library (137 | 5.5%), Health Diagnosing & Treating (115 | 4.6%), and Business & Financial (68 | 2.7%).
Management, Business, Science and Arts Occupations by Sex
Within the Management, Business, Science and Arts occupations in Country Homes, the most male-oriented occupations are Computers & Mathematics (81.8%), Arts, Media & Entertainment (64.5%), and Computers, Engineering & Science (63.5%), while the most female-oriented occupations are Health Technologists (100.0%), Health Diagnosing & Treating (78.3%), and Education Instruction & Library (71.5%).
| Occupation | Male | Female |
| Management | 199 (61.6%) | 124 (38.4%) |
| Business & Financial | 26 (38.2%) | 42 (61.8%) |
| Computers, Engineering & Science | 40 (63.5%) | 23 (36.5%) |
| Computers & Mathematics | 27 (81.8%) | 6 (18.2%) |
| Architecture & Engineering | 13 (43.3%) | 17 (56.7%) |
| Life, Physical & Social Science | 0 (0.0%) | 0 (0.0%) |
| Community & Social Service | 114 (41.0%) | 164 (59.0%) |
| Education, Arts & Media | 29 (46.8%) | 33 (53.2%) |
| Legal Services & Support | 6 (35.3%) | 11 (64.7%) |
| Education Instruction & Library | 39 (28.5%) | 98 (71.5%) |
| Arts, Media & Entertainment | 40 (64.5%) | 22 (35.5%) |
| Health Diagnosing & Treating | 25 (21.7%) | 90 (78.3%) |
| Health Technologists | 0 (0.0%) | 68 (100.0%) |
| Total (Category) | 404 (47.7%) | 443 (52.3%) |
| Total (Overall) | 1,097 (44.1%) | 1,388 (55.9%) |
Services Occupations
The most common Services occupations in Country Homes are Food Preparation & Serving (245 | 9.9%), Personal Care & Service (138 | 5.6%), Healthcare Support (109 | 4.4%), Cleaning & Maintenance (82 | 3.3%), and Security & Protection (16 | 0.6%).
Services Occupations by Sex
Within the Services occupations in Country Homes, the most male-oriented occupations are Cleaning & Maintenance (100.0%), Security & Protection (31.2%), and Firefighting & Prevention (31.2%), while the most female-oriented occupations are Healthcare Support (93.6%), Personal Care & Service (89.1%), and Food Preparation & Serving (70.2%).
| Occupation | Male | Female |
| Healthcare Support | 7 (6.4%) | 102 (93.6%) |
| Security & Protection | 5 (31.2%) | 11 (68.8%) |
| Firefighting & Prevention | 5 (31.2%) | 11 (68.8%) |
| Law Enforcement | 0 (0.0%) | 0 (0.0%) |
| Food Preparation & Serving | 73 (29.8%) | 172 (70.2%) |
| Cleaning & Maintenance | 82 (100.0%) | 0 (0.0%) |
| Personal Care & Service | 15 (10.9%) | 123 (89.1%) |
| Total (Category) | 182 (30.8%) | 408 (69.2%) |
| Total (Overall) | 1,097 (44.1%) | 1,388 (55.9%) |
Sales and Office Occupations
The most common Sales and Office occupations in Country Homes are Sales & Related (328 | 13.2%), and Office & Administration (316 | 12.7%).

Sales and Office Occupations by Sex
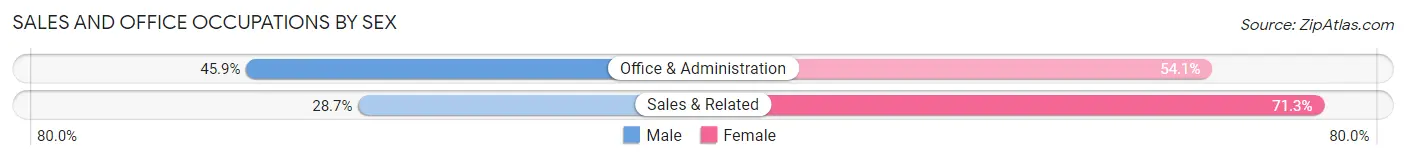
| Occupation | Male | Female |
| Sales & Related | 94 (28.7%) | 234 (71.3%) |
| Office & Administration | 145 (45.9%) | 171 (54.1%) |
| Total (Category) | 239 (37.1%) | 405 (62.9%) |
| Total (Overall) | 1,097 (44.1%) | 1,388 (55.9%) |
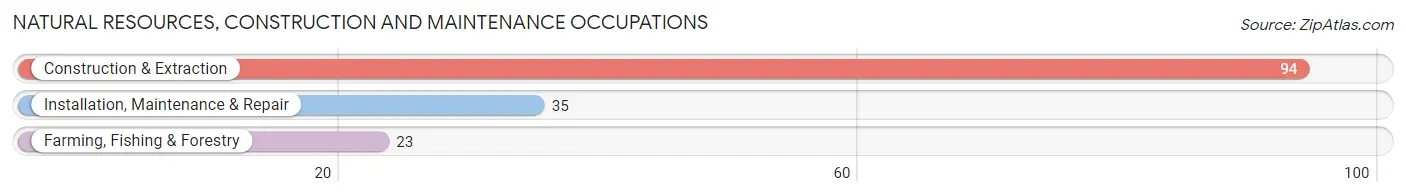
Natural Resources, Construction and Maintenance Occupations
The most common Natural Resources, Construction and Maintenance occupations in Country Homes are Construction & Extraction (94 | 3.8%), Installation, Maintenance & Repair (35 | 1.4%), and Farming, Fishing & Forestry (23 | 0.9%).
Natural Resources, Construction and Maintenance Occupations by Sex
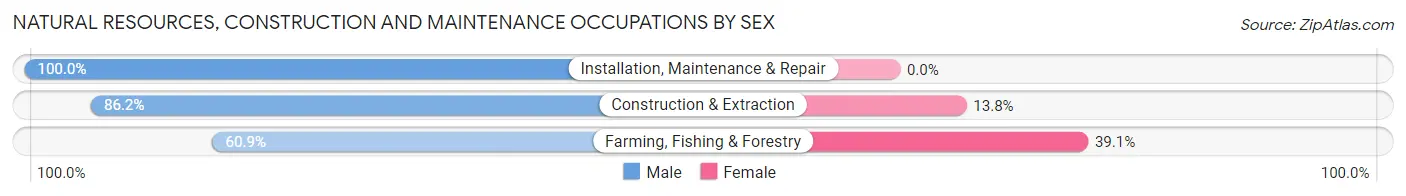
| Occupation | Male | Female |
| Farming, Fishing & Forestry | 14 (60.9%) | 9 (39.1%) |
| Construction & Extraction | 81 (86.2%) | 13 (13.8%) |
| Installation, Maintenance & Repair | 35 (100.0%) | 0 (0.0%) |
| Total (Category) | 130 (85.5%) | 22 (14.5%) |
| Total (Overall) | 1,097 (44.1%) | 1,388 (55.9%) |
Production, Transportation and Moving Occupations
The most common Production, Transportation and Moving occupations in Country Homes are Material Moving (127 | 5.1%), Production (72 | 2.9%), and Transportation (53 | 2.1%).
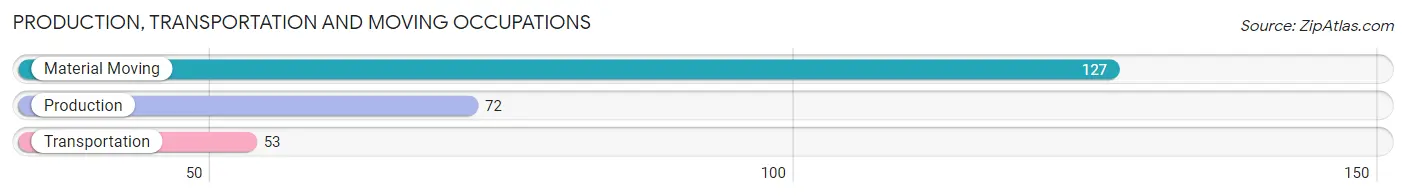
Production, Transportation and Moving Occupations by Sex
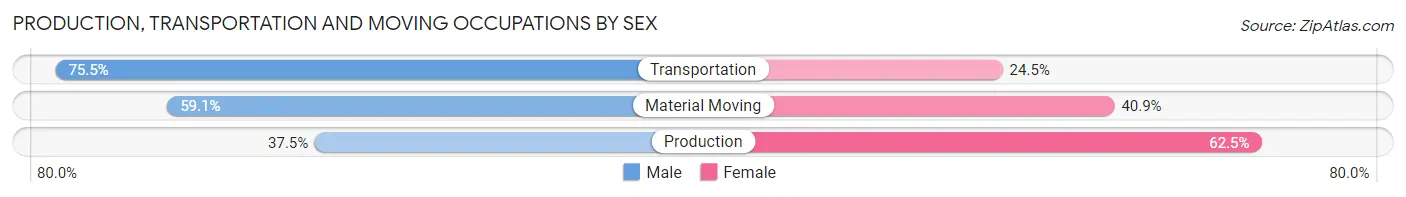
| Occupation | Male | Female |
| Production | 27 (37.5%) | 45 (62.5%) |
| Transportation | 40 (75.5%) | 13 (24.5%) |
| Material Moving | 75 (59.1%) | 52 (40.9%) |
| Total (Category) | 142 (56.4%) | 110 (43.6%) |
| Total (Overall) | 1,097 (44.1%) | 1,388 (55.9%) |
Employment Industries by Sex in Country Homes
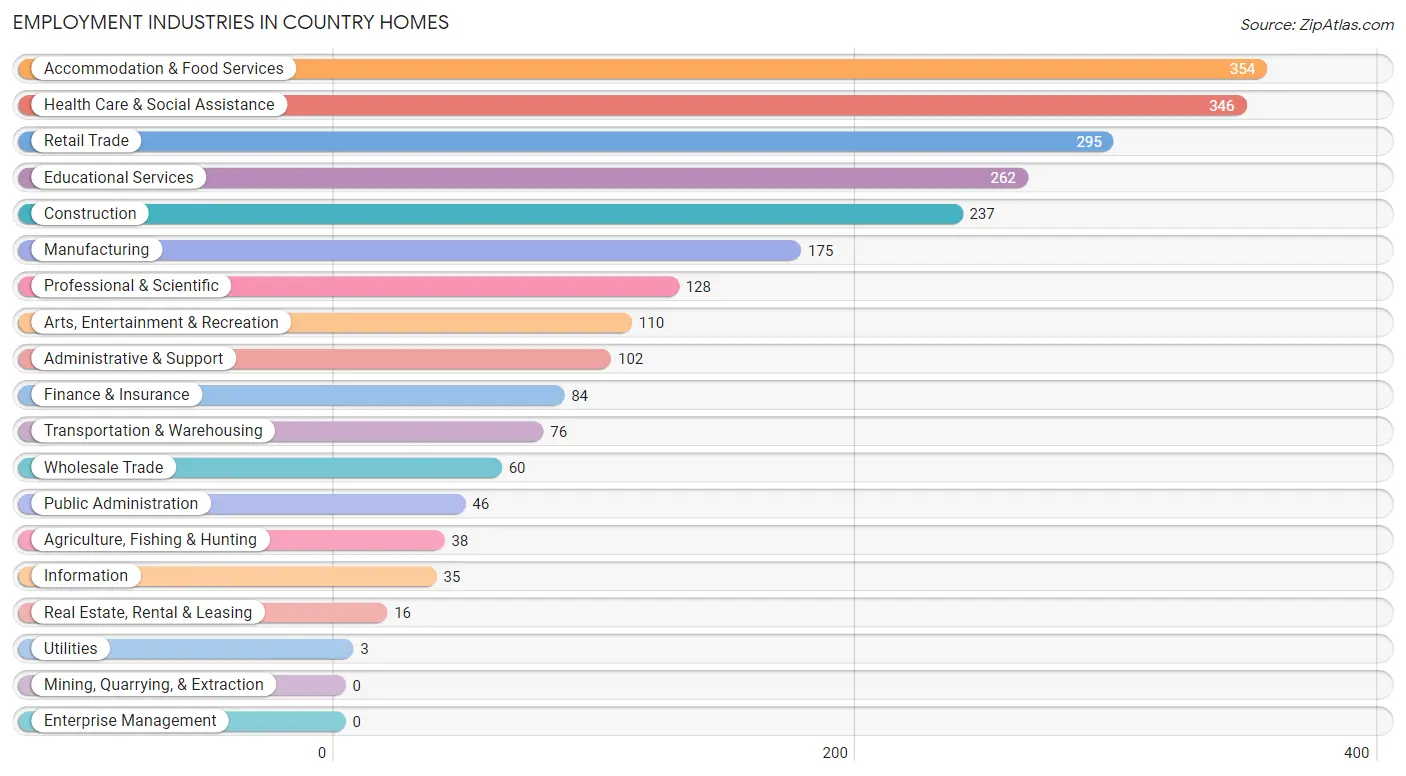
Employment Industries in Country Homes
The major employment industries in Country Homes include Accommodation & Food Services (354 | 14.2%), Health Care & Social Assistance (346 | 13.9%), Retail Trade (295 | 11.9%), Educational Services (262 | 10.5%), and Construction (237 | 9.5%).
Employment Industries by Sex in Country Homes
The Country Homes industries that see more men than women are Construction (87.3%), Transportation & Warehousing (82.9%), and Finance & Insurance (82.1%), whereas the industries that tend to have a higher number of women are Utilities (100.0%), Health Care & Social Assistance (78.6%), and Accommodation & Food Services (78.0%).
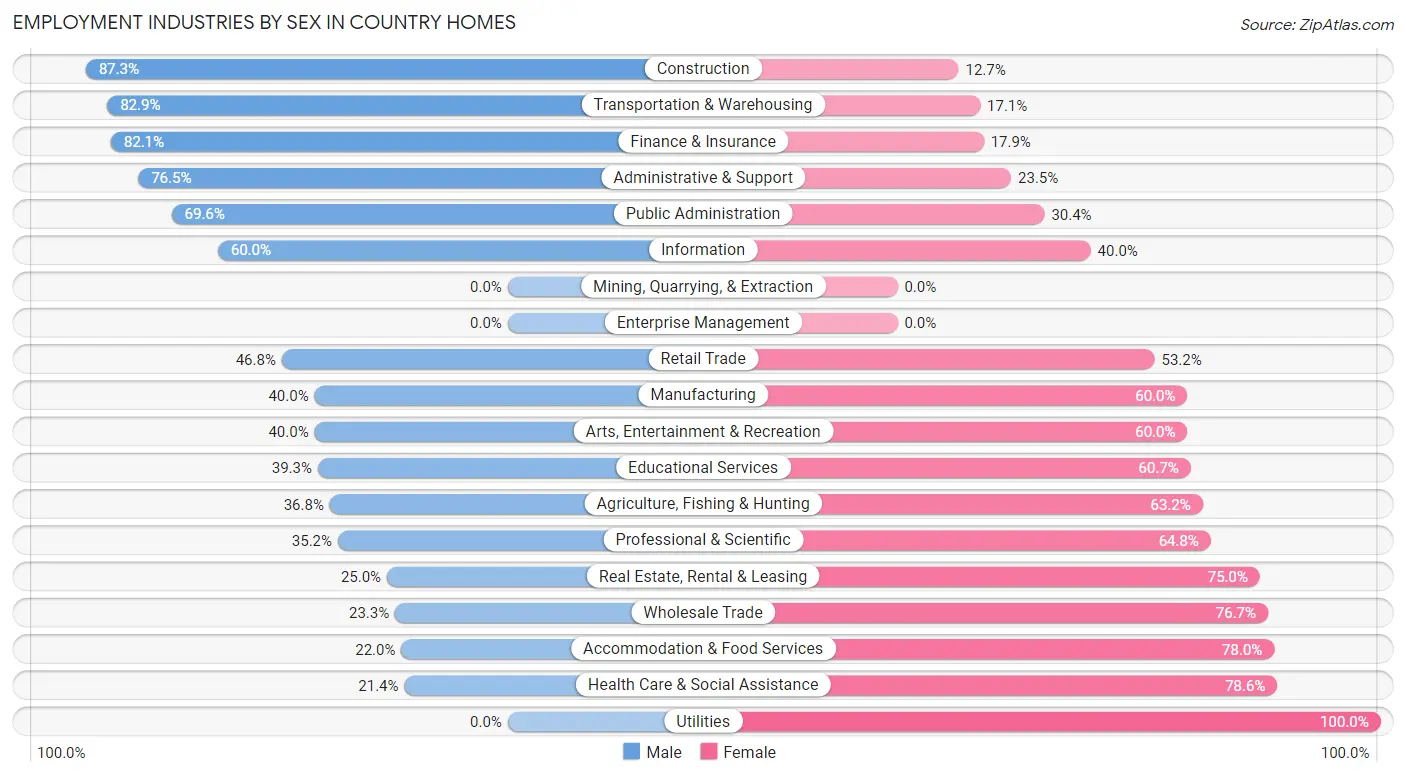
| Industry | Male | Female |
| Agriculture, Fishing & Hunting | 14 (36.8%) | 24 (63.2%) |
| Mining, Quarrying, & Extraction | 0 (0.0%) | 0 (0.0%) |
| Construction | 207 (87.3%) | 30 (12.7%) |
| Manufacturing | 70 (40.0%) | 105 (60.0%) |
| Wholesale Trade | 14 (23.3%) | 46 (76.7%) |
| Retail Trade | 138 (46.8%) | 157 (53.2%) |
| Transportation & Warehousing | 63 (82.9%) | 13 (17.1%) |
| Utilities | 0 (0.0%) | 3 (100.0%) |
| Information | 21 (60.0%) | 14 (40.0%) |
| Finance & Insurance | 69 (82.1%) | 15 (17.9%) |
| Real Estate, Rental & Leasing | 4 (25.0%) | 12 (75.0%) |
| Professional & Scientific | 45 (35.2%) | 83 (64.8%) |
| Enterprise Management | 0 (0.0%) | 0 (0.0%) |
| Administrative & Support | 78 (76.5%) | 24 (23.5%) |
| Educational Services | 103 (39.3%) | 159 (60.7%) |
| Health Care & Social Assistance | 74 (21.4%) | 272 (78.6%) |
| Arts, Entertainment & Recreation | 44 (40.0%) | 66 (60.0%) |
| Accommodation & Food Services | 78 (22.0%) | 276 (78.0%) |
| Public Administration | 32 (69.6%) | 14 (30.4%) |
| Total | 1,097 (44.1%) | 1,388 (55.9%) |
Education in Country Homes
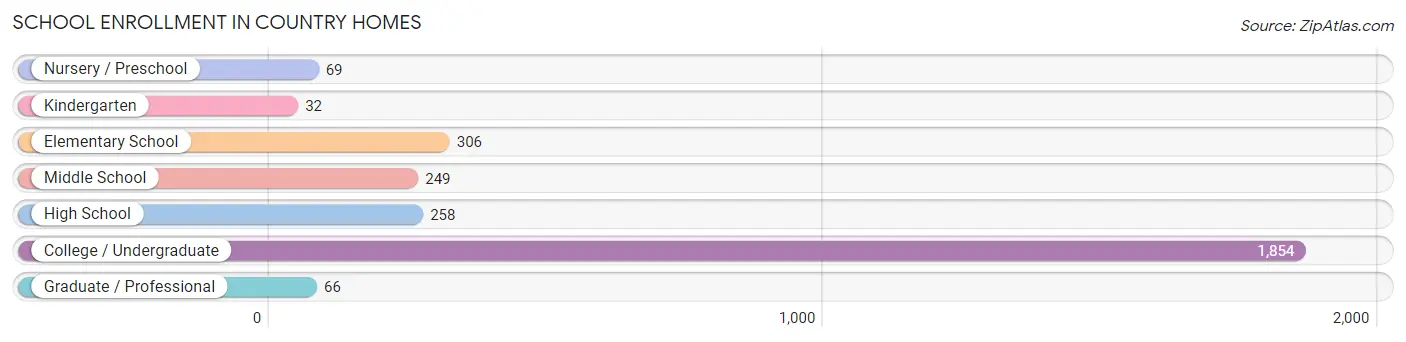
School Enrollment in Country Homes
The most common levels of schooling among the 2,834 students in Country Homes are college / undergraduate (1,854 | 65.4%), elementary school (306 | 10.8%), and high school (258 | 9.1%).
| School Level | # Students | % Students |
| Nursery / Preschool | 69 | 2.4% |
| Kindergarten | 32 | 1.1% |
| Elementary School | 306 | 10.8% |
| Middle School | 249 | 8.8% |
| High School | 258 | 9.1% |
| College / Undergraduate | 1,854 | 65.4% |
| Graduate / Professional | 66 | 2.3% |
| Total | 2,834 | 100.0% |
School Enrollment by Age by Funding Source in Country Homes
Out of a total of 2,834 students who are enrolled in schools in Country Homes, 1,601 (56.5%) attend a private institution, while the remaining 1,233 (43.5%) are enrolled in public schools. The age group of 20 to 24 year olds has the highest likelihood of being enrolled in private schools, with 626 (87.1% in the age bracket) enrolled. Conversely, the age group of 3 to 4 year olds has the lowest likelihood of being enrolled in a private school, with 34 (100.0% in the age bracket) attending a public institution.
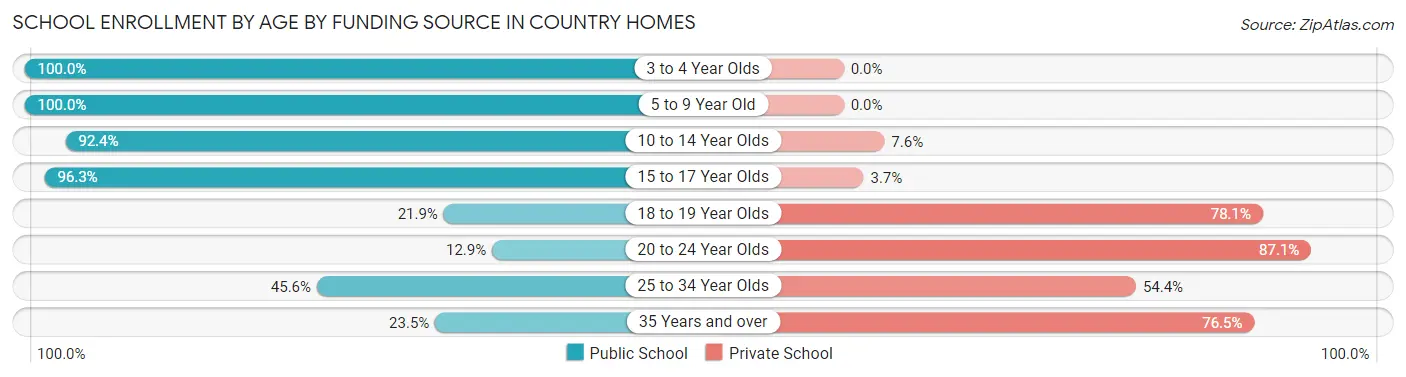
| Age Bracket | Public School | Private School |
| 3 to 4 Year Olds | 34 (100.0%) | 0 (0.0%) |
| 5 to 9 Year Old | 325 (100.0%) | 0 (0.0%) |
| 10 to 14 Year Olds | 280 (92.4%) | 23 (7.6%) |
| 15 to 17 Year Olds | 208 (96.3%) | 8 (3.7%) |
| 18 to 19 Year Olds | 233 (21.9%) | 829 (78.1%) |
| 20 to 24 Year Olds | 93 (12.9%) | 626 (87.1%) |
| 25 to 34 Year Olds | 41 (45.6%) | 49 (54.4%) |
| 35 Years and over | 20 (23.5%) | 65 (76.5%) |
| Total | 1,233 (43.5%) | 1,601 (56.5%) |
Educational Attainment by Field of Study in Country Homes
Education (193 | 17.3%), social sciences (165 | 14.8%), science & technology (109 | 9.8%), business (103 | 9.2%), and bio, nature & agricultural (93 | 8.4%) are the most common fields of study among 1,114 individuals in Country Homes who have obtained a bachelor's degree or higher.
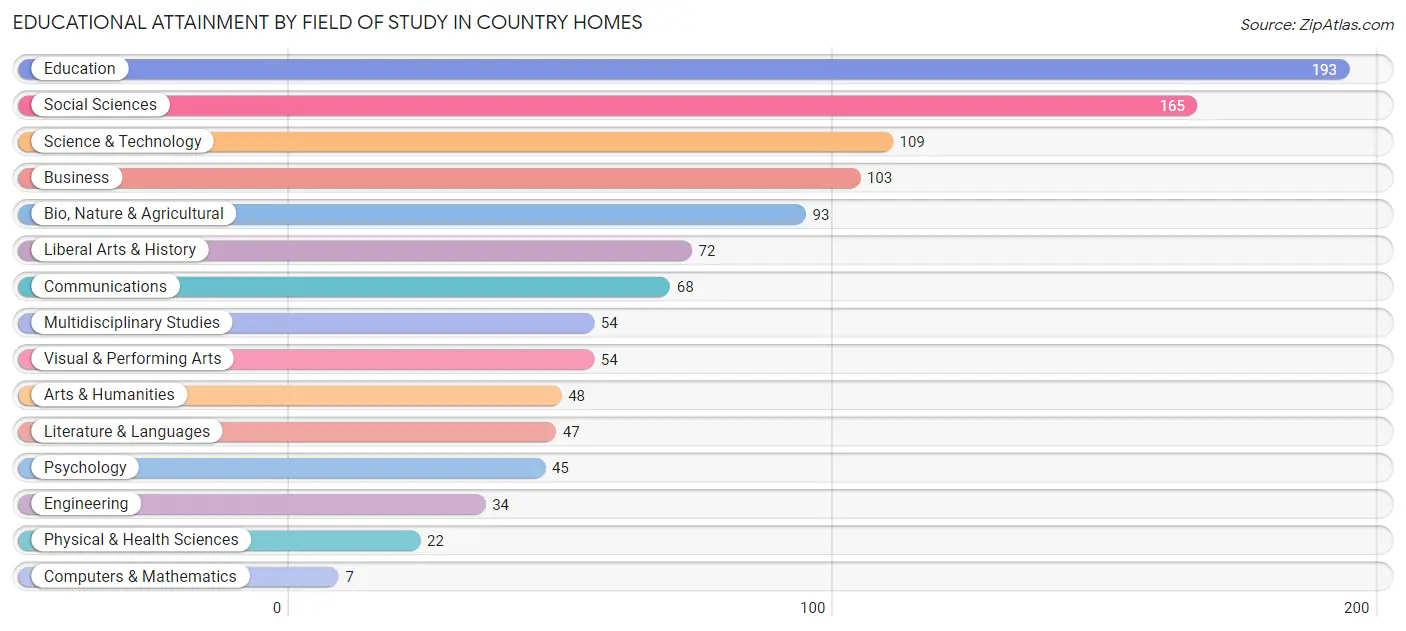
| Field of Study | # Graduates | % Graduates |
| Computers & Mathematics | 7 | 0.6% |
| Bio, Nature & Agricultural | 93 | 8.4% |
| Physical & Health Sciences | 22 | 2.0% |
| Psychology | 45 | 4.0% |
| Social Sciences | 165 | 14.8% |
| Engineering | 34 | 3.0% |
| Multidisciplinary Studies | 54 | 4.9% |
| Science & Technology | 109 | 9.8% |
| Business | 103 | 9.2% |
| Education | 193 | 17.3% |
| Literature & Languages | 47 | 4.2% |
| Liberal Arts & History | 72 | 6.5% |
| Visual & Performing Arts | 54 | 4.9% |
| Communications | 68 | 6.1% |
| Arts & Humanities | 48 | 4.3% |
| Total | 1,114 | 100.0% |
Transportation & Commute in Country Homes
Vehicle Availability by Sex in Country Homes
The most prevalent vehicle ownership categories in Country Homes are males with 2 vehicles (245, accounting for 29.2%) and females with 2 vehicles (359, making up 21.4%).
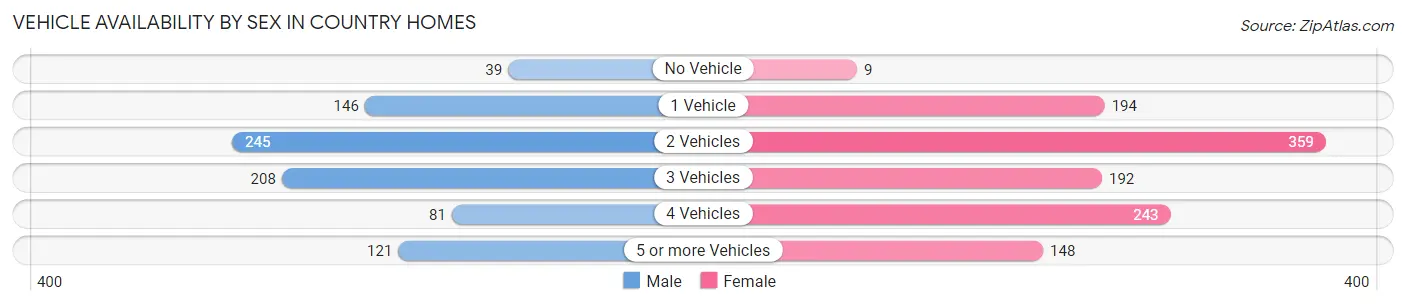
| Vehicles Available | Male | Female |
| No Vehicle | 39 (4.6%) | 9 (0.8%) |
| 1 Vehicle | 146 (17.4%) | 194 (16.9%) |
| 2 Vehicles | 245 (29.2%) | 359 (31.4%) |
| 3 Vehicles | 208 (24.8%) | 192 (16.8%) |
| 4 Vehicles | 81 (9.6%) | 243 (21.2%) |
| 5 or more Vehicles | 121 (14.4%) | 148 (12.9%) |
| Total | 840 (100.0%) | 1,145 (100.0%) |
Commute Time in Country Homes
The most frequently occuring commute durations in Country Homes are 20 to 24 minutes (461 commuters, 22.7%), 5 to 9 minutes (354 commuters, 17.4%), and 15 to 19 minutes (297 commuters, 14.6%).
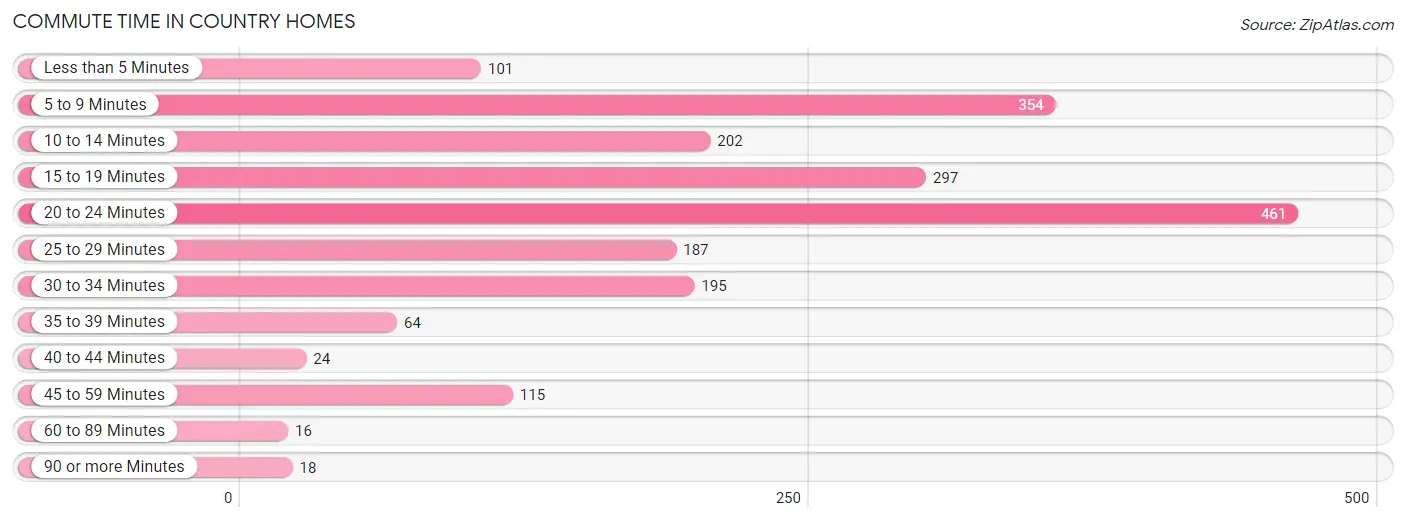
| Commute Time | # Commuters | % Commuters |
| Less than 5 Minutes | 101 | 5.0% |
| 5 to 9 Minutes | 354 | 17.4% |
| 10 to 14 Minutes | 202 | 9.9% |
| 15 to 19 Minutes | 297 | 14.6% |
| 20 to 24 Minutes | 461 | 22.7% |
| 25 to 29 Minutes | 187 | 9.2% |
| 30 to 34 Minutes | 195 | 9.6% |
| 35 to 39 Minutes | 64 | 3.2% |
| 40 to 44 Minutes | 24 | 1.2% |
| 45 to 59 Minutes | 115 | 5.7% |
| 60 to 89 Minutes | 16 | 0.8% |
| 90 or more Minutes | 18 | 0.9% |
Commute Time by Sex in Country Homes
The most common commute times in Country Homes are 20 to 24 minutes (165 commuters, 19.2%) for males and 20 to 24 minutes (296 commuters, 25.2%) for females.
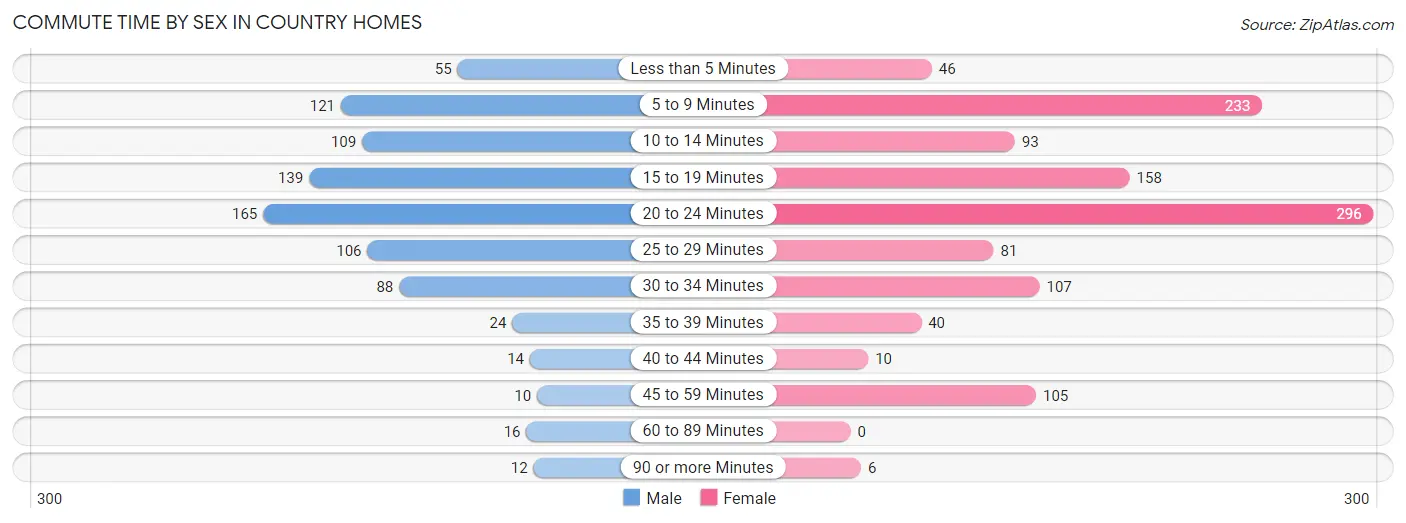
| Commute Time | Male | Female |
| Less than 5 Minutes | 55 (6.4%) | 46 (3.9%) |
| 5 to 9 Minutes | 121 (14.1%) | 233 (19.8%) |
| 10 to 14 Minutes | 109 (12.7%) | 93 (7.9%) |
| 15 to 19 Minutes | 139 (16.2%) | 158 (13.5%) |
| 20 to 24 Minutes | 165 (19.2%) | 296 (25.2%) |
| 25 to 29 Minutes | 106 (12.3%) | 81 (6.9%) |
| 30 to 34 Minutes | 88 (10.2%) | 107 (9.1%) |
| 35 to 39 Minutes | 24 (2.8%) | 40 (3.4%) |
| 40 to 44 Minutes | 14 (1.6%) | 10 (0.9%) |
| 45 to 59 Minutes | 10 (1.2%) | 105 (8.9%) |
| 60 to 89 Minutes | 16 (1.9%) | 0 (0.0%) |
| 90 or more Minutes | 12 (1.4%) | 6 (0.5%) |
Time of Departure to Work by Sex in Country Homes
The most frequent times of departure to work in Country Homes are 12:00 PM to 3:59 PM (157, 18.3%) for males and 4:00 PM to 11:59 PM (143, 12.2%) for females.
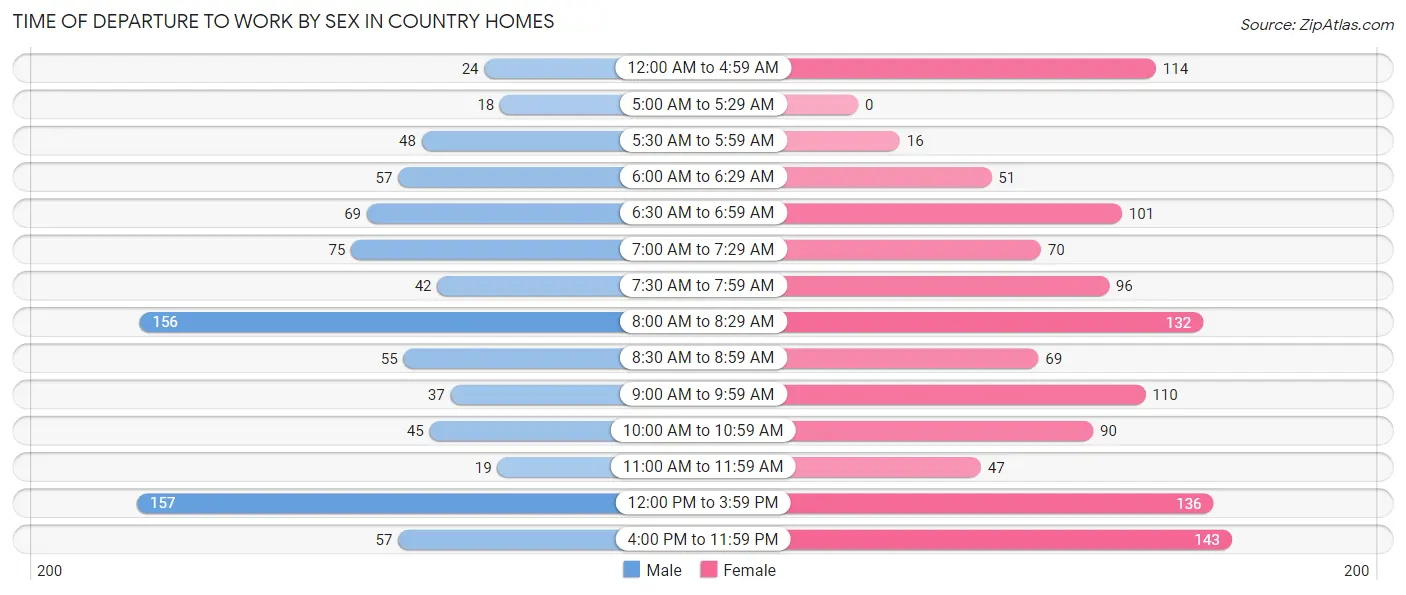
| Time of Departure | Male | Female |
| 12:00 AM to 4:59 AM | 24 (2.8%) | 114 (9.7%) |
| 5:00 AM to 5:29 AM | 18 (2.1%) | 0 (0.0%) |
| 5:30 AM to 5:59 AM | 48 (5.6%) | 16 (1.4%) |
| 6:00 AM to 6:29 AM | 57 (6.6%) | 51 (4.3%) |
| 6:30 AM to 6:59 AM | 69 (8.0%) | 101 (8.6%) |
| 7:00 AM to 7:29 AM | 75 (8.7%) | 70 (6.0%) |
| 7:30 AM to 7:59 AM | 42 (4.9%) | 96 (8.2%) |
| 8:00 AM to 8:29 AM | 156 (18.2%) | 132 (11.2%) |
| 8:30 AM to 8:59 AM | 55 (6.4%) | 69 (5.9%) |
| 9:00 AM to 9:59 AM | 37 (4.3%) | 110 (9.4%) |
| 10:00 AM to 10:59 AM | 45 (5.2%) | 90 (7.7%) |
| 11:00 AM to 11:59 AM | 19 (2.2%) | 47 (4.0%) |
| 12:00 PM to 3:59 PM | 157 (18.3%) | 136 (11.6%) |
| 4:00 PM to 11:59 PM | 57 (6.6%) | 143 (12.2%) |
| Total | 859 (100.0%) | 1,175 (100.0%) |
Housing Occupancy in Country Homes
Occupancy by Ownership in Country Homes
Of the total 1,825 dwellings in Country Homes, owner-occupied units account for 1,057 (57.9%), while renter-occupied units make up 768 (42.1%).
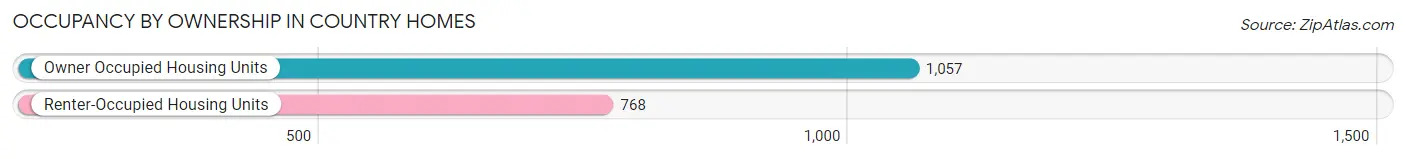
| Occupancy | # Housing Units | % Housing Units |
| Owner Occupied Housing Units | 1,057 | 57.9% |
| Renter-Occupied Housing Units | 768 | 42.1% |
| Total Occupied Housing Units | 1,825 | 100.0% |
Occupancy by Household Size in Country Homes
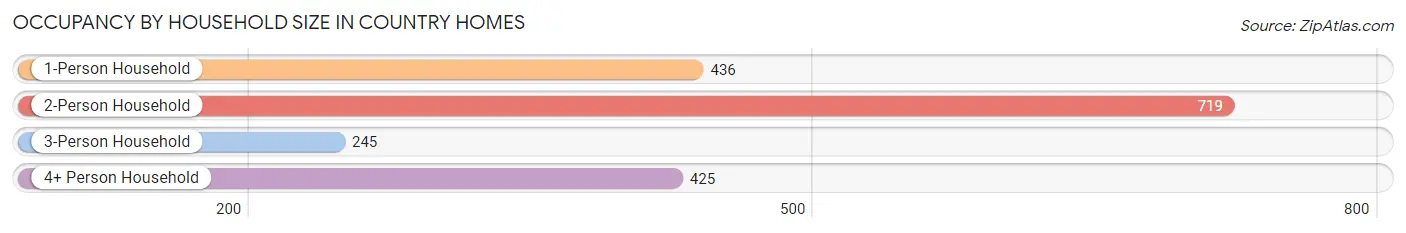
| Household Size | # Housing Units | % Housing Units |
| 1-Person Household | 436 | 23.9% |
| 2-Person Household | 719 | 39.4% |
| 3-Person Household | 245 | 13.4% |
| 4+ Person Household | 425 | 23.3% |
| Total Housing Units | 1,825 | 100.0% |
Occupancy by Ownership by Household Size in Country Homes
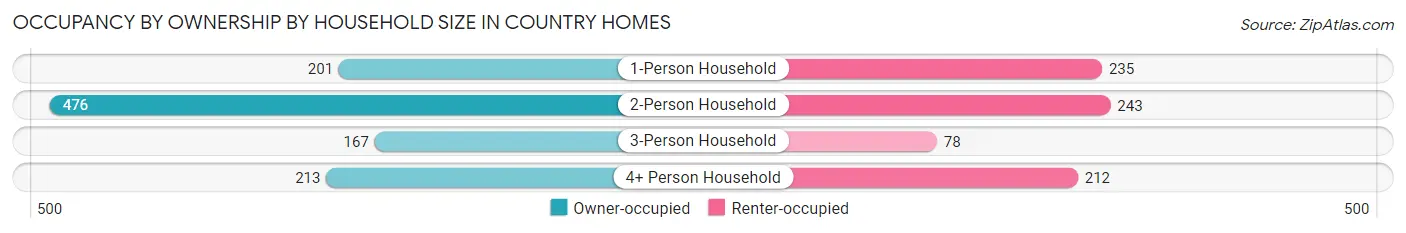
| Household Size | Owner-occupied | Renter-occupied |
| 1-Person Household | 201 (46.1%) | 235 (53.9%) |
| 2-Person Household | 476 (66.2%) | 243 (33.8%) |
| 3-Person Household | 167 (68.2%) | 78 (31.8%) |
| 4+ Person Household | 213 (50.1%) | 212 (49.9%) |
| Total Housing Units | 1,057 (57.9%) | 768 (42.1%) |
Occupancy by Educational Attainment in Country Homes
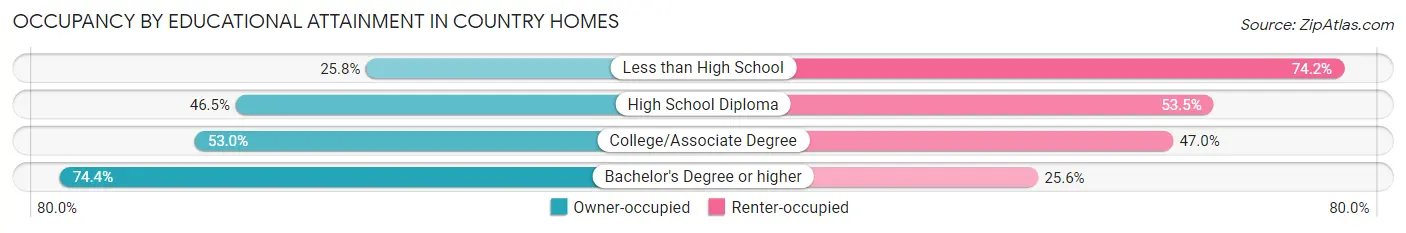
| Household Size | Owner-occupied | Renter-occupied |
| Less than High School | 16 (25.8%) | 46 (74.2%) |
| High School Diploma | 166 (46.5%) | 191 (53.5%) |
| College/Associate Degree | 424 (53.0%) | 376 (47.0%) |
| Bachelor's Degree or higher | 451 (74.4%) | 155 (25.6%) |
Occupancy by Age of Householder in Country Homes
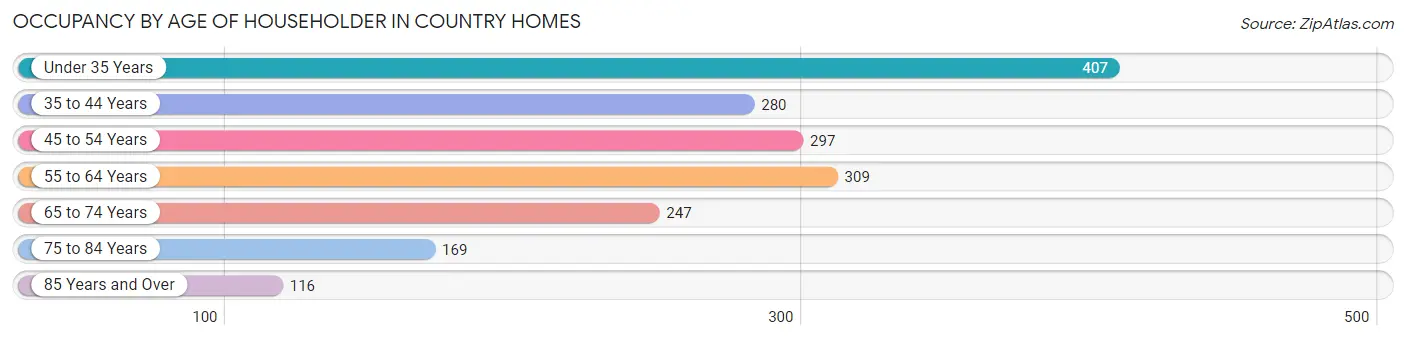
| Age Bracket | # Households | % Households |
| Under 35 Years | 407 | 22.3% |
| 35 to 44 Years | 280 | 15.3% |
| 45 to 54 Years | 297 | 16.3% |
| 55 to 64 Years | 309 | 16.9% |
| 65 to 74 Years | 247 | 13.5% |
| 75 to 84 Years | 169 | 9.3% |
| 85 Years and Over | 116 | 6.4% |
| Total | 1,825 | 100.0% |
Housing Finances in Country Homes
Median Income by Occupancy in Country Homes
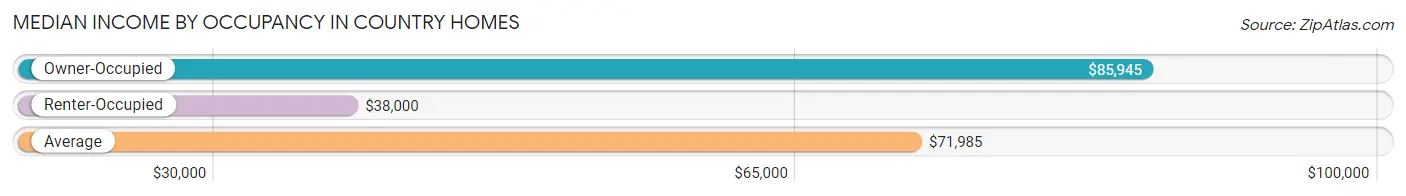
| Occupancy Type | # Households | Median Income |
| Owner-Occupied | 1,057 (57.9%) | $85,945 |
| Renter-Occupied | 768 (42.1%) | $38,000 |
| Average | 1,825 (100.0%) | $71,985 |
Occupancy by Householder Income Bracket in Country Homes
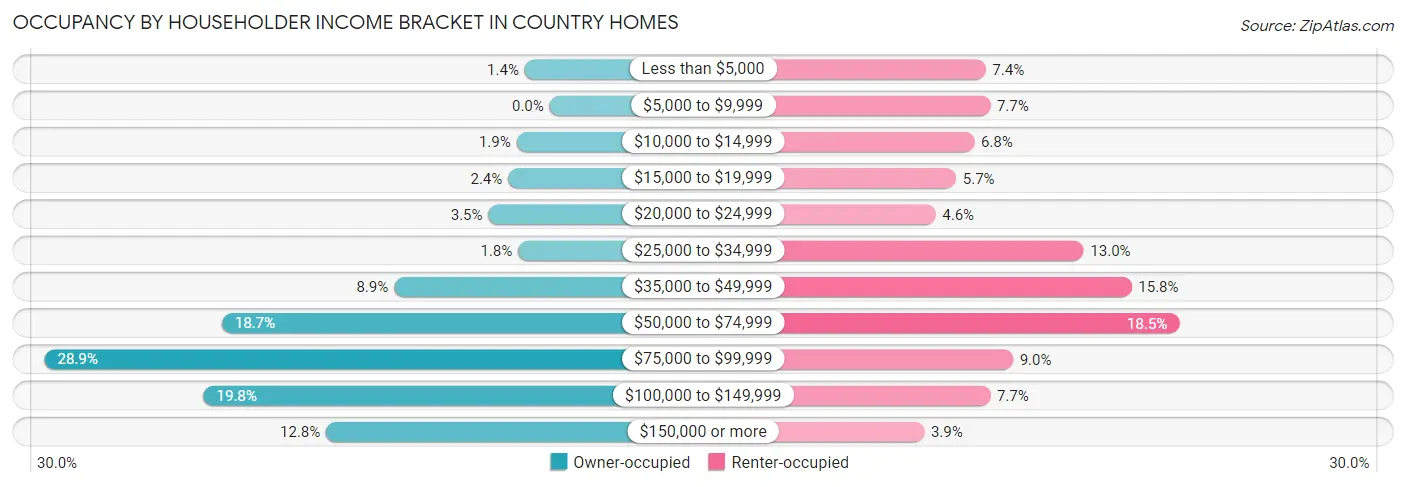
| Income Bracket | Owner-occupied | Renter-occupied |
| Less than $5,000 | 15 (1.4%) | 57 (7.4%) |
| $5,000 to $9,999 | 0 (0.0%) | 59 (7.7%) |
| $10,000 to $14,999 | 20 (1.9%) | 52 (6.8%) |
| $15,000 to $19,999 | 25 (2.4%) | 44 (5.7%) |
| $20,000 to $24,999 | 37 (3.5%) | 35 (4.6%) |
| $25,000 to $34,999 | 19 (1.8%) | 100 (13.0%) |
| $35,000 to $49,999 | 94 (8.9%) | 121 (15.8%) |
| $50,000 to $74,999 | 198 (18.7%) | 142 (18.5%) |
| $75,000 to $99,999 | 305 (28.9%) | 69 (9.0%) |
| $100,000 to $149,999 | 209 (19.8%) | 59 (7.7%) |
| $150,000 or more | 135 (12.8%) | 30 (3.9%) |
| Total | 1,057 (100.0%) | 768 (100.0%) |
Monthly Housing Cost Tiers in Country Homes
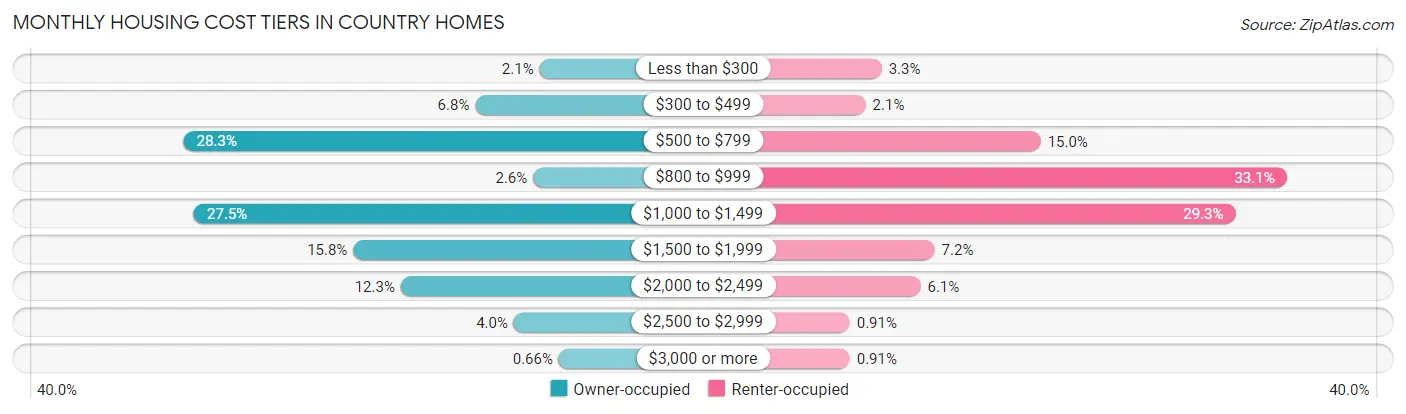
| Monthly Cost | Owner-occupied | Renter-occupied |
| Less than $300 | 22 (2.1%) | 25 (3.3%) |
| $300 to $499 | 72 (6.8%) | 16 (2.1%) |
| $500 to $799 | 299 (28.3%) | 115 (15.0%) |
| $800 to $999 | 27 (2.5%) | 254 (33.1%) |
| $1,000 to $1,499 | 291 (27.5%) | 225 (29.3%) |
| $1,500 to $1,999 | 167 (15.8%) | 55 (7.2%) |
| $2,000 to $2,499 | 130 (12.3%) | 47 (6.1%) |
| $2,500 to $2,999 | 42 (4.0%) | 7 (0.9%) |
| $3,000 or more | 7 (0.7%) | 7 (0.9%) |
| Total | 1,057 (100.0%) | 768 (100.0%) |
Physical Housing Characteristics in Country Homes
Housing Structures in Country Homes
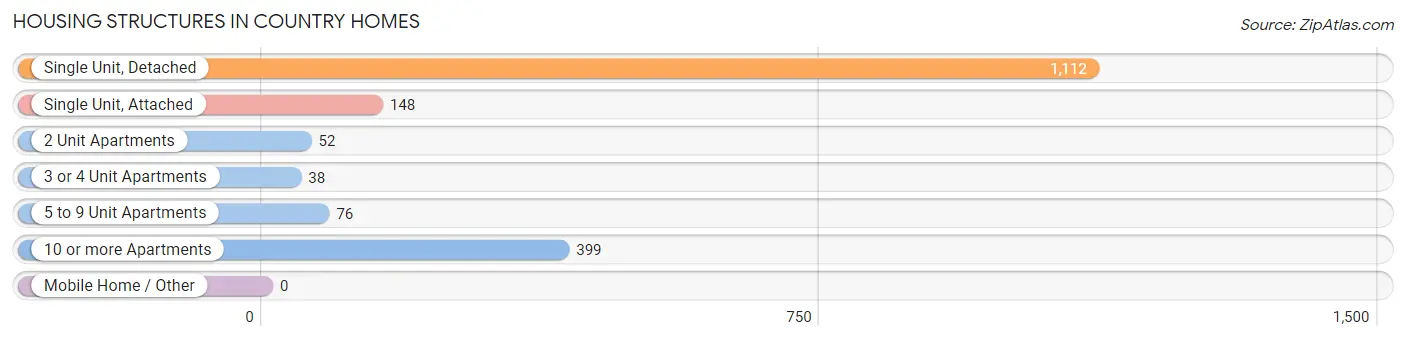
| Structure Type | # Housing Units | % Housing Units |
| Single Unit, Detached | 1,112 | 60.9% |
| Single Unit, Attached | 148 | 8.1% |
| 2 Unit Apartments | 52 | 2.9% |
| 3 or 4 Unit Apartments | 38 | 2.1% |
| 5 to 9 Unit Apartments | 76 | 4.2% |
| 10 or more Apartments | 399 | 21.9% |
| Mobile Home / Other | 0 | 0.0% |
| Total | 1,825 | 100.0% |
Housing Structures by Occupancy in Country Homes
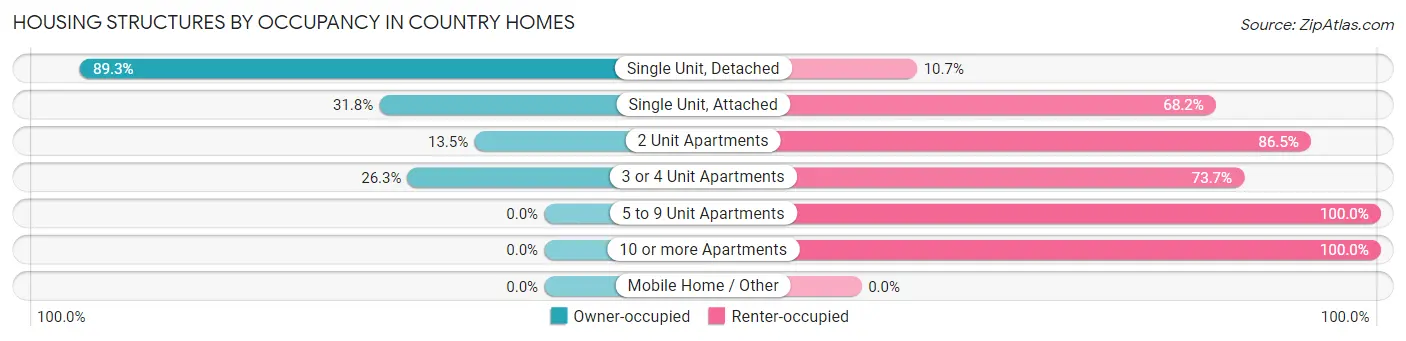
| Structure Type | Owner-occupied | Renter-occupied |
| Single Unit, Detached | 993 (89.3%) | 119 (10.7%) |
| Single Unit, Attached | 47 (31.8%) | 101 (68.2%) |
| 2 Unit Apartments | 7 (13.5%) | 45 (86.5%) |
| 3 or 4 Unit Apartments | 10 (26.3%) | 28 (73.7%) |
| 5 to 9 Unit Apartments | 0 (0.0%) | 76 (100.0%) |
| 10 or more Apartments | 0 (0.0%) | 399 (100.0%) |
| Mobile Home / Other | 0 (0.0%) | 0 (0.0%) |
| Total | 1,057 (57.9%) | 768 (42.1%) |
Housing Structures by Number of Rooms in Country Homes
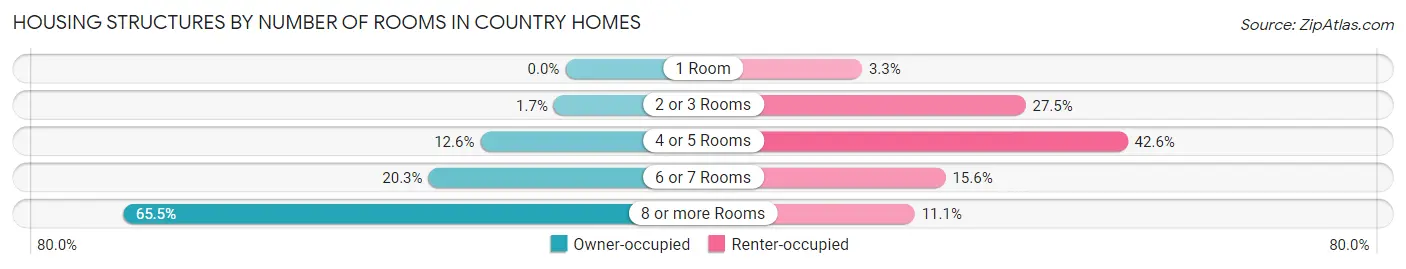
| Number of Rooms | Owner-occupied | Renter-occupied |
| 1 Room | 0 (0.0%) | 25 (3.3%) |
| 2 or 3 Rooms | 18 (1.7%) | 211 (27.5%) |
| 4 or 5 Rooms | 133 (12.6%) | 327 (42.6%) |
| 6 or 7 Rooms | 214 (20.3%) | 120 (15.6%) |
| 8 or more Rooms | 692 (65.5%) | 85 (11.1%) |
| Total | 1,057 (100.0%) | 768 (100.0%) |
Housing Structure by Heating Type in Country Homes
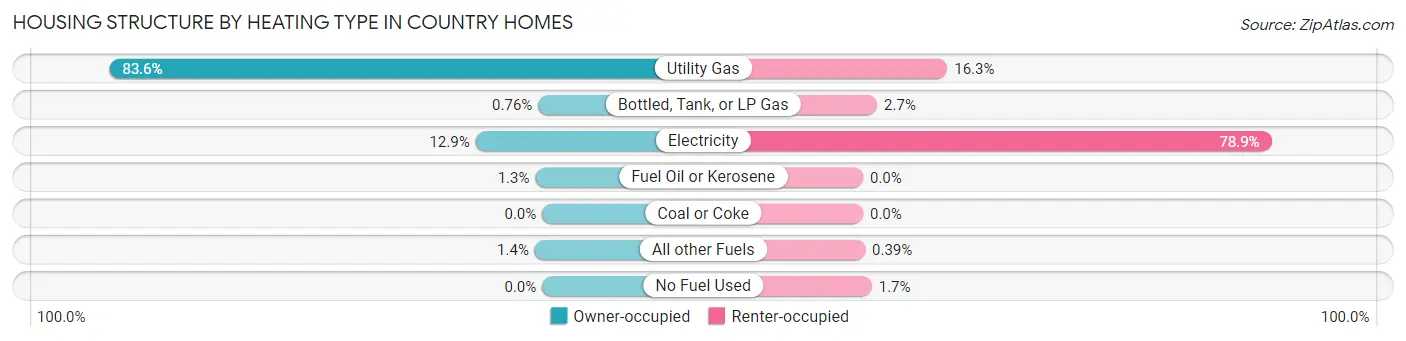
| Heating Type | Owner-occupied | Renter-occupied |
| Utility Gas | 884 (83.6%) | 125 (16.3%) |
| Bottled, Tank, or LP Gas | 8 (0.8%) | 21 (2.7%) |
| Electricity | 136 (12.9%) | 606 (78.9%) |
| Fuel Oil or Kerosene | 14 (1.3%) | 0 (0.0%) |
| Coal or Coke | 0 (0.0%) | 0 (0.0%) |
| All other Fuels | 15 (1.4%) | 3 (0.4%) |
| No Fuel Used | 0 (0.0%) | 13 (1.7%) |
| Total | 1,057 (100.0%) | 768 (100.0%) |
Household Vehicle Usage in Country Homes
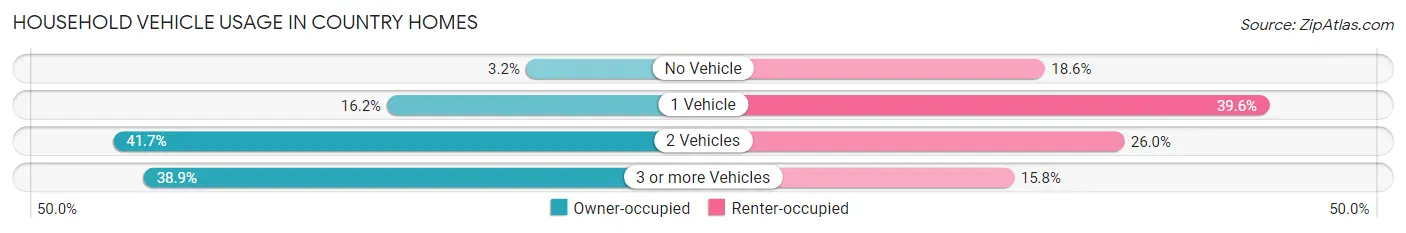
| Vehicles per Household | Owner-occupied | Renter-occupied |
| No Vehicle | 34 (3.2%) | 143 (18.6%) |
| 1 Vehicle | 171 (16.2%) | 304 (39.6%) |
| 2 Vehicles | 441 (41.7%) | 200 (26.0%) |
| 3 or more Vehicles | 411 (38.9%) | 121 (15.8%) |
| Total | 1,057 (100.0%) | 768 (100.0%) |
Real Estate & Mortgages in Country Homes
Real Estate and Mortgage Overview in Country Homes
| Characteristic | Without Mortgage | With Mortgage |
| Housing Units | 404 | 653 |
| Median Property Value | $297,200 | $358,500 |
| Median Household Income | $90,634 | $99 |
| Monthly Housing Costs | $568 | $7 |
| Real Estate Taxes | $3,359 | $0 |
Property Value by Mortgage Status in Country Homes
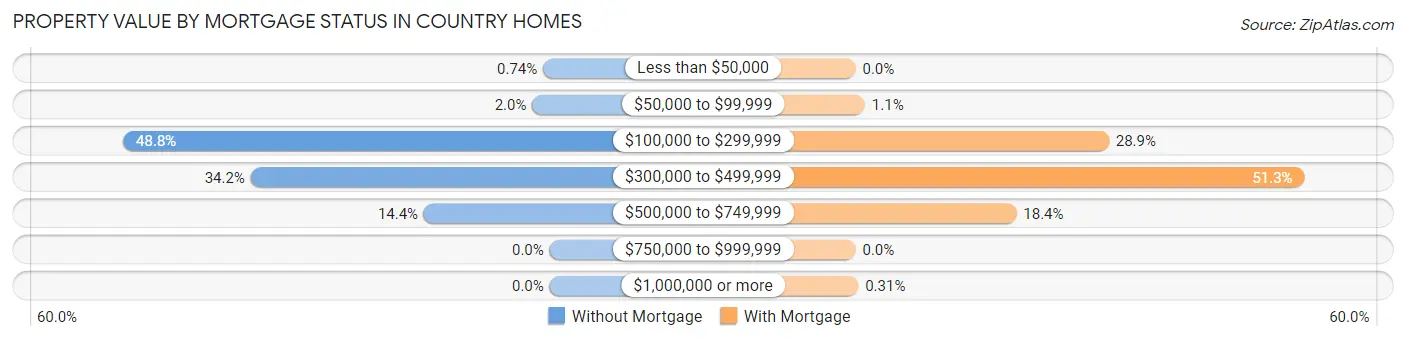
| Property Value | Without Mortgage | With Mortgage |
| Less than $50,000 | 3 (0.7%) | 0 (0.0%) |
| $50,000 to $99,999 | 8 (2.0%) | 7 (1.1%) |
| $100,000 to $299,999 | 197 (48.8%) | 189 (28.9%) |
| $300,000 to $499,999 | 138 (34.2%) | 335 (51.3%) |
| $500,000 to $749,999 | 58 (14.4%) | 120 (18.4%) |
| $750,000 to $999,999 | 0 (0.0%) | 0 (0.0%) |
| $1,000,000 or more | 0 (0.0%) | 2 (0.3%) |
| Total | 404 (100.0%) | 653 (100.0%) |
Household Income by Mortgage Status in Country Homes

| Household Income | Without Mortgage | With Mortgage |
| Less than $10,000 | 8 (2.0%) | 7 (1.1%) |
| $10,000 to $24,999 | 59 (14.6%) | 7 (1.1%) |
| $25,000 to $34,999 | 11 (2.7%) | 23 (3.5%) |
| $35,000 to $49,999 | 25 (6.2%) | 8 (1.2%) |
| $50,000 to $74,999 | 18 (4.5%) | 69 (10.6%) |
| $75,000 to $99,999 | 157 (38.9%) | 180 (27.6%) |
| $100,000 to $149,999 | 90 (22.3%) | 148 (22.7%) |
| $150,000 or more | 36 (8.9%) | 119 (18.2%) |
| Total | 404 (100.0%) | 653 (100.0%) |
Property Value to Household Income Ratio in Country Homes
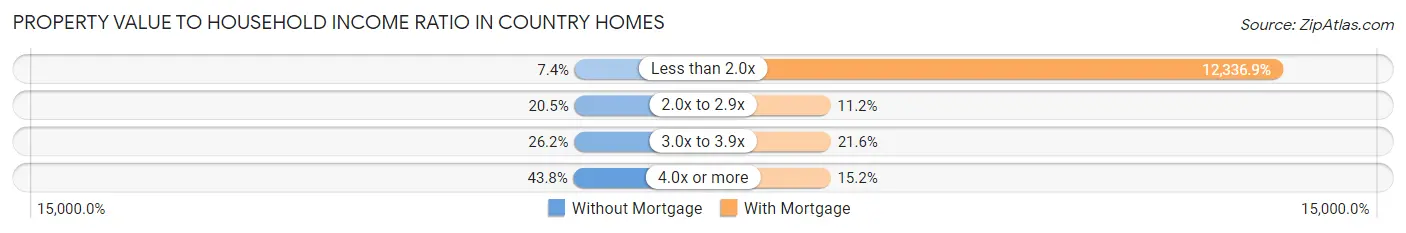
| Value-to-Income Ratio | Without Mortgage | With Mortgage |
| Less than 2.0x | 30 (7.4%) | 80,560 (12,336.9%) |
| 2.0x to 2.9x | 83 (20.5%) | 73 (11.2%) |
| 3.0x to 3.9x | 106 (26.2%) | 141 (21.6%) |
| 4.0x or more | 177 (43.8%) | 99 (15.2%) |
| Total | 404 (100.0%) | 653 (100.0%) |
Real Estate Taxes by Mortgage Status in Country Homes
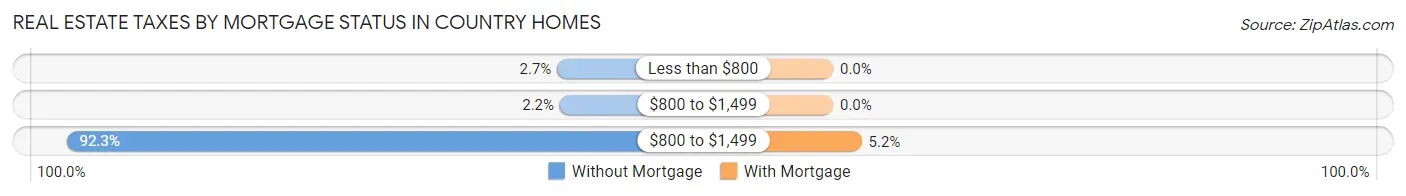
| Property Taxes | Without Mortgage | With Mortgage |
| Less than $800 | 11 (2.7%) | 0 (0.0%) |
| $800 to $1,499 | 9 (2.2%) | 0 (0.0%) |
| $800 to $1,499 | 373 (92.3%) | 34 (5.2%) |
| Total | 404 (100.0%) | 653 (100.0%) |
Health & Disability in Country Homes
Health Insurance Coverage by Age in Country Homes
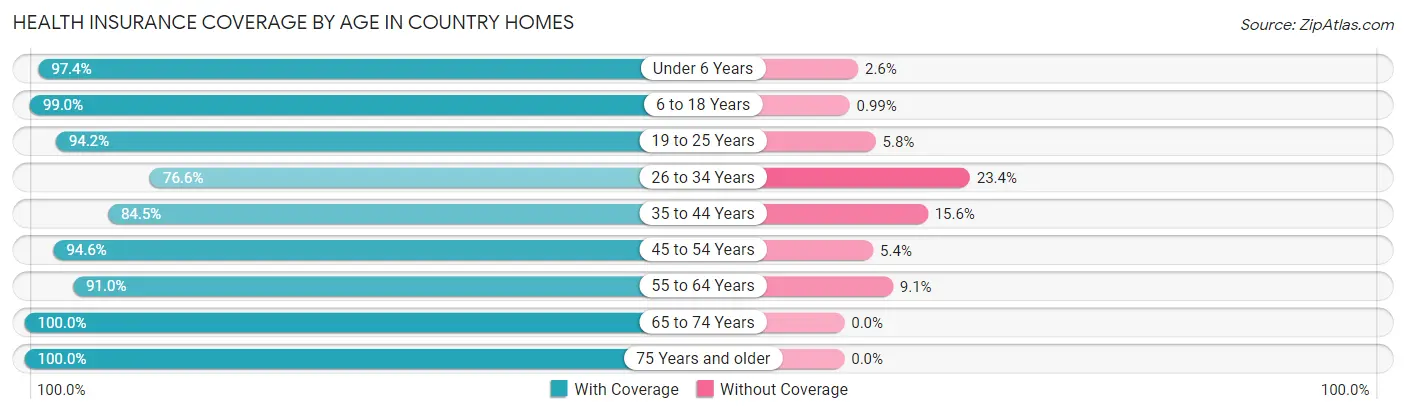
| Age Bracket | With Coverage | Without Coverage |
| Under 6 Years | 266 (97.4%) | 7 (2.6%) |
| 6 to 18 Years | 1,298 (99.0%) | 13 (1.0%) |
| 19 to 25 Years | 1,402 (94.2%) | 87 (5.8%) |
| 26 to 34 Years | 419 (76.6%) | 128 (23.4%) |
| 35 to 44 Years | 467 (84.5%) | 86 (15.5%) |
| 45 to 54 Years | 580 (94.6%) | 33 (5.4%) |
| 55 to 64 Years | 563 (90.9%) | 56 (9.0%) |
| 65 to 74 Years | 407 (100.0%) | 0 (0.0%) |
| 75 Years and older | 421 (100.0%) | 0 (0.0%) |
| Total | 5,823 (93.4%) | 410 (6.6%) |
Health Insurance Coverage by Citizenship Status in Country Homes
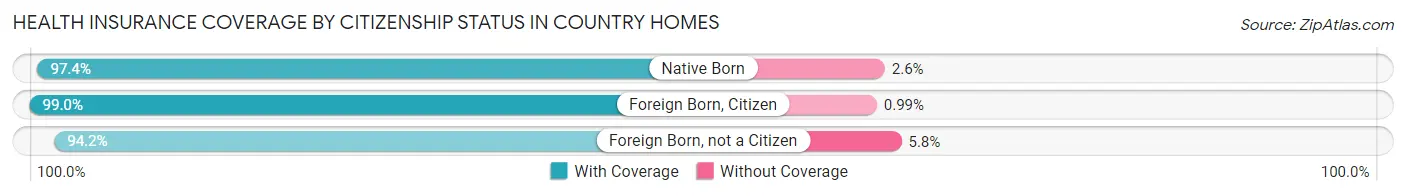
| Citizenship Status | With Coverage | Without Coverage |
| Native Born | 266 (97.4%) | 7 (2.6%) |
| Foreign Born, Citizen | 1,298 (99.0%) | 13 (1.0%) |
| Foreign Born, not a Citizen | 1,402 (94.2%) | 87 (5.8%) |
Health Insurance Coverage by Household Income in Country Homes
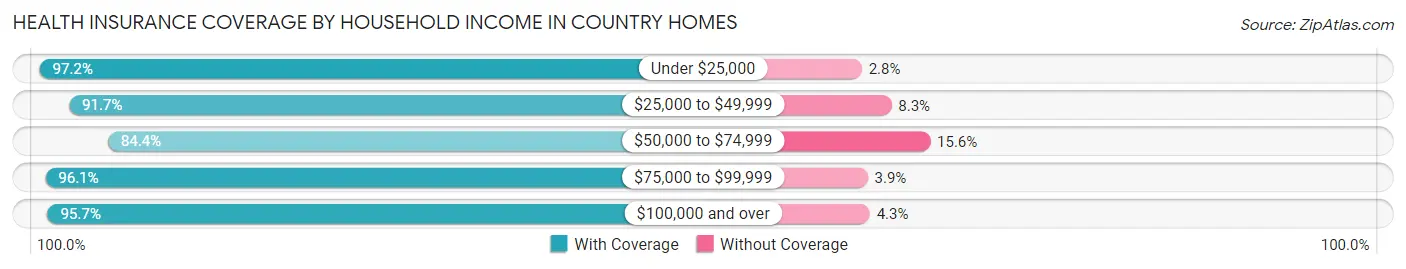
| Household Income | With Coverage | Without Coverage |
| Under $25,000 | 695 (97.2%) | 20 (2.8%) |
| $25,000 to $49,999 | 890 (91.7%) | 81 (8.3%) |
| $50,000 to $74,999 | 762 (84.4%) | 141 (15.6%) |
| $75,000 to $99,999 | 1,035 (96.1%) | 42 (3.9%) |
| $100,000 and over | 1,248 (95.7%) | 56 (4.3%) |
Public vs Private Health Insurance Coverage by Age in Country Homes
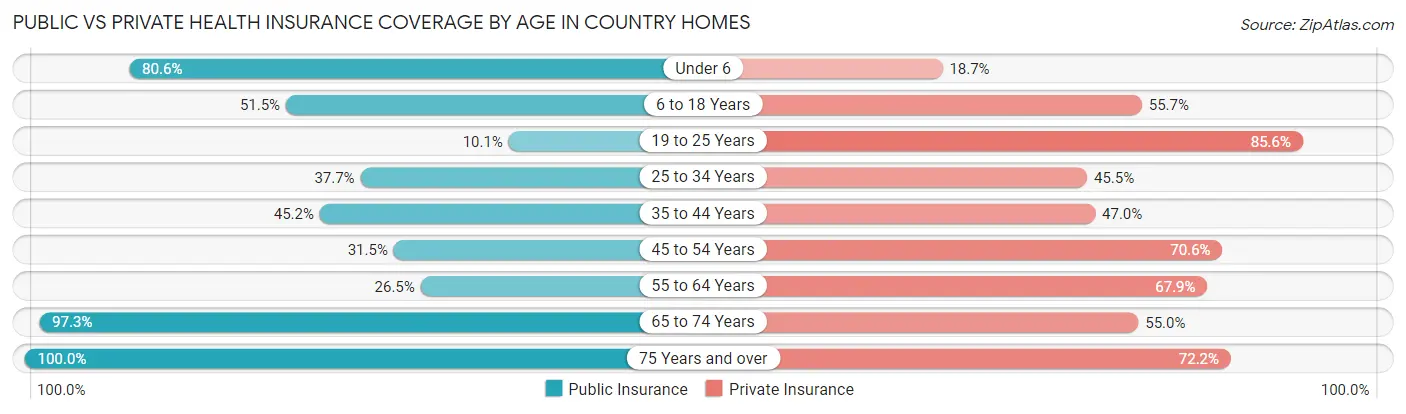
| Age Bracket | Public Insurance | Private Insurance |
| Under 6 | 220 (80.6%) | 51 (18.7%) |
| 6 to 18 Years | 675 (51.5%) | 730 (55.7%) |
| 19 to 25 Years | 151 (10.1%) | 1,274 (85.6%) |
| 25 to 34 Years | 206 (37.7%) | 249 (45.5%) |
| 35 to 44 Years | 250 (45.2%) | 260 (47.0%) |
| 45 to 54 Years | 193 (31.5%) | 433 (70.6%) |
| 55 to 64 Years | 164 (26.5%) | 420 (67.8%) |
| 65 to 74 Years | 396 (97.3%) | 224 (55.0%) |
| 75 Years and over | 421 (100.0%) | 304 (72.2%) |
| Total | 2,676 (42.9%) | 3,945 (63.3%) |
Disability Status by Sex by Age in Country Homes
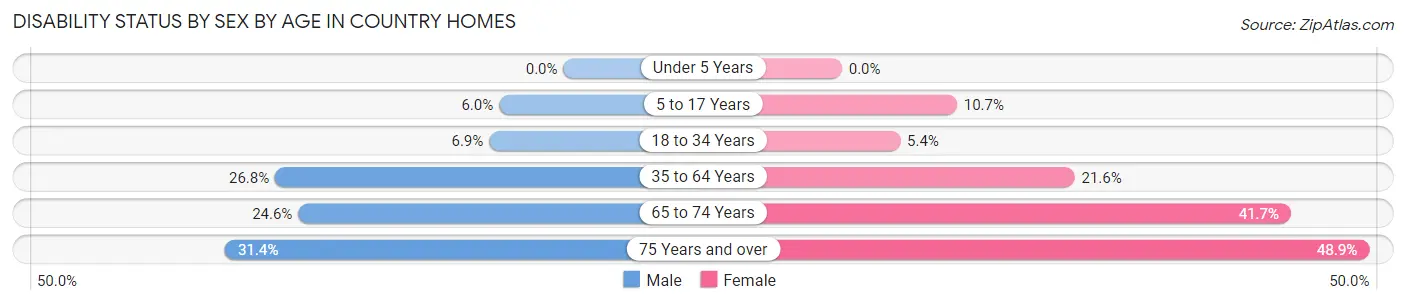
| Age Bracket | Male | Female |
| Under 5 Years | 0 (0.0%) | 0 (0.0%) |
| 5 to 17 Years | 28 (6.0%) | 43 (10.7%) |
| 18 to 34 Years | 86 (6.9%) | 71 (5.4%) |
| 35 to 64 Years | 220 (26.8%) | 208 (21.6%) |
| 65 to 74 Years | 47 (24.6%) | 90 (41.7%) |
| 75 Years and over | 43 (31.4%) | 139 (48.9%) |
Disability Class by Sex by Age in Country Homes
Disability Class: Hearing Difficulty
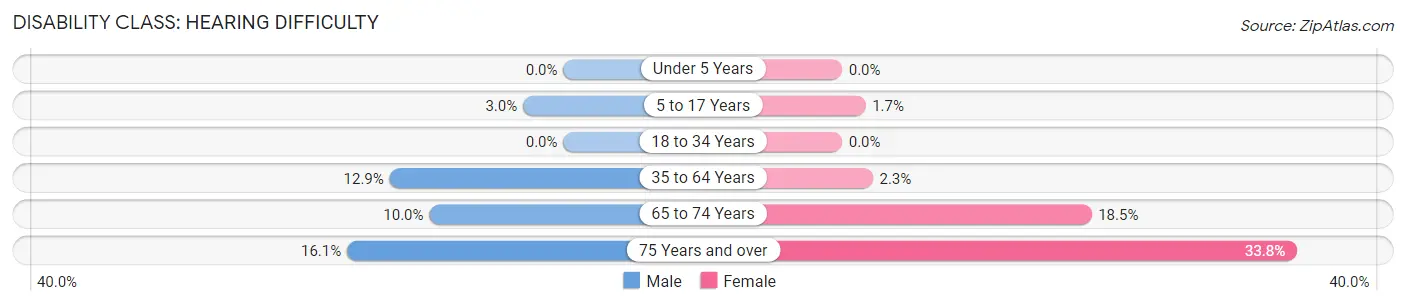
| Age Bracket | Male | Female |
| Under 5 Years | 0 (0.0%) | 0 (0.0%) |
| 5 to 17 Years | 14 (3.0%) | 7 (1.7%) |
| 18 to 34 Years | 0 (0.0%) | 0 (0.0%) |
| 35 to 64 Years | 106 (12.9%) | 22 (2.3%) |
| 65 to 74 Years | 19 (10.0%) | 40 (18.5%) |
| 75 Years and over | 22 (16.1%) | 96 (33.8%) |
Disability Class: Vision Difficulty
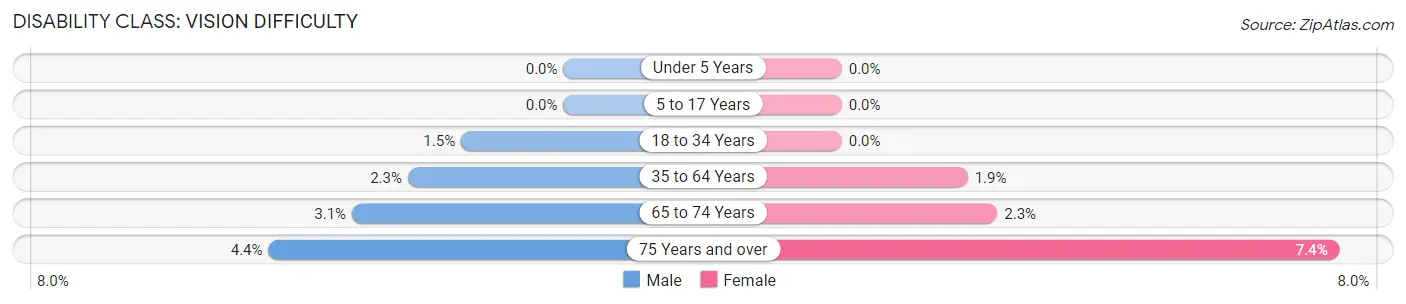
| Age Bracket | Male | Female |
| Under 5 Years | 0 (0.0%) | 0 (0.0%) |
| 5 to 17 Years | 0 (0.0%) | 0 (0.0%) |
| 18 to 34 Years | 19 (1.5%) | 0 (0.0%) |
| 35 to 64 Years | 19 (2.3%) | 18 (1.9%) |
| 65 to 74 Years | 6 (3.1%) | 5 (2.3%) |
| 75 Years and over | 6 (4.4%) | 21 (7.4%) |
Disability Class: Cognitive Difficulty
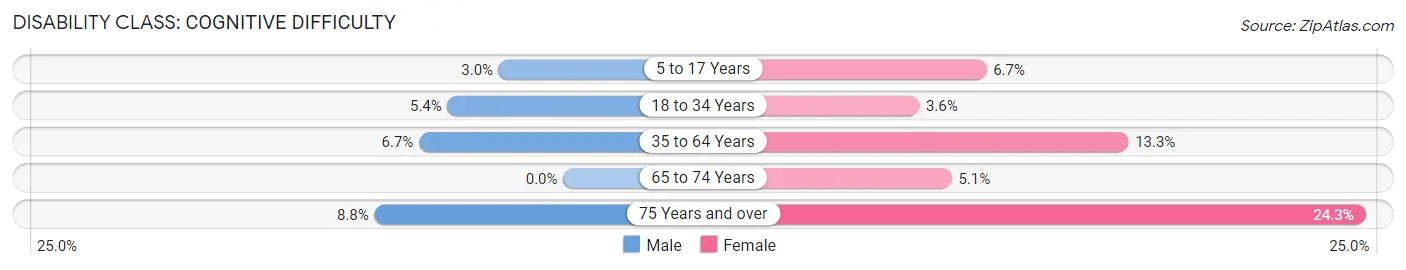
| Age Bracket | Male | Female |
| 5 to 17 Years | 14 (3.0%) | 27 (6.7%) |
| 18 to 34 Years | 67 (5.4%) | 47 (3.6%) |
| 35 to 64 Years | 55 (6.7%) | 128 (13.3%) |
| 65 to 74 Years | 0 (0.0%) | 11 (5.1%) |
| 75 Years and over | 12 (8.8%) | 69 (24.3%) |
Disability Class: Ambulatory Difficulty
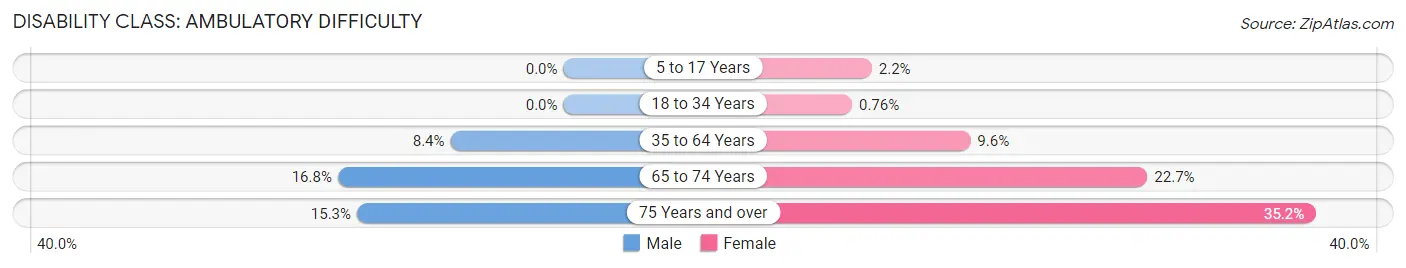
| Age Bracket | Male | Female |
| 5 to 17 Years | 0 (0.0%) | 9 (2.2%) |
| 18 to 34 Years | 0 (0.0%) | 10 (0.8%) |
| 35 to 64 Years | 69 (8.4%) | 92 (9.6%) |
| 65 to 74 Years | 32 (16.8%) | 49 (22.7%) |
| 75 Years and over | 21 (15.3%) | 100 (35.2%) |
Disability Class: Self-Care Difficulty
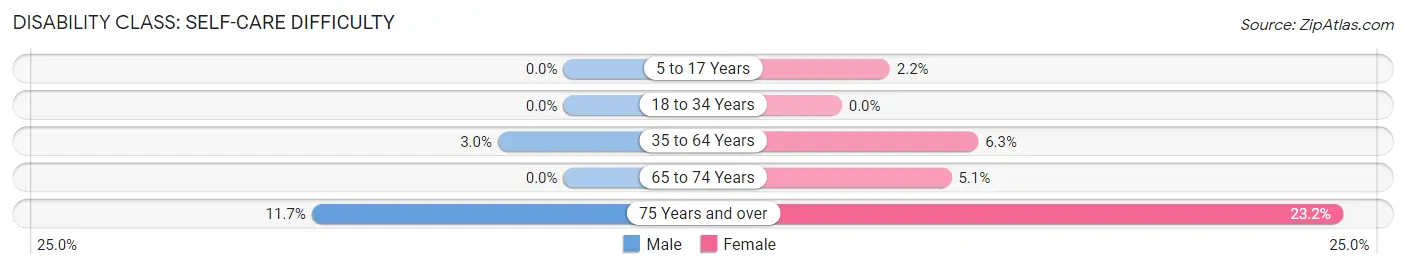
| Age Bracket | Male | Female |
| 5 to 17 Years | 0 (0.0%) | 9 (2.2%) |
| 18 to 34 Years | 0 (0.0%) | 0 (0.0%) |
| 35 to 64 Years | 25 (3.0%) | 61 (6.3%) |
| 65 to 74 Years | 0 (0.0%) | 11 (5.1%) |
| 75 Years and over | 16 (11.7%) | 66 (23.2%) |
Technology Access in Country Homes
Computing Device Access in Country Homes
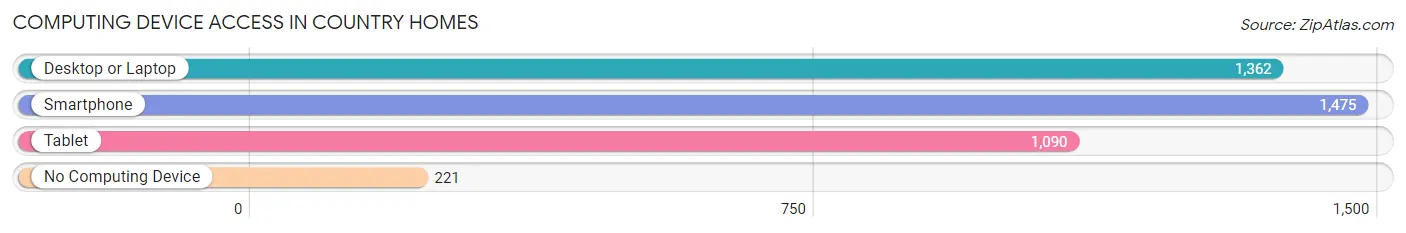
| Device Type | # Households | % Households |
| Desktop or Laptop | 1,362 | 74.6% |
| Smartphone | 1,475 | 80.8% |
| Tablet | 1,090 | 59.7% |
| No Computing Device | 221 | 12.1% |
| Total | 1,825 | 100.0% |
Internet Access in Country Homes
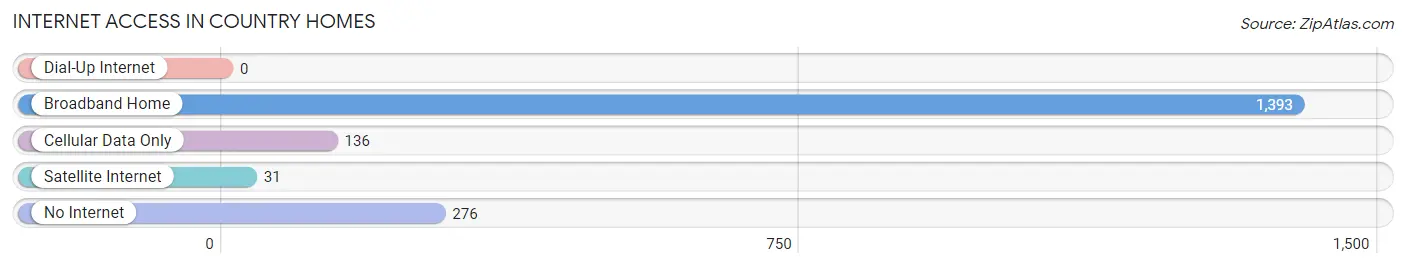
| Internet Type | # Households | % Households |
| Dial-Up Internet | 0 | 0.0% |
| Broadband Home | 1,393 | 76.3% |
| Cellular Data Only | 136 | 7.4% |
| Satellite Internet | 31 | 1.7% |
| No Internet | 276 | 15.1% |
| Total | 1,825 | 100.0% |
Country Homes Summary
Country Homes is a small unincorporated community located in Spokane County, Washington. It is situated in the northwest corner of the state, approximately 20 miles north of Spokane. The community is bordered by the Spokane River to the east, the Little Spokane River to the west, and the Spokane Valley to the south. The population of Country Homes was estimated to be 1,845 in 2019.
History
Country Homes was first settled in the late 1800s by homesteaders who were attracted to the area by its fertile soil and abundant natural resources. The community was originally known as "Country Home," but the name was changed to "Country Homes" in the early 1900s. The first post office in the area was established in 1902.
In the early 1900s, the area was primarily agricultural, with many of the residents growing wheat, barley, and oats. The area also had a thriving dairy industry, with several local dairies producing milk, butter, and cheese.
In the 1950s, the area began to experience rapid growth as the population of Spokane increased. This growth was fueled by the construction of the Spokane Valley Mall in the late 1960s, which brought many new businesses and residents to the area.
Geography
Country Homes is located in the northwest corner of Spokane County, Washington. It is situated in the Spokane Valley, which is bordered by the Spokane River to the east, the Little Spokane River to the west, and the Spokane Valley to the south. The area is characterized by rolling hills and open fields, with the Spokane River providing a scenic backdrop.
The climate in Country Homes is typical of the Pacific Northwest, with mild winters and warm summers. The average annual temperature is around 50°F (10°C), with an average high of around 70°F (21°C) in the summer and an average low of around 30°F (-1°C) in the winter.
Economy
The economy of Country Homes is primarily based on agriculture and retail. The area is home to several large farms, which produce a variety of crops, including wheat, barley, oats, and hay. The area also has several large retail stores, including a Walmart Supercenter, a Home Depot, and a Lowe's.
The area is also home to several small businesses, including restaurants, auto repair shops, and a variety of other services. The area is also home to several medical facilities, including a hospital and several clinics.
Demographics
As of 2019, the population of Country Homes was estimated to be 1,845. The population is primarily white (90.2%), with the remaining population being made up of African Americans (3.2%), Asians (2.2%), and other races (4.4%). The median household income in Country Homes is $50,945, which is slightly higher than the median household income for Spokane County ($50,845). The median age in Country Homes is 37.7, which is slightly lower than the median age for Spokane County (38.2).
Common Questions
What is Per Capita Income in Country Homes?
Per Capita income in Country Homes is $28,807.
What is the Median Family Income in Country Homes?
Median Family Income in Country Homes is $80,965.
What is the Median Household income in Country Homes?
Median Household Income in Country Homes is $71,985.
What is Income or Wage Gap in Country Homes?
Income or Wage Gap in Country Homes is 7.8%.
Women in Country Homes earn 92.2 cents for every dollar earned by a man.
What is Inequality or Gini Index in Country Homes?
Inequality or Gini Index in Country Homes is 0.51.
What is the Total Population of Country Homes?
Total Population of Country Homes is 6,248.
What is the Total Male Population of Country Homes?
Total Male Population of Country Homes is 2,935.
What is the Total Female Population of Country Homes?
Total Female Population of Country Homes is 3,313.
What is the Ratio of Males per 100 Females in Country Homes?
There are 88.59 Males per 100 Females in Country Homes.
What is the Ratio of Females per 100 Males in Country Homes?
There are 112.88 Females per 100 Males in Country Homes.
What is the Median Population Age in Country Homes?
Median Population Age in Country Homes is 27.3 Years.
What is the Average Family Size in Country Homes
Average Family Size in Country Homes is 3.0 People.
What is the Average Household Size in Country Homes
Average Household Size in Country Homes is 2.7 People.
How Large is the Labor Force in Country Homes?
There are 2,750 People in the Labor Forcein in Country Homes.
What is the Percentage of People in the Labor Force in Country Homes?
51.2% of People are in the Labor Force in Country Homes.
What is the Unemployment Rate in Country Homes?
Unemployment Rate in Country Homes is 9.7%.