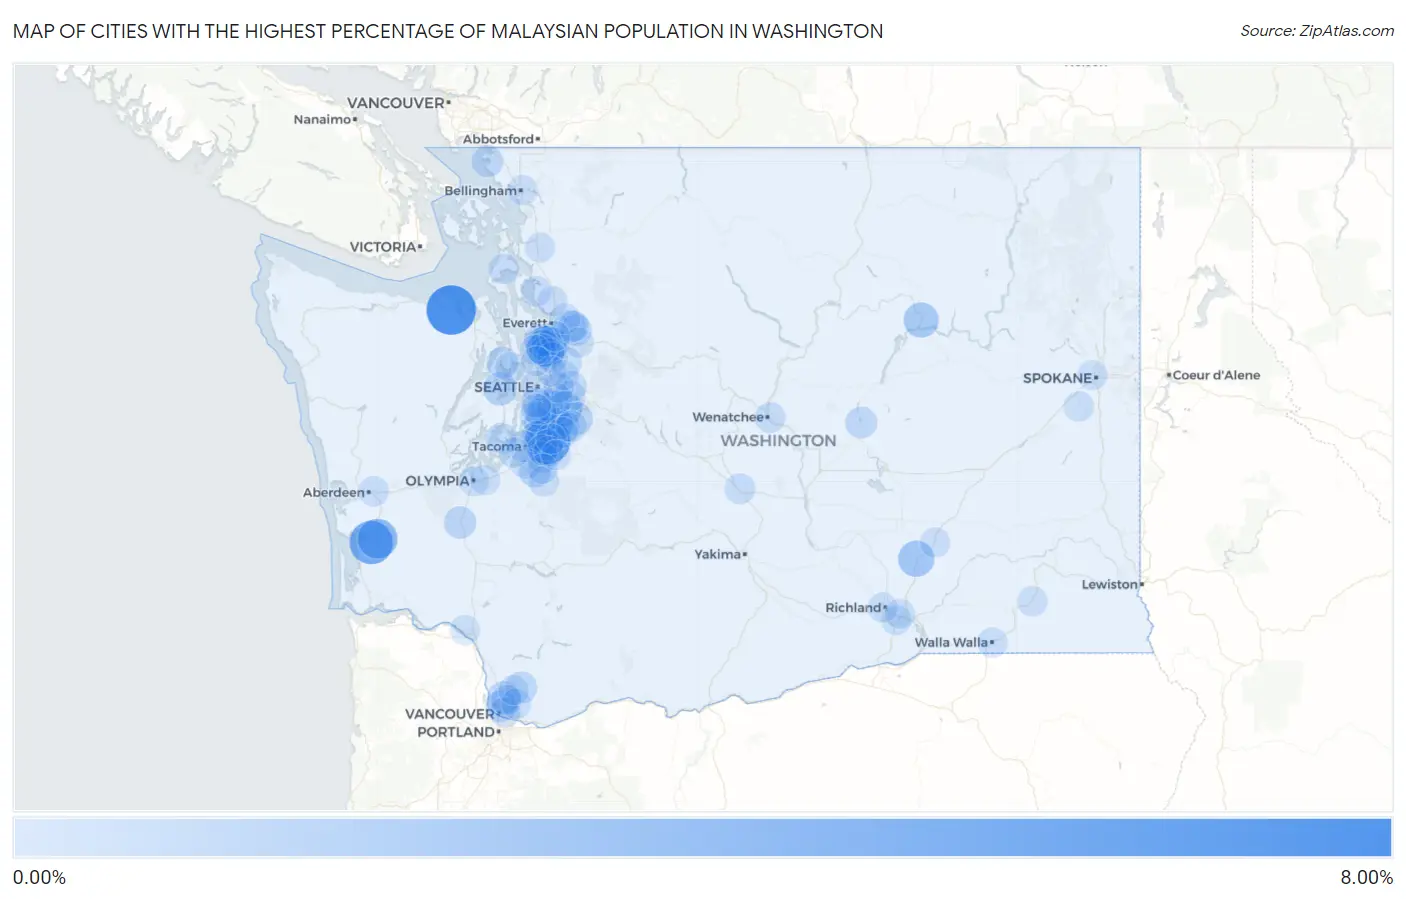
Cities with the Highest Percentage of Malaysian Population in Washington
RELATED REPORTS & OPTIONS
Malaysian
Washington
Compare Cities
Map of Cities with the Highest Percentage of Malaysian Population in Washington
0.00%
8.00%
Cities with the Highest Percentage of Malaysian Population in Washington
| City | Malaysian | vs State | vs National | |
| 1. | Bell Hill | 7.44% | 0.15%(+7.29)#1 | 0.076%(+7.37)#19 |
| 2. | Algona | 5.88% | 0.15%(+5.73)#2 | 0.076%(+5.81)#24 |
| 3. | South Bend | 5.00% | 0.15%(+4.85)#3 | 0.076%(+4.93)#36 |
| 4. | Larch Way | 3.82% | 0.15%(+3.66)#4 | 0.076%(+3.74)#47 |
| 5. | Raymond | 3.62% | 0.15%(+3.47)#5 | 0.076%(+3.55)#51 |
| 6. | Mesa | 2.23% | 0.15%(+2.08)#6 | 0.076%(+2.16)#101 |
| 7. | Elmer City | 1.81% | 0.15%(+1.66)#7 | 0.076%(+1.74)#131 |
| 8. | East Renton Highlands | 1.58% | 0.15%(+1.43)#8 | 0.076%(+1.51)#155 |
| 9. | Rocky Point | 1.29% | 0.15%(+1.14)#9 | 0.076%(+1.22)#197 |
| 10. | Fairwood Cdp King County | 1.13% | 0.15%(+0.974)#10 | 0.076%(+1.05)#235 |
| 11. | Hobart | 1.10% | 0.15%(+0.950)#11 | 0.076%(+1.03)#244 |
| 12. | Mill Creek | 0.92% | 0.15%(+0.764)#12 | 0.076%(+0.843)#277 |
| 13. | Renton | 0.90% | 0.15%(+0.742)#13 | 0.076%(+0.820)#281 |
| 14. | Mount Vista | 0.88% | 0.15%(+0.731)#14 | 0.076%(+0.809)#287 |
| 15. | Frederickson | 0.85% | 0.15%(+0.695)#15 | 0.076%(+0.773)#299 |
| 16. | Grand Mound | 0.81% | 0.15%(+0.659)#16 | 0.076%(+0.738)#308 |
| 17. | Everett | 0.77% | 0.15%(+0.612)#17 | 0.076%(+0.690)#322 |
| 18. | Picnic Point | 0.74% | 0.15%(+0.589)#18 | 0.076%(+0.668)#329 |
| 19. | Hazel Dell | 0.71% | 0.15%(+0.559)#19 | 0.076%(+0.637)#337 |
| 20. | Covington | 0.68% | 0.15%(+0.528)#20 | 0.076%(+0.606)#349 |
| 21. | Kent | 0.68% | 0.15%(+0.522)#21 | 0.076%(+0.600)#355 |
| 22. | Birch Bay | 0.64% | 0.15%(+0.483)#22 | 0.076%(+0.561)#373 |
| 23. | Poulsbo | 0.63% | 0.15%(+0.472)#23 | 0.076%(+0.550)#379 |
| 24. | Venersborg | 0.62% | 0.15%(+0.463)#24 | 0.076%(+0.541)#383 |
| 25. | Des Moines | 0.61% | 0.15%(+0.452)#25 | 0.076%(+0.530)#388 |
| 26. | Soap Lake | 0.58% | 0.15%(+0.426)#26 | 0.076%(+0.505)#404 |
| 27. | Alderwood Manor | 0.56% | 0.15%(+0.406)#27 | 0.076%(+0.485)#416 |
| 28. | Three Lakes | 0.53% | 0.15%(+0.378)#28 | 0.076%(+0.456)#441 |
| 29. | Tacoma | 0.51% | 0.15%(+0.356)#29 | 0.076%(+0.435)#457 |
| 30. | Bryn Mawr Skyway | 0.51% | 0.15%(+0.356)#30 | 0.076%(+0.434)#458 |
| 31. | Artondale | 0.50% | 0.15%(+0.344)#31 | 0.076%(+0.422)#467 |
| 32. | Tukwila | 0.49% | 0.15%(+0.337)#32 | 0.076%(+0.416)#471 |
| 33. | Lakeland South | 0.44% | 0.15%(+0.290)#33 | 0.076%(+0.368)#503 |
| 34. | Seatac | 0.38% | 0.15%(+0.227)#34 | 0.076%(+0.306)#559 |
| 35. | Cottage Lake | 0.37% | 0.15%(+0.220)#35 | 0.076%(+0.299)#565 |
| 36. | Issaquah | 0.36% | 0.15%(+0.201)#36 | 0.076%(+0.280)#584 |
| 37. | Sammamish | 0.35% | 0.15%(+0.197)#37 | 0.076%(+0.276)#587 |
| 38. | Puyallup | 0.34% | 0.15%(+0.184)#38 | 0.076%(+0.262)#600 |
| 39. | Maple Valley | 0.33% | 0.15%(+0.176)#39 | 0.076%(+0.254)#611 |
| 40. | Snohomish | 0.32% | 0.15%(+0.162)#40 | 0.076%(+0.240)#628 |
| 41. | North Lynnwood | 0.31% | 0.15%(+0.155)#41 | 0.076%(+0.234)#640 |
| 42. | Normandy Park | 0.30% | 0.15%(+0.144)#42 | 0.076%(+0.223)#652 |
| 43. | East Wenatchee | 0.29% | 0.15%(+0.137)#43 | 0.076%(+0.216)#666 |
| 44. | Pacific | 0.28% | 0.15%(+0.128)#44 | 0.076%(+0.206)#684 |
| 45. | Federal Way | 0.27% | 0.15%(+0.115)#45 | 0.076%(+0.193)#703 |
| 46. | Lake Morton Berrydale | 0.26% | 0.15%(+0.104)#46 | 0.076%(+0.182)#723 |
| 47. | Parkland | 0.25% | 0.15%(+0.095)#47 | 0.076%(+0.173)#742 |
| 48. | Lake Stickney | 0.22% | 0.15%(+0.071)#48 | 0.076%(+0.149)#790 |
| 49. | Ellensburg | 0.22% | 0.15%(+0.067)#49 | 0.076%(+0.145)#803 |
| 50. | Bothell West | 0.20% | 0.15%(+0.050)#50 | 0.076%(+0.129)#832 |
| 51. | Lake Stevens | 0.20% | 0.15%(+0.044)#51 | 0.076%(+0.123)#852 |
| 52. | Edgewood | 0.19% | 0.15%(+0.039)#52 | 0.076%(+0.118)#871 |
| 53. | Warm Beach | 0.19% | 0.15%(+0.036)#53 | 0.076%(+0.114)#882 |
| 54. | Seattle | 0.19% | 0.15%(+0.035)#54 | 0.076%(+0.113)#884 |
| 55. | Vancouver | 0.19% | 0.15%(+0.032)#55 | 0.076%(+0.111)#890 |
| 56. | Bellevue | 0.18% | 0.15%(+0.027)#56 | 0.076%(+0.105)#905 |
| 57. | Barberton | 0.16% | 0.15%(+0.009)#57 | 0.076%(+0.088)#952 |
| 58. | Newcastle | 0.16% | 0.15%(+0.008)#58 | 0.076%(+0.087)#956 |
| 59. | White Center | 0.16% | 0.15%(+0.001)#59 | 0.076%(+0.079)#984 |
| 60. | Bothell | 0.15% | 0.15%(-0.002)#60 | 0.076%(+0.077)#991 |
| 61. | Oak Harbor | 0.13% | 0.15%(-0.019)#61 | 0.076%(+0.059)#1,040 |
| 62. | Kirkland | 0.13% | 0.15%(-0.025)#62 | 0.076%(+0.054)#1,057 |
| 63. | Burien | 0.11% | 0.15%(-0.040)#63 | 0.076%(+0.039)#1,103 |
| 64. | Aberdeen | 0.11% | 0.15%(-0.042)#64 | 0.076%(+0.036)#1,118 |
| 65. | Orchards | 0.11% | 0.15%(-0.045)#65 | 0.076%(+0.034)#1,132 |
| 66. | Sumner | 0.10% | 0.15%(-0.050)#66 | 0.076%(+0.028)#1,154 |
| 67. | Graham | 0.10% | 0.15%(-0.054)#67 | 0.076%(+0.025)#1,164 |
| 68. | Kennewick | 0.098% | 0.15%(-0.056)#68 | 0.076%(+0.022)#1,170 |
| 69. | Auburn | 0.096% | 0.15%(-0.058)#69 | 0.076%(+0.020)#1,178 |
| 70. | Connell | 0.077% | 0.15%(-0.077)#70 | 0.076%(+0.002)#1,270 |
| 71. | South Hill | 0.077% | 0.15%(-0.078)#71 | 0.076%(+0.001)#1,274 |
| 72. | Battle Ground | 0.077% | 0.15%(-0.078)#72 | 0.076%(+0.001)#1,275 |
| 73. | Dayton | 0.072% | 0.15%(-0.082)#73 | 0.076%(-0.003)#1,299 |
| 74. | Olympia | 0.069% | 0.15%(-0.085)#74 | 0.076%(-0.007)#1,313 |
| 75. | University Place | 0.066% | 0.15%(-0.088)#75 | 0.076%(-0.010)#1,322 |
| 76. | Longview | 0.066% | 0.15%(-0.088)#76 | 0.076%(-0.010)#1,324 |
| 77. | Mount Vernon | 0.065% | 0.15%(-0.089)#77 | 0.076%(-0.010)#1,329 |
| 78. | Bellingham | 0.057% | 0.15%(-0.097)#78 | 0.076%(-0.019)#1,371 |
| 79. | Cheney | 0.054% | 0.15%(-0.100)#79 | 0.076%(-0.021)#1,383 |
| 80. | Monroe | 0.051% | 0.15%(-0.103)#80 | 0.076%(-0.025)#1,400 |
| 81. | Suquamish | 0.046% | 0.15%(-0.108)#81 | 0.076%(-0.030)#1,429 |
| 82. | Lynnwood | 0.045% | 0.15%(-0.109)#82 | 0.076%(-0.031)#1,435 |
| 83. | Bonney Lake | 0.044% | 0.15%(-0.110)#83 | 0.076%(-0.032)#1,442 |
| 84. | Edmonds | 0.042% | 0.15%(-0.112)#84 | 0.076%(-0.034)#1,461 |
| 85. | Richland | 0.039% | 0.15%(-0.115)#85 | 0.076%(-0.036)#1,485 |
| 86. | Eastmont | 0.039% | 0.15%(-0.115)#86 | 0.076%(-0.037)#1,494 |
| 87. | Marysville | 0.034% | 0.15%(-0.120)#87 | 0.076%(-0.042)#1,527 |
| 88. | Pasco | 0.034% | 0.15%(-0.121)#88 | 0.076%(-0.042)#1,529 |
| 89. | Walla Walla | 0.033% | 0.15%(-0.122)#89 | 0.076%(-0.043)#1,534 |
| 90. | Shoreline | 0.020% | 0.15%(-0.134)#90 | 0.076%(-0.055)#1,631 |
| 91. | Redmond | 0.019% | 0.15%(-0.135)#91 | 0.076%(-0.057)#1,645 |
| 92. | Spokane | 0.018% | 0.15%(-0.136)#92 | 0.076%(-0.057)#1,655 |
| 93. | Lacey | 0.016% | 0.15%(-0.138)#93 | 0.076%(-0.060)#1,675 |
Common Questions
What are the Top 10 Cities with the Highest Percentage of Malaysian Population in Washington?
Top 10 Cities with the Highest Percentage of Malaysian Population in Washington are:
#1
7.44%
#2
5.88%
#3
5.00%
#4
3.82%
#5
3.62%
#6
2.23%
#7
1.81%
#8
1.58%
#9
1.29%
#10
1.10%
What city has the Highest Percentage of Malaysian Population in Washington?
Bell Hill has the Highest Percentage of Malaysian Population in Washington with 7.44%.
What is the Percentage of Malaysian Population in the State of Washington?
Percentage of Malaysian Population in Washington is 0.15%.
What is the Percentage of Malaysian Population in the United States?
Percentage of Malaysian Population in the United States is 0.076%.