Cliffdell, WA Map & Demographics
Cliffdell Map
Cliffdell Overview
$65,080
PER CAPITA INCOME
0.37
INEQUALITY / GINI INDEX
61
TOTAL POPULATION
36
MALE POPULATION
25
FEMALE POPULATION
144.00
MALES / 100 FEMALES
69.44
FEMALES / 100 MALES
58.9
MEDIAN AGE
1.9
AVG FAMILY SIZE
1.8
AVG HOUSEHOLD SIZE
36
LABOR FORCE [ PEOPLE ]
59.0%
PERCENT IN LABOR FORCE
2.8%
UNEMPLOYMENT RATE
Income in Cliffdell
Income Overview in Cliffdell
| Characteristic | Number | Measure |
| Per Capita Income | 61 | $65,080 |
| Median Family Income | 15 | $0 |
| Mean Family Income | 15 | $0 |
| Median Household Income | 33 | $0 |
| Mean Household Income | 33 | $120,694 |
| Income Deficit | 15 | $0 |
| Wage / Income Gap (%) | 61 | 0.00% |
| Wage / Income Gap ($) | 61 | 100.00¢ per $1 |
| Gini / Inequality Index | 61 | 0.37 |
Earnings by Sex in Cliffdell
| Sex | Number | Average Earnings |
| Male | 25 (69.4%) | $0 |
| Female | 11 (30.6%) | $0 |
| Total | 36 (100.0%) | $0 |
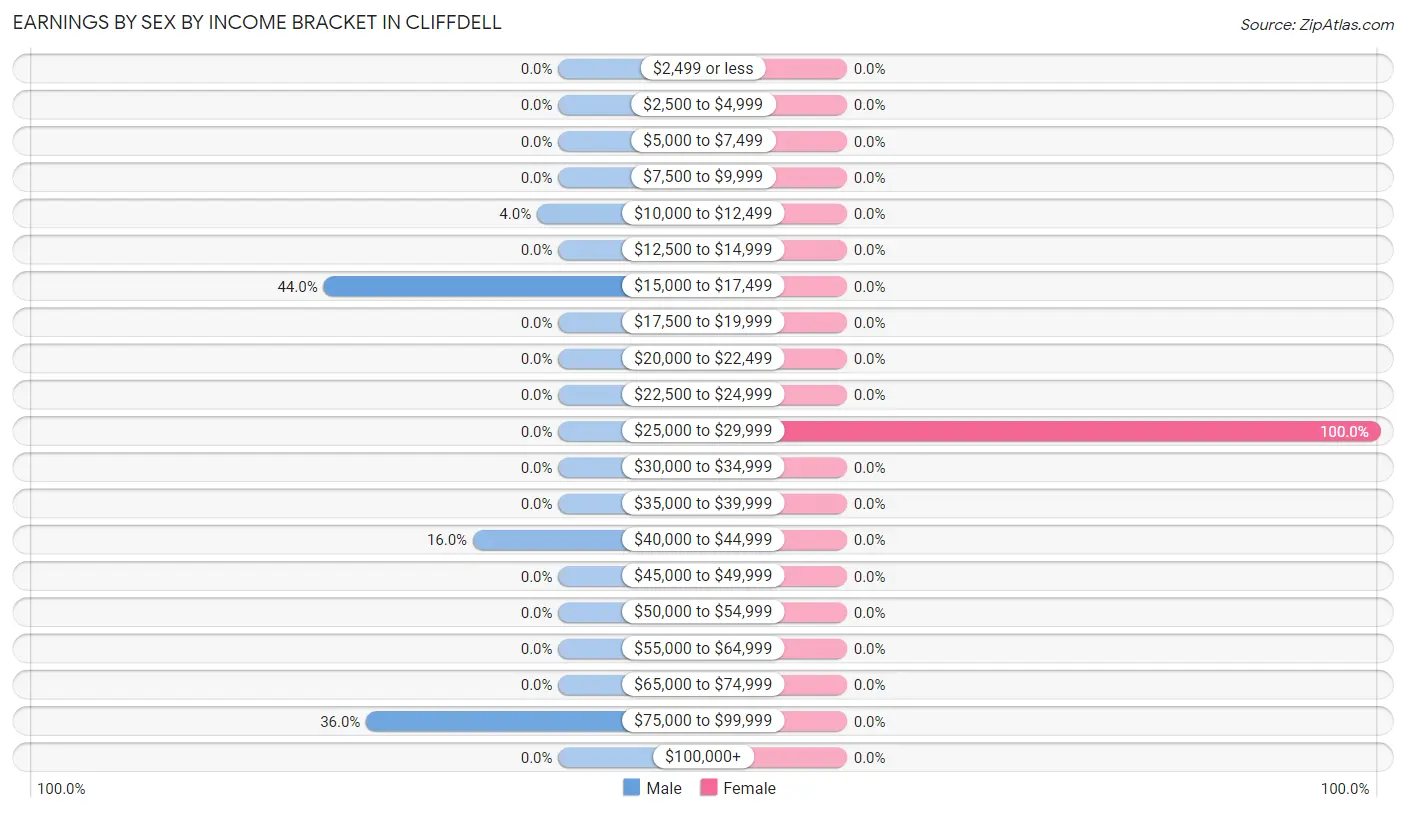
Earnings by Sex by Income Bracket in Cliffdell
The most common earnings brackets in Cliffdell are $15,000 to $17,499 for men (11 | 44.0%) and $25,000 to $29,999 for women (11 | 100.0%).
| Income | Male | Female |
| $2,499 or less | 0 (0.0%) | 0 (0.0%) |
| $2,500 to $4,999 | 0 (0.0%) | 0 (0.0%) |
| $5,000 to $7,499 | 0 (0.0%) | 0 (0.0%) |
| $7,500 to $9,999 | 0 (0.0%) | 0 (0.0%) |
| $10,000 to $12,499 | 1 (4.0%) | 0 (0.0%) |
| $12,500 to $14,999 | 0 (0.0%) | 0 (0.0%) |
| $15,000 to $17,499 | 11 (44.0%) | 0 (0.0%) |
| $17,500 to $19,999 | 0 (0.0%) | 0 (0.0%) |
| $20,000 to $22,499 | 0 (0.0%) | 0 (0.0%) |
| $22,500 to $24,999 | 0 (0.0%) | 0 (0.0%) |
| $25,000 to $29,999 | 0 (0.0%) | 11 (100.0%) |
| $30,000 to $34,999 | 0 (0.0%) | 0 (0.0%) |
| $35,000 to $39,999 | 0 (0.0%) | 0 (0.0%) |
| $40,000 to $44,999 | 4 (16.0%) | 0 (0.0%) |
| $45,000 to $49,999 | 0 (0.0%) | 0 (0.0%) |
| $50,000 to $54,999 | 0 (0.0%) | 0 (0.0%) |
| $55,000 to $64,999 | 0 (0.0%) | 0 (0.0%) |
| $65,000 to $74,999 | 0 (0.0%) | 0 (0.0%) |
| $75,000 to $99,999 | 9 (36.0%) | 0 (0.0%) |
| $100,000+ | 0 (0.0%) | 0 (0.0%) |
| Total | 25 (100.0%) | 11 (100.0%) |
Earnings by Sex by Educational Attainment in Cliffdell
| Educational Attainment | Male Income | Female Income |
| Less than High School | - | - |
| High School Diploma | - | - |
| College or Associate's Degree | - | - |
| Bachelor's Degree | - | - |
| Graduate Degree | - | - |
| Total | - | - |
Family Income in Cliffdell
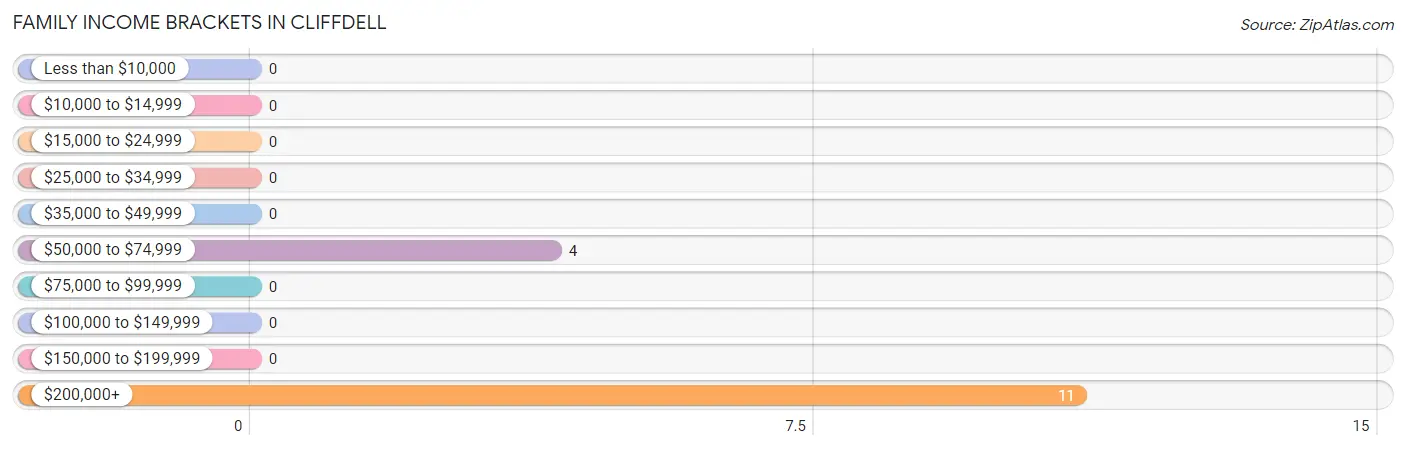
Family Income Brackets in Cliffdell
According to the Cliffdell family income data, there are 11 families falling into the $200,000+ income range, which is the most common income bracket and makes up 73.3% of all families.
| Income Bracket | # Families | % Families |
| Less than $10,000 | 0 | 0.0% |
| $10,000 to $14,999 | 0 | 0.0% |
| $15,000 to $24,999 | 0 | 0.0% |
| $25,000 to $34,999 | 0 | 0.0% |
| $35,000 to $49,999 | 0 | 0.0% |
| $50,000 to $74,999 | 4 | 26.7% |
| $75,000 to $99,999 | 0 | 0.0% |
| $100,000 to $149,999 | 0 | 0.0% |
| $150,000 to $199,999 | 0 | 0.0% |
| $200,000+ | 11 | 73.3% |
Family Income by Famaliy Size in Cliffdell
| Income Bracket | # Families | Median Income |
| 2-Person Families | 15 (100.0%) | $0 |
| 3-Person Families | 0 (0.0%) | $0 |
| 4-Person Families | 0 (0.0%) | $0 |
| 5-Person Families | 0 (0.0%) | $0 |
| 6-Person Families | 0 (0.0%) | $0 |
| 7+ Person Families | 0 (0.0%) | $0 |
| Total | 15 (100.0%) | $0 |
Family Income by Number of Earners in Cliffdell
| Number of Earners | # Families | Median Income |
| No Earners | 0 (0.0%) | $0 |
| 1 Earner | 15 (100.0%) | $0 |
| 2 Earners | 0 (0.0%) | $0 |
| 3+ Earners | 0 (0.0%) | $0 |
| Total | 15 (100.0%) | $0 |
Household Income in Cliffdell
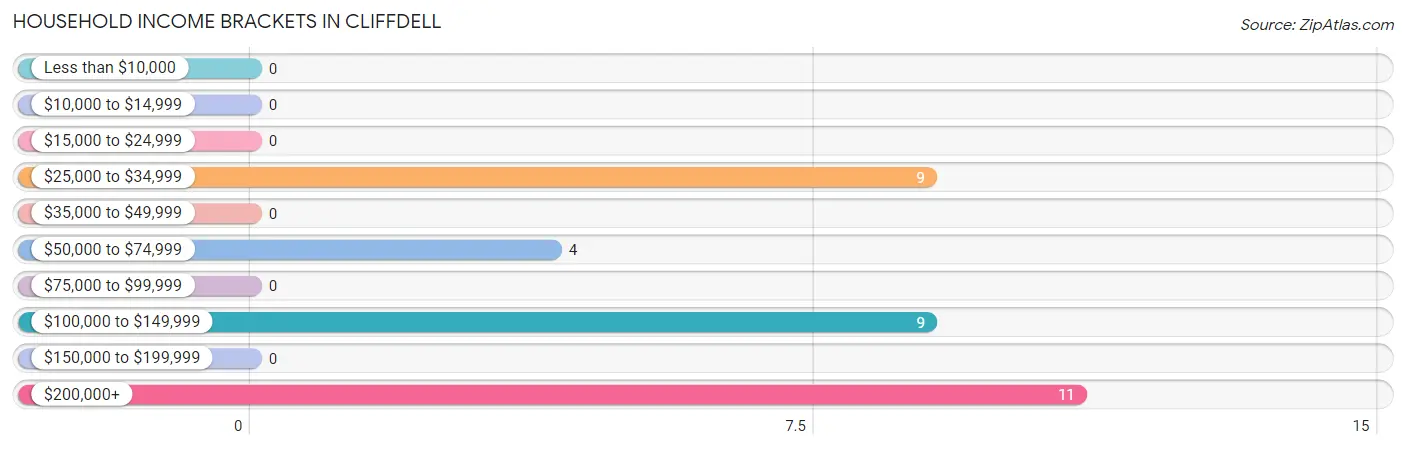
Household Income Brackets in Cliffdell
With 11 households falling in the category, the $200,000+ income range is the most frequent in Cliffdell, accounting for 33.3% of all households.
| Income Bracket | # Households | % Households |
| Less than $10,000 | 0 | 0.0% |
| $10,000 to $14,999 | 0 | 0.0% |
| $15,000 to $24,999 | 0 | 0.0% |
| $25,000 to $34,999 | 9 | 27.3% |
| $35,000 to $49,999 | 0 | 0.0% |
| $50,000 to $74,999 | 4 | 12.1% |
| $75,000 to $99,999 | 0 | 0.0% |
| $100,000 to $149,999 | 9 | 27.3% |
| $150,000 to $199,999 | 0 | 0.0% |
| $200,000+ | 11 | 33.3% |
Household Income by Householder Age in Cliffdell
| Income Bracket | # Households | Median Income |
| 15 to 24 Years | 0 (0.0%) | $0 |
| 25 to 44 Years | 9 (27.3%) | $0 |
| 45 to 64 Years | 13 (39.4%) | $0 |
| 65+ Years | 11 (33.3%) | $0 |
| Total | 33 (100.0%) | $0 |
Poverty in Cliffdell
Income Below Poverty by Sex and Age in Cliffdell
With 5.6% poverty level for males and 40.0% for females among the residents of Cliffdell, 45 to 54 year old males and 25 to 34 year old females are the most vulnerable to poverty, with 1 males (100.0%) and 1 females (100.0%) in their respective age groups living below the poverty level.
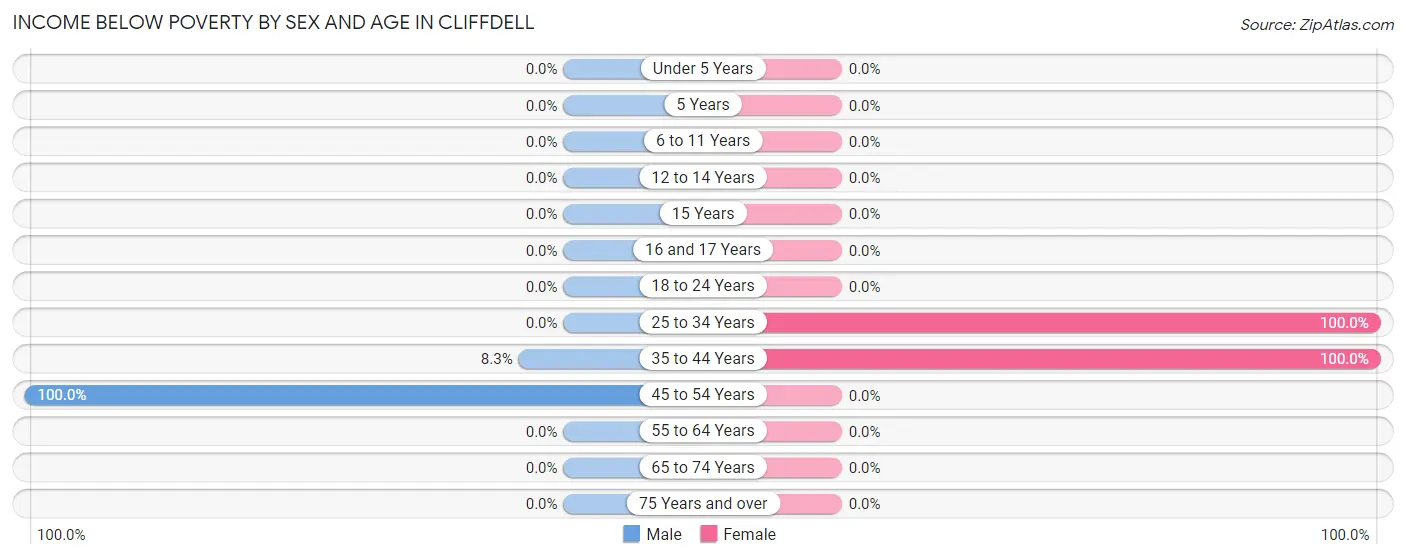
| Age Bracket | Male | Female |
| Under 5 Years | 0 (0.0%) | 0 (0.0%) |
| 5 Years | 0 (0.0%) | 0 (0.0%) |
| 6 to 11 Years | 0 (0.0%) | 0 (0.0%) |
| 12 to 14 Years | 0 (0.0%) | 0 (0.0%) |
| 15 Years | 0 (0.0%) | 0 (0.0%) |
| 16 and 17 Years | 0 (0.0%) | 0 (0.0%) |
| 18 to 24 Years | 0 (0.0%) | 0 (0.0%) |
| 25 to 34 Years | 0 (0.0%) | 1 (100.0%) |
| 35 to 44 Years | 1 (8.3%) | 9 (100.0%) |
| 45 to 54 Years | 1 (100.0%) | 0 (0.0%) |
| 55 to 64 Years | 0 (0.0%) | 0 (0.0%) |
| 65 to 74 Years | 0 (0.0%) | 0 (0.0%) |
| 75 Years and over | 0 (0.0%) | 0 (0.0%) |
| Total | 2 (5.6%) | 10 (40.0%) |
Income Above Poverty by Sex and Age in Cliffdell
According to the poverty statistics in Cliffdell, males aged 55 to 64 years and females aged 55 to 64 years are the age groups that are most secure financially, with 100.0% of males and 100.0% of females in these age groups living above the poverty line.
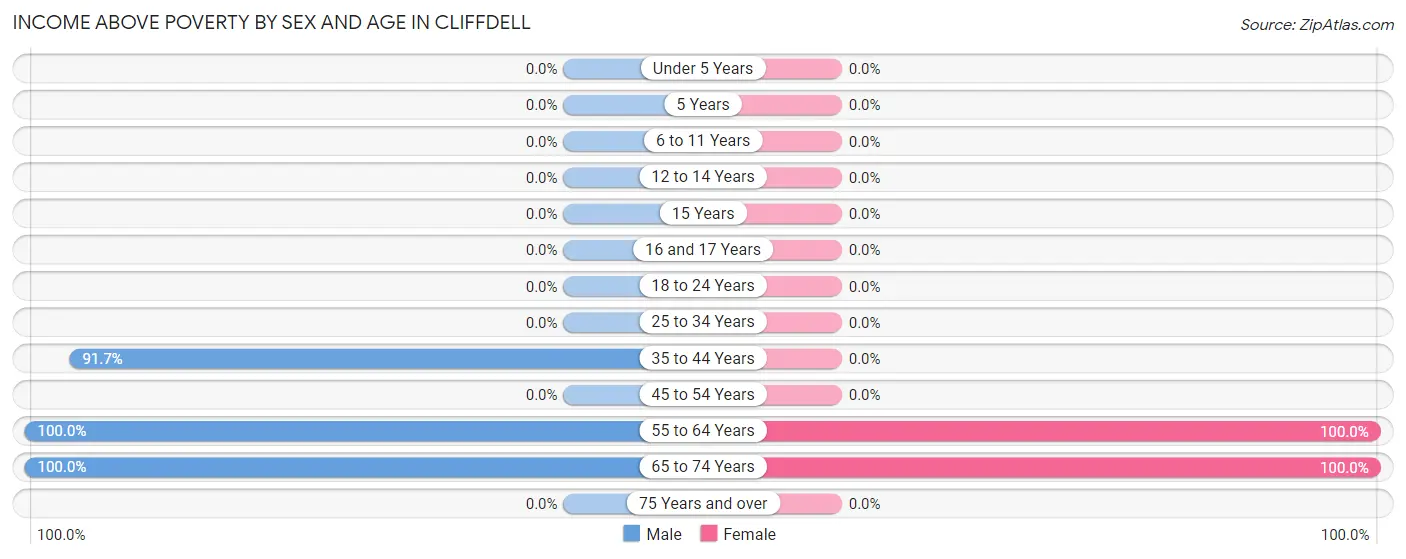
| Age Bracket | Male | Female |
| Under 5 Years | 0 (0.0%) | 0 (0.0%) |
| 5 Years | 0 (0.0%) | 0 (0.0%) |
| 6 to 11 Years | 0 (0.0%) | 0 (0.0%) |
| 12 to 14 Years | 0 (0.0%) | 0 (0.0%) |
| 15 Years | 0 (0.0%) | 0 (0.0%) |
| 16 and 17 Years | 0 (0.0%) | 0 (0.0%) |
| 18 to 24 Years | 0 (0.0%) | 0 (0.0%) |
| 25 to 34 Years | 0 (0.0%) | 0 (0.0%) |
| 35 to 44 Years | 11 (91.7%) | 0 (0.0%) |
| 45 to 54 Years | 0 (0.0%) | 0 (0.0%) |
| 55 to 64 Years | 13 (100.0%) | 4 (100.0%) |
| 65 to 74 Years | 10 (100.0%) | 11 (100.0%) |
| 75 Years and over | 0 (0.0%) | 0 (0.0%) |
| Total | 34 (94.4%) | 15 (60.0%) |
Income Below Poverty Among Married-Couple Families in Cliffdell
| Children | Above Poverty | Below Poverty |
| No Children | 15 (100.0%) | 0 (0.0%) |
| 1 or 2 Children | 0 (0.0%) | 0 (0.0%) |
| 3 or 4 Children | 0 (0.0%) | 0 (0.0%) |
| 5 or more Children | 0 (0.0%) | 0 (0.0%) |
| Total | 15 (100.0%) | 0 (0.0%) |
Income Below Poverty Among Single-Parent Households in Cliffdell
| Children | Single Father | Single Mother |
| No Children | 0 (0.0%) | 0 (0.0%) |
| 1 or 2 Children | 0 (0.0%) | 0 (0.0%) |
| 3 or 4 Children | 0 (0.0%) | 0 (0.0%) |
| 5 or more Children | 0 (0.0%) | 0 (0.0%) |
| Total | 0 (0.0%) | 0 (0.0%) |
Income Below Poverty Among Married-Couple vs Single-Parent Households in Cliffdell
| Children | Married-Couple Families | Single-Parent Households |
| No Children | 0 (0.0%) | 0 (0.0%) |
| 1 or 2 Children | 0 (0.0%) | 0 (0.0%) |
| 3 or 4 Children | 0 (0.0%) | 0 (0.0%) |
| 5 or more Children | 0 (0.0%) | 0 (0.0%) |
| Total | 0 (0.0%) | 0 (0.0%) |
Race in Cliffdell
The most populous races in Cliffdell are , and White / Caucasian (61 | 100.0%).
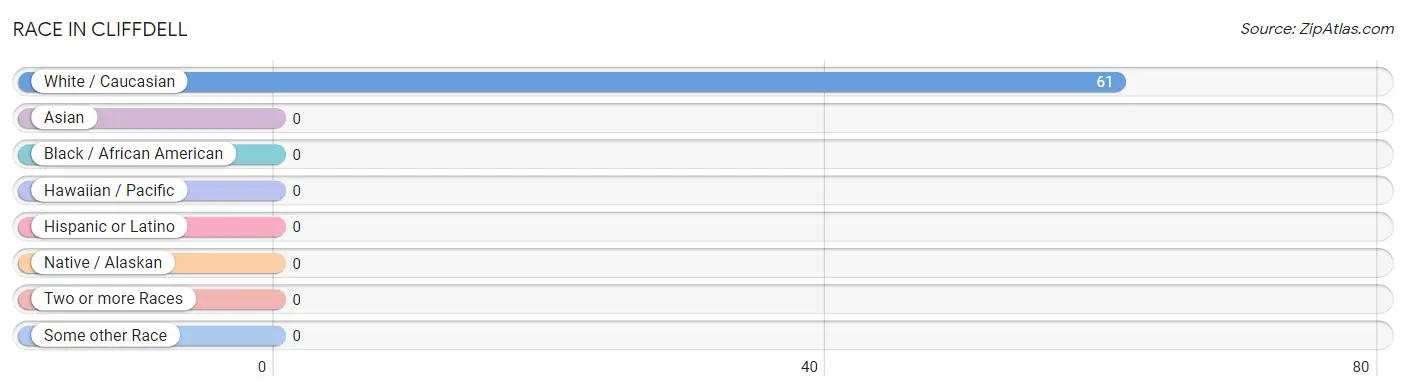
| Race | # Population | % Population |
| Asian | 0 | 0.0% |
| Black / African American | 0 | 0.0% |
| Hawaiian / Pacific | 0 | 0.0% |
| Hispanic or Latino | 0 | 0.0% |
| Native / Alaskan | 0 | 0.0% |
| White / Caucasian | 61 | 100.0% |
| Two or more Races | 0 | 0.0% |
| Some other Race | 0 | 0.0% |
| Total | 61 | 100.0% |
Ancestry in Cliffdell
The most populous ancestries reported in Cliffdell are German (14 | 23.0%), Norwegian (11 | 18.0%), English (9 | 14.7%), Italian (5 | 8.2%), and European (1 | 1.6%), together accounting for 65.6% of all Cliffdell residents.
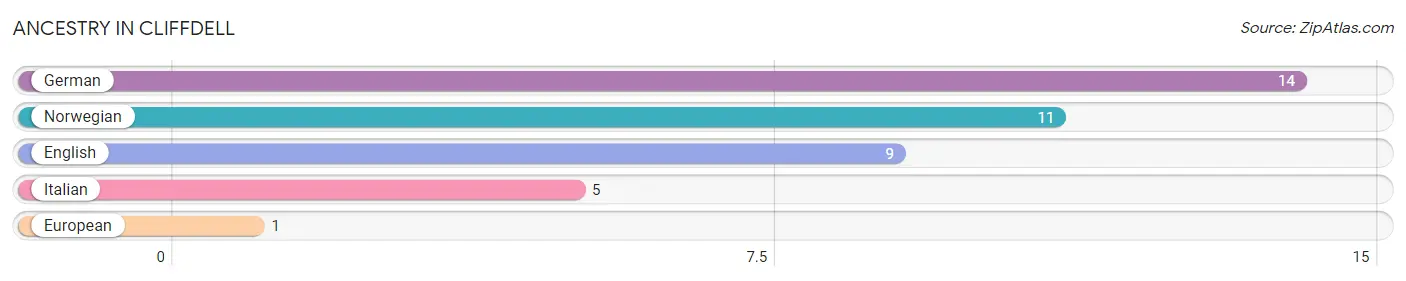
| Ancestry | # Population | % Population |
| English | 9 | 14.7% |
| European | 1 | 1.6% |
| German | 14 | 23.0% |
| Italian | 5 | 8.2% |
| Norwegian | 11 | 18.0% | View All 5 Rows |
Immigrants in Cliffdell

| Immigration Origin | # Population | % Population | View All 0 Rows |
Sex and Age in Cliffdell
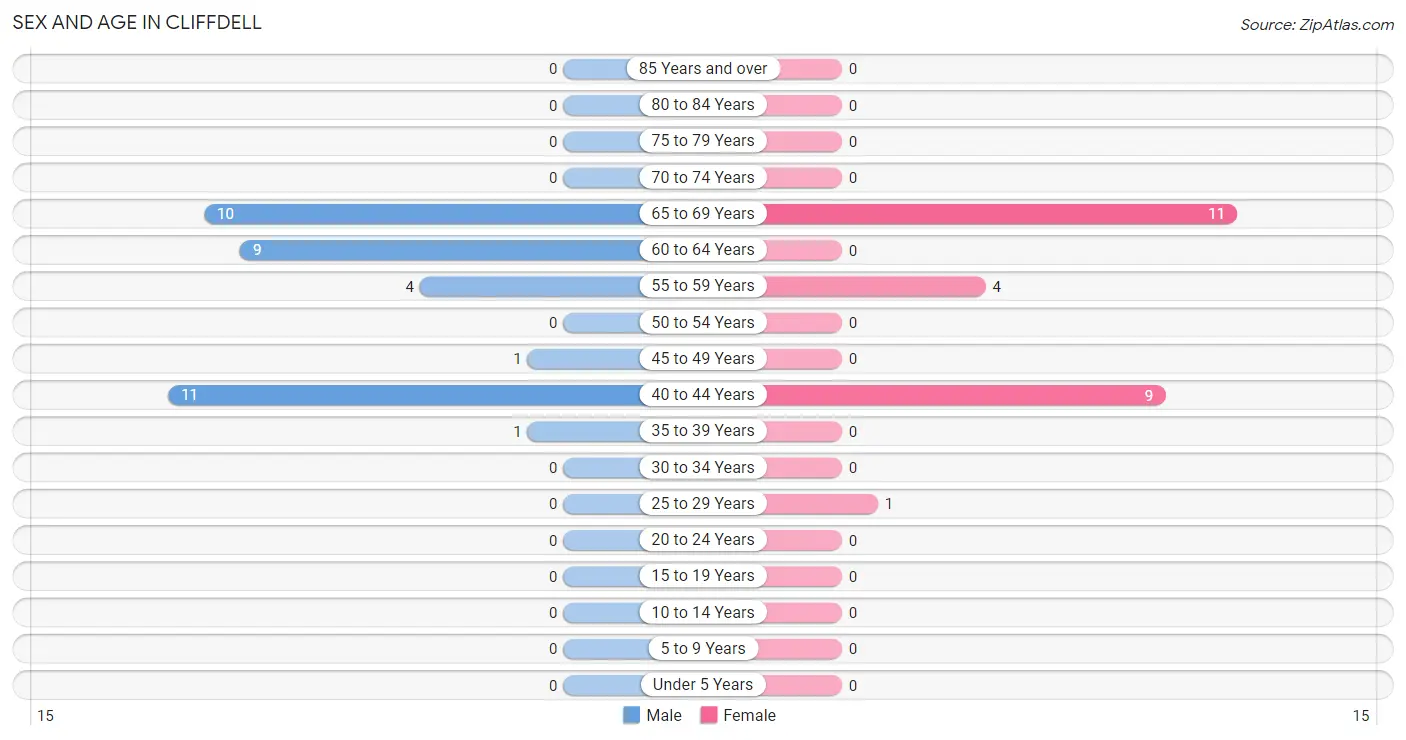
Sex and Age in Cliffdell
The most populous age groups in Cliffdell are 40 to 44 Years (11 | 30.6%) for men and 65 to 69 Years (11 | 44.0%) for women.
| Age Bracket | Male | Female |
| Under 5 Years | 0 (0.0%) | 0 (0.0%) |
| 5 to 9 Years | 0 (0.0%) | 0 (0.0%) |
| 10 to 14 Years | 0 (0.0%) | 0 (0.0%) |
| 15 to 19 Years | 0 (0.0%) | 0 (0.0%) |
| 20 to 24 Years | 0 (0.0%) | 0 (0.0%) |
| 25 to 29 Years | 0 (0.0%) | 1 (4.0%) |
| 30 to 34 Years | 0 (0.0%) | 0 (0.0%) |
| 35 to 39 Years | 1 (2.8%) | 0 (0.0%) |
| 40 to 44 Years | 11 (30.6%) | 9 (36.0%) |
| 45 to 49 Years | 1 (2.8%) | 0 (0.0%) |
| 50 to 54 Years | 0 (0.0%) | 0 (0.0%) |
| 55 to 59 Years | 4 (11.1%) | 4 (16.0%) |
| 60 to 64 Years | 9 (25.0%) | 0 (0.0%) |
| 65 to 69 Years | 10 (27.8%) | 11 (44.0%) |
| 70 to 74 Years | 0 (0.0%) | 0 (0.0%) |
| 75 to 79 Years | 0 (0.0%) | 0 (0.0%) |
| 80 to 84 Years | 0 (0.0%) | 0 (0.0%) |
| 85 Years and over | 0 (0.0%) | 0 (0.0%) |
| Total | 36 (100.0%) | 25 (100.0%) |
Families and Households in Cliffdell
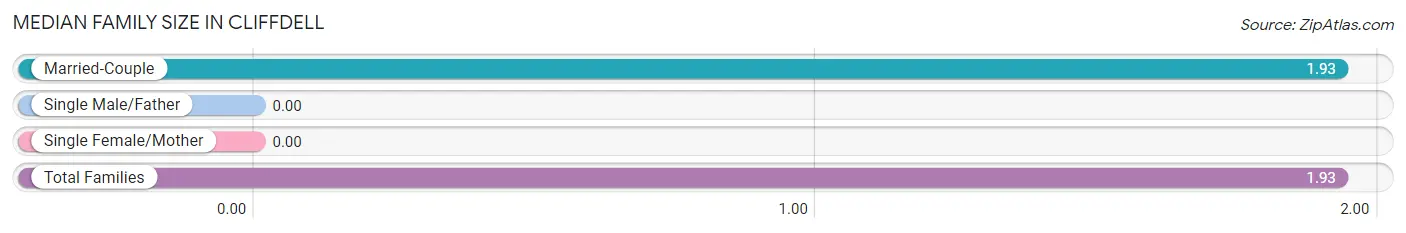
Median Family Size in Cliffdell
| Family Type | # Families | Family Size |
| Married-Couple | 15 (100.0%) | 1.93 |
| Single Male/Father | 0 (0.0%) | - |
| Single Female/Mother | 0 (0.0%) | - |
| Total Families | 15 (100.0%) | 1.93 |
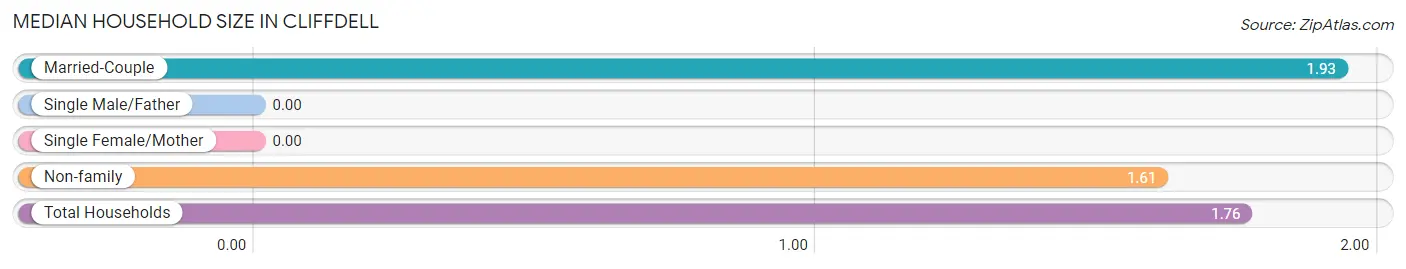
Median Household Size in Cliffdell
| Household Type | # Households | Household Size |
| Married-Couple | 15 (45.5%) | 1.93 |
| Single Male/Father | 0 (0.0%) | - |
| Single Female/Mother | 0 (0.0%) | - |
| Non-family | 18 (54.5%) | 1.61 |
| Total Households | 33 (100.0%) | 1.76 |
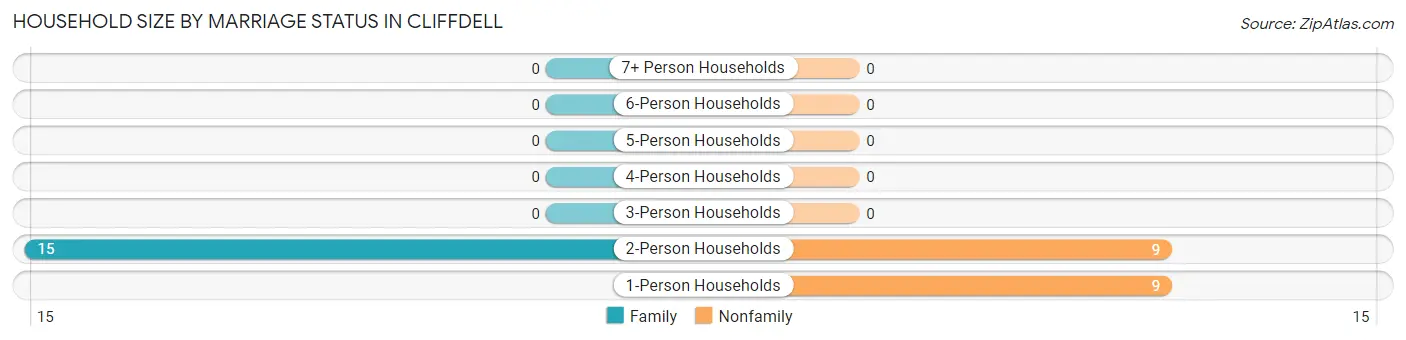
Household Size by Marriage Status in Cliffdell
Out of a total of 33 households in Cliffdell, 15 (45.5%) are family households, while 18 (54.5%) are nonfamily households. The most numerous type of family households are 2-person households, comprising 15, and the most common type of nonfamily households are 1-person households, comprising 9.
| Household Size | Family Households | Nonfamily Households |
| 1-Person Households | - | 9 (27.3%) |
| 2-Person Households | 15 (45.5%) | 9 (27.3%) |
| 3-Person Households | 0 (0.0%) | 0 (0.0%) |
| 4-Person Households | 0 (0.0%) | 0 (0.0%) |
| 5-Person Households | 0 (0.0%) | 0 (0.0%) |
| 6-Person Households | 0 (0.0%) | 0 (0.0%) |
| 7+ Person Households | 0 (0.0%) | 0 (0.0%) |
| Total | 15 (45.5%) | 18 (54.5%) |
Female Fertility in Cliffdell
Fertility by Age in Cliffdell
Average fertility rate in Cliffdell is 100.0 births per 1,000 women. Women in the age bracket of 20 to 34 years have the highest fertility rate with 1,000.0 births per 1,000 women. Women in the age bracket of 20 to 34 years acount for 100.0% of all women with births.
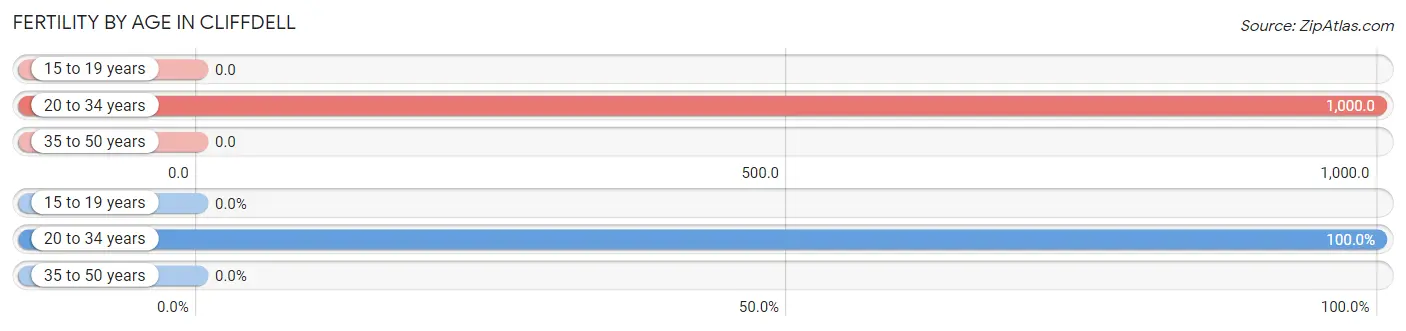
| Age Bracket | Women with Births | Births / 1,000 Women |
| 15 to 19 years | 0 (0.0%) | 0.0 |
| 20 to 34 years | 1 (100.0%) | 1,000.0 |
| 35 to 50 years | 0 (0.0%) | 0.0 |
| Total | 1 (100.0%) | 100.0 |
Fertility by Age by Marriage Status in Cliffdell
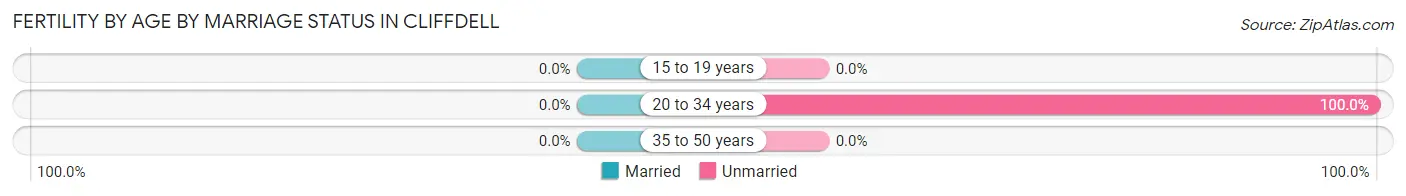
| Age Bracket | Married | Unmarried |
| 15 to 19 years | 0 (0.0%) | 0 (0.0%) |
| 20 to 34 years | 0 (0.0%) | 1 (100.0%) |
| 35 to 50 years | 0 (0.0%) | 0 (0.0%) |
| Total | 0 (0.0%) | 1 (100.0%) |
Fertility by Education in Cliffdell
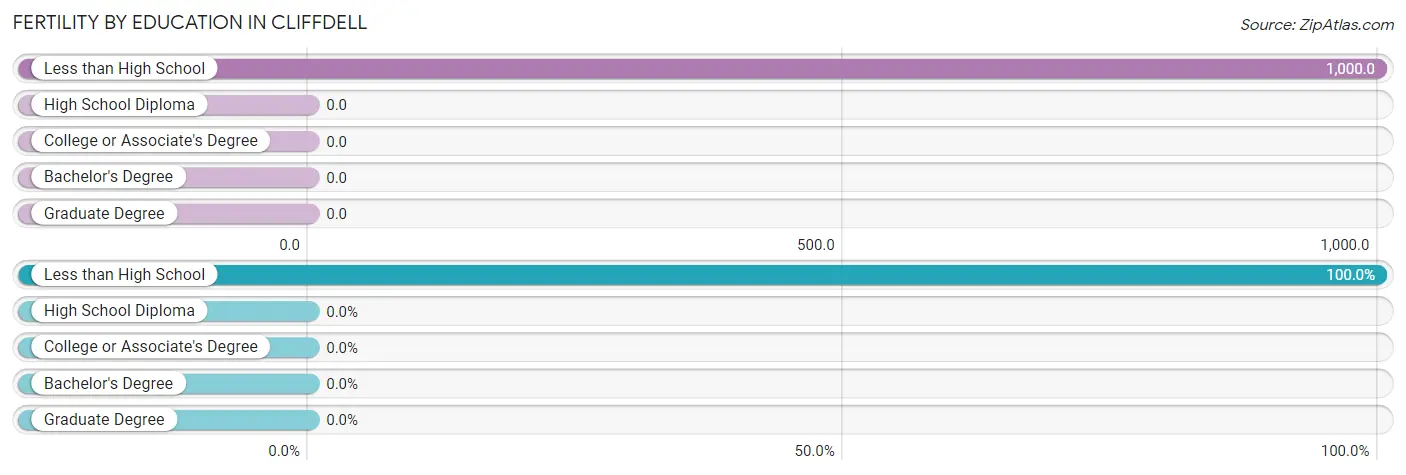
| Educational Attainment | Women with Births | Births / 1,000 Women |
| Less than High School | 1 (100.0%) | 1,000.0 |
| High School Diploma | 0 (0.0%) | 0.0 |
| College or Associate's Degree | 0 (0.0%) | 0.0 |
| Bachelor's Degree | 0 (0.0%) | 0.0 |
| Graduate Degree | 0 (0.0%) | 0.0 |
| Total | 1 (100.0%) | 100.0 |
Fertility by Education by Marriage Status in Cliffdell
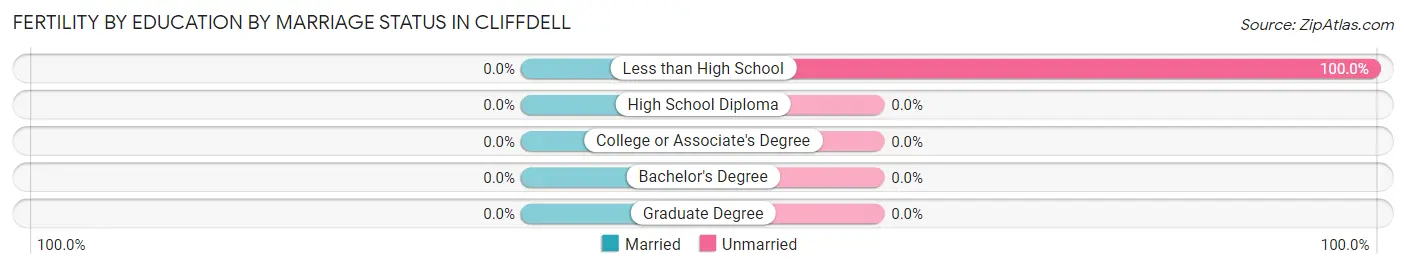
| Educational Attainment | Married | Unmarried |
| Less than High School | 0 (0.0%) | 1 (100.0%) |
| High School Diploma | 0 (0.0%) | 0 (0.0%) |
| College or Associate's Degree | 0 (0.0%) | 0 (0.0%) |
| Bachelor's Degree | 0 (0.0%) | 0 (0.0%) |
| Graduate Degree | 0 (0.0%) | 0 (0.0%) |
| Total | 0 (0.0%) | 1 (100.0%) |
Employment Characteristics in Cliffdell
Employment by Class of Employer in Cliffdell
Among the 35 employed individuals in Cliffdell, private company employees (31 | 88.6%), and self-employed (not incorporated) (4 | 11.4%) make up the most common classes of employment.
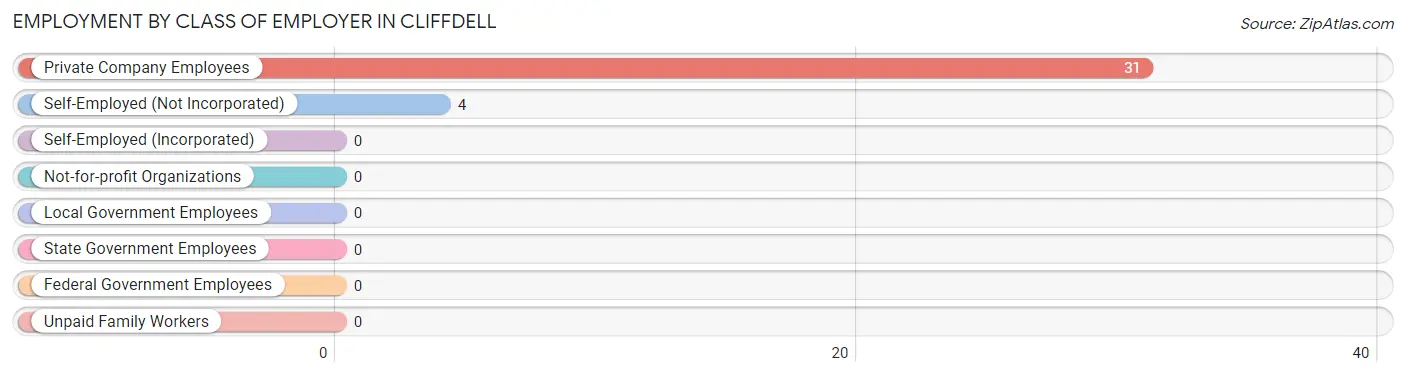
| Employer Class | # Employees | % Employees |
| Private Company Employees | 31 | 88.6% |
| Self-Employed (Incorporated) | 0 | 0.0% |
| Self-Employed (Not Incorporated) | 4 | 11.4% |
| Not-for-profit Organizations | 0 | 0.0% |
| Local Government Employees | 0 | 0.0% |
| State Government Employees | 0 | 0.0% |
| Federal Government Employees | 0 | 0.0% |
| Unpaid Family Workers | 0 | 0.0% |
| Total | 35 | 100.0% |
Employment Status by Age in Cliffdell
According to the labor force statistics for Cliffdell, out of the total population over 16 years of age (61), 59.0% or 36 individuals are in the labor force, with 2.8% or 1 of them unemployed. The age group with the highest labor force participation rate is 60 to 64 years, with 100.0% or 9 individuals in the labor force. Within the labor force, the 35 to 44 years age range has the highest percentage of unemployed individuals, with 8.3% or 1 of them being unemployed.
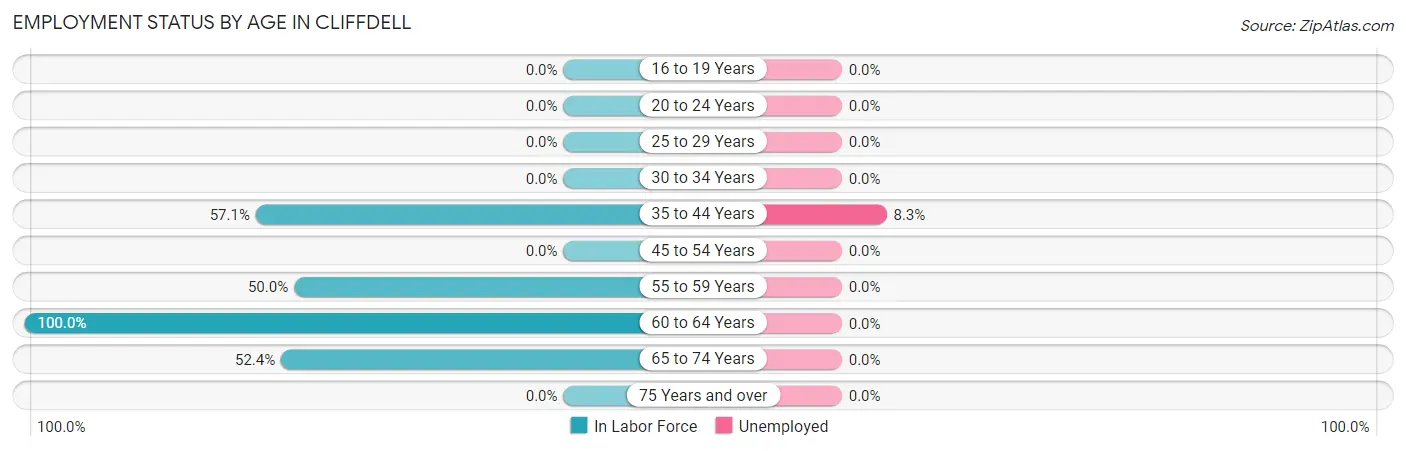
| Age Bracket | In Labor Force | Unemployed |
| 16 to 19 Years | 0 (0.0%) | 0 (0.0%) |
| 20 to 24 Years | 0 (0.0%) | 0 (0.0%) |
| 25 to 29 Years | 0 (0.0%) | 0 (0.0%) |
| 30 to 34 Years | 0 (0.0%) | 0 (0.0%) |
| 35 to 44 Years | 12 (57.1%) | 1 (8.3%) |
| 45 to 54 Years | 0 (0.0%) | 0 (0.0%) |
| 55 to 59 Years | 4 (50.0%) | 0 (0.0%) |
| 60 to 64 Years | 9 (100.0%) | 0 (0.0%) |
| 65 to 74 Years | 11 (52.4%) | 0 (0.0%) |
| 75 Years and over | 0 (0.0%) | 0 (0.0%) |
| Total | 36 (59.0%) | 1 (2.8%) |
Employment Status by Educational Attainment in Cliffdell
According to labor force statistics for Cliffdell, 62.5% of individuals (25) out of the total population between 25 and 64 years of age (40) are in the labor force, with 4.0% or 1 of them being unemployed. The group with the highest labor force participation rate are those with the educational attainment of high school diploma, with 100.0% or 4 individuals in the labor force. Within the labor force, individuals with college / associate degree education have the highest percentage of unemployment, with 4.8% or 1 of them being unemployed.
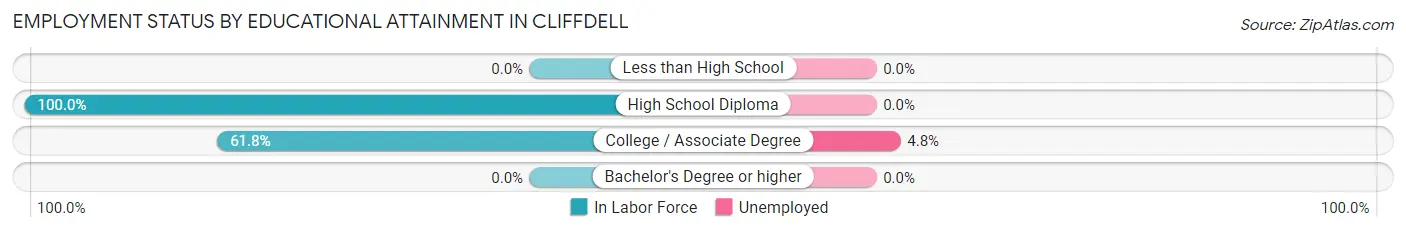
| Educational Attainment | In Labor Force | Unemployed |
| Less than High School | 0 (0.0%) | 0 (0.0%) |
| High School Diploma | 4 (100.0%) | 0 (0.0%) |
| College / Associate Degree | 21 (61.8%) | 2 (4.8%) |
| Bachelor's Degree or higher | 0 (0.0%) | 0 (0.0%) |
| Total | 25 (62.5%) | 2 (4.0%) |
Employment Occupations by Sex in Cliffdell
Management, Business, Science and Arts Occupations
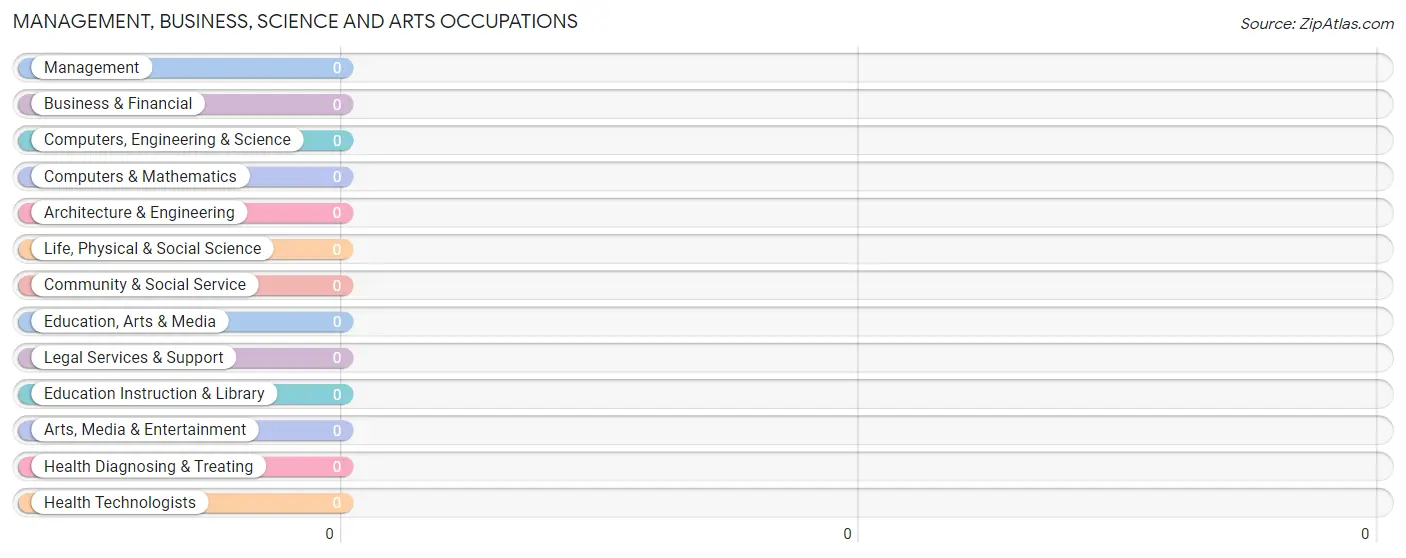
Management, Business, Science and Arts Occupations by Sex
| Occupation | Male | Female |
| Management | 0 (0.0%) | 0 (0.0%) |
| Business & Financial | 0 (0.0%) | 0 (0.0%) |
| Computers, Engineering & Science | 0 (0.0%) | 0 (0.0%) |
| Computers & Mathematics | 0 (0.0%) | 0 (0.0%) |
| Architecture & Engineering | 0 (0.0%) | 0 (0.0%) |
| Life, Physical & Social Science | 0 (0.0%) | 0 (0.0%) |
| Community & Social Service | 0 (0.0%) | 0 (0.0%) |
| Education, Arts & Media | 0 (0.0%) | 0 (0.0%) |
| Legal Services & Support | 0 (0.0%) | 0 (0.0%) |
| Education Instruction & Library | 0 (0.0%) | 0 (0.0%) |
| Arts, Media & Entertainment | 0 (0.0%) | 0 (0.0%) |
| Health Diagnosing & Treating | 0 (0.0%) | 0 (0.0%) |
| Health Technologists | 0 (0.0%) | 0 (0.0%) |
| Total (Category) | 0 (0.0%) | 0 (0.0%) |
| Total (Overall) | 24 (68.6%) | 11 (31.4%) |
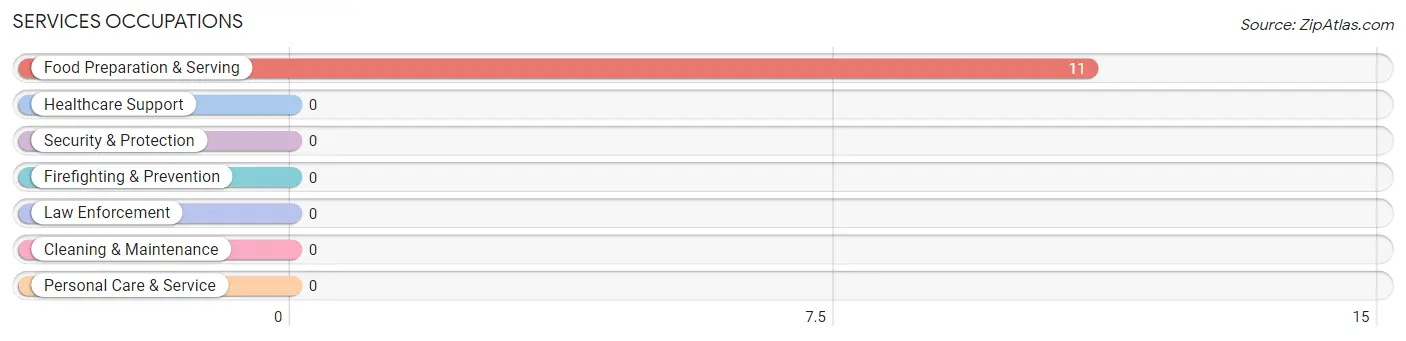
Services Occupations
The most common Services occupations in Cliffdell are , and Food Preparation & Serving (11 | 31.4%).
Services Occupations by Sex
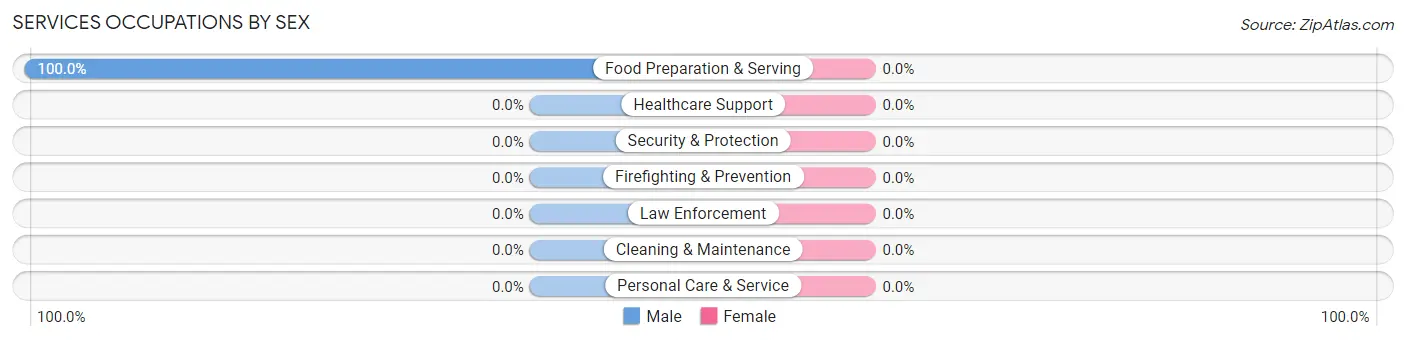
| Occupation | Male | Female |
| Healthcare Support | 0 (0.0%) | 0 (0.0%) |
| Security & Protection | 0 (0.0%) | 0 (0.0%) |
| Firefighting & Prevention | 0 (0.0%) | 0 (0.0%) |
| Law Enforcement | 0 (0.0%) | 0 (0.0%) |
| Food Preparation & Serving | 11 (100.0%) | 0 (0.0%) |
| Cleaning & Maintenance | 0 (0.0%) | 0 (0.0%) |
| Personal Care & Service | 0 (0.0%) | 0 (0.0%) |
| Total (Category) | 11 (100.0%) | 0 (0.0%) |
| Total (Overall) | 24 (68.6%) | 11 (31.4%) |
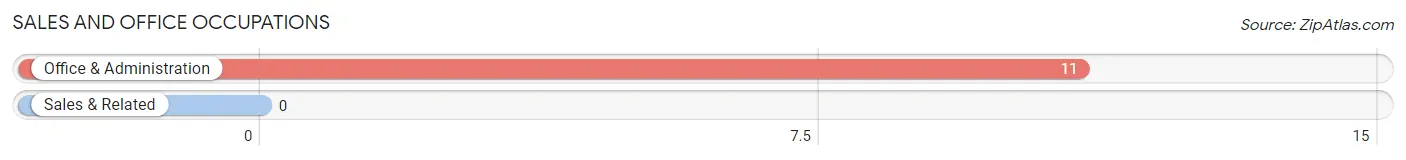
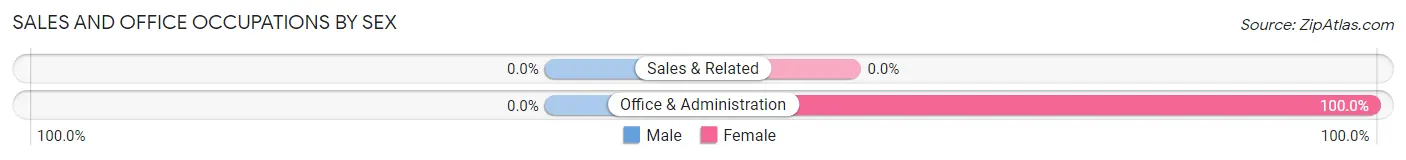
Sales and Office Occupations
The most common Sales and Office occupations in Cliffdell are , and Office & Administration (11 | 31.4%).
Sales and Office Occupations by Sex
| Occupation | Male | Female |
| Sales & Related | 0 (0.0%) | 0 (0.0%) |
| Office & Administration | 0 (0.0%) | 11 (100.0%) |
| Total (Category) | 0 (0.0%) | 11 (100.0%) |
| Total (Overall) | 24 (68.6%) | 11 (31.4%) |
Natural Resources, Construction and Maintenance Occupations
The most common Natural Resources, Construction and Maintenance occupations in Cliffdell are , and Installation, Maintenance & Repair (4 | 11.4%).
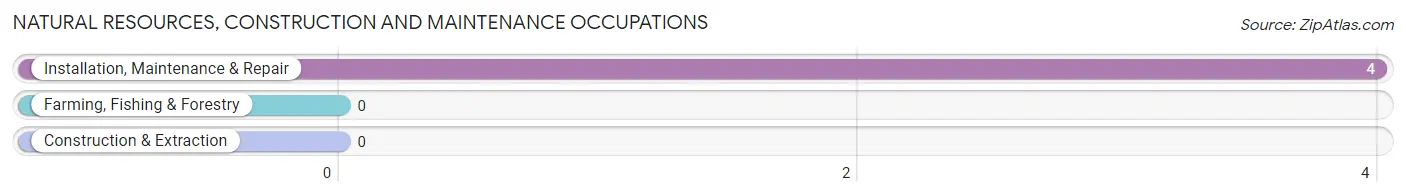
Natural Resources, Construction and Maintenance Occupations by Sex
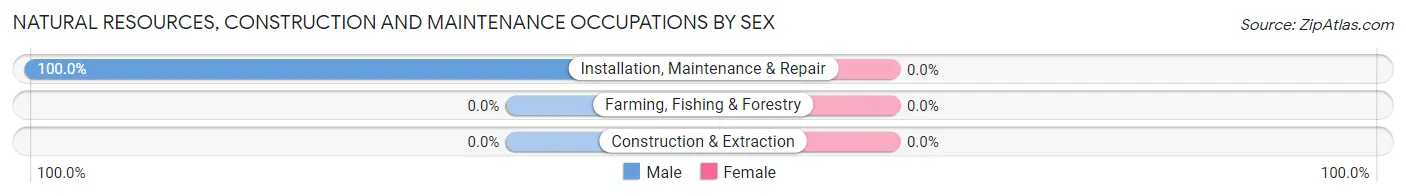
| Occupation | Male | Female |
| Farming, Fishing & Forestry | 0 (0.0%) | 0 (0.0%) |
| Construction & Extraction | 0 (0.0%) | 0 (0.0%) |
| Installation, Maintenance & Repair | 4 (100.0%) | 0 (0.0%) |
| Total (Category) | 4 (100.0%) | 0 (0.0%) |
| Total (Overall) | 24 (68.6%) | 11 (31.4%) |
Production, Transportation and Moving Occupations
The most common Production, Transportation and Moving occupations in Cliffdell are , and Production (9 | 25.7%).
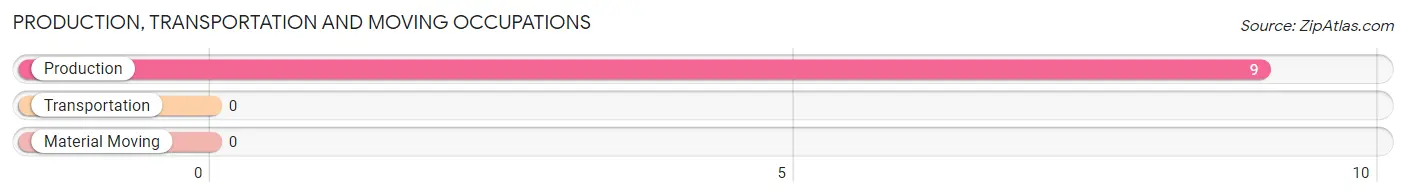
Production, Transportation and Moving Occupations by Sex
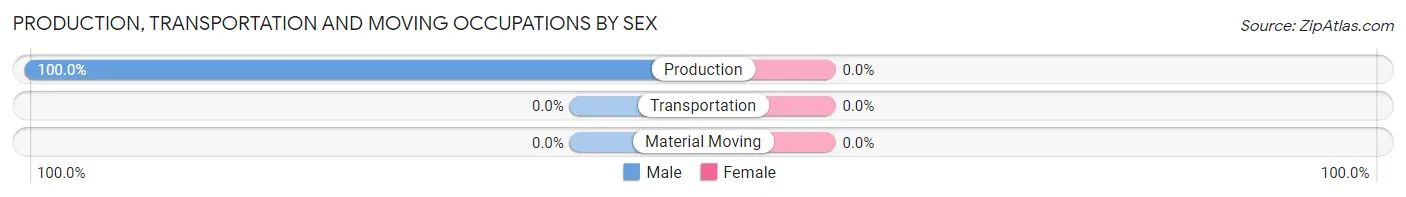
| Occupation | Male | Female |
| Production | 9 (100.0%) | 0 (0.0%) |
| Transportation | 0 (0.0%) | 0 (0.0%) |
| Material Moving | 0 (0.0%) | 0 (0.0%) |
| Total (Category) | 9 (100.0%) | 0 (0.0%) |
| Total (Overall) | 24 (68.6%) | 11 (31.4%) |
Employment Industries by Sex in Cliffdell
Employment Industries in Cliffdell
The major employment industries in Cliffdell include , and Accommodation & Food Services (22 | 62.9%).
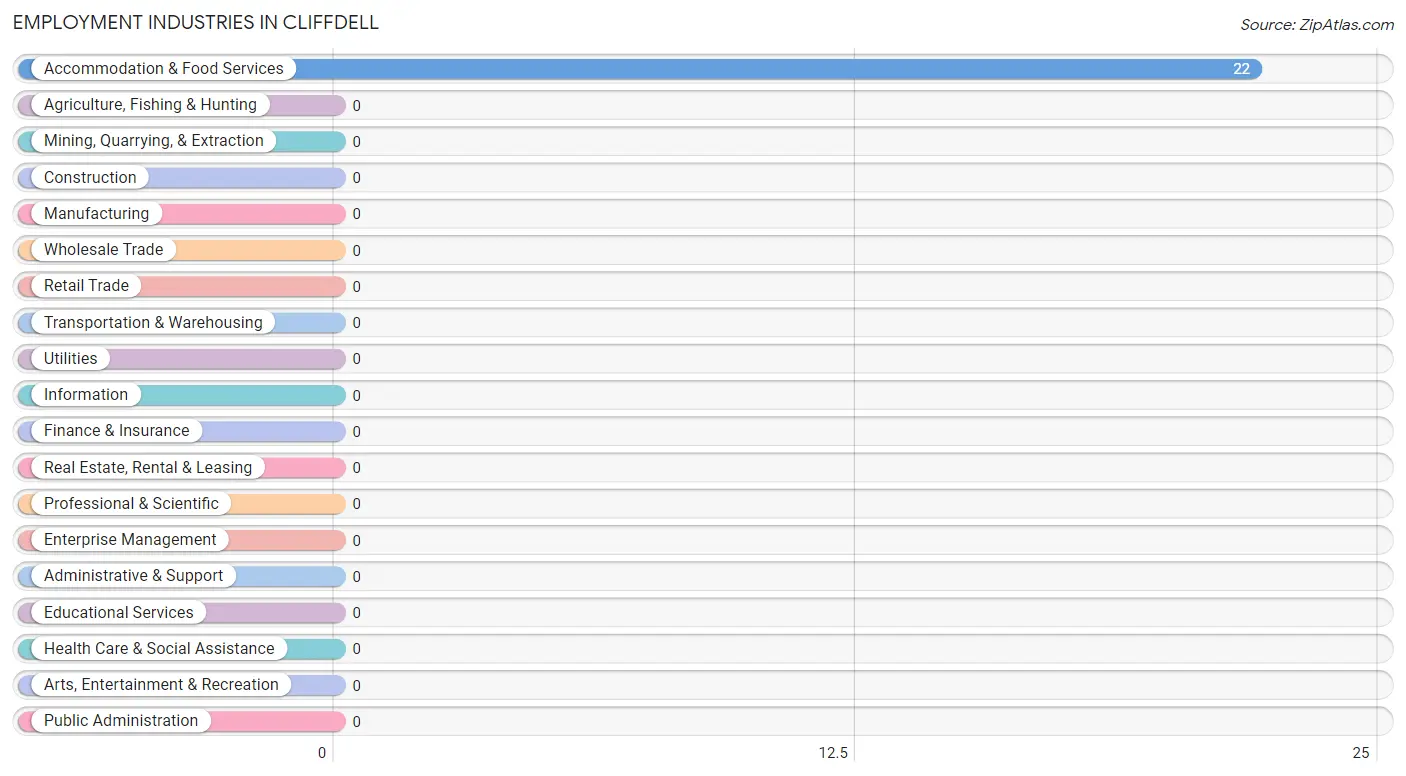
Employment Industries by Sex in Cliffdell
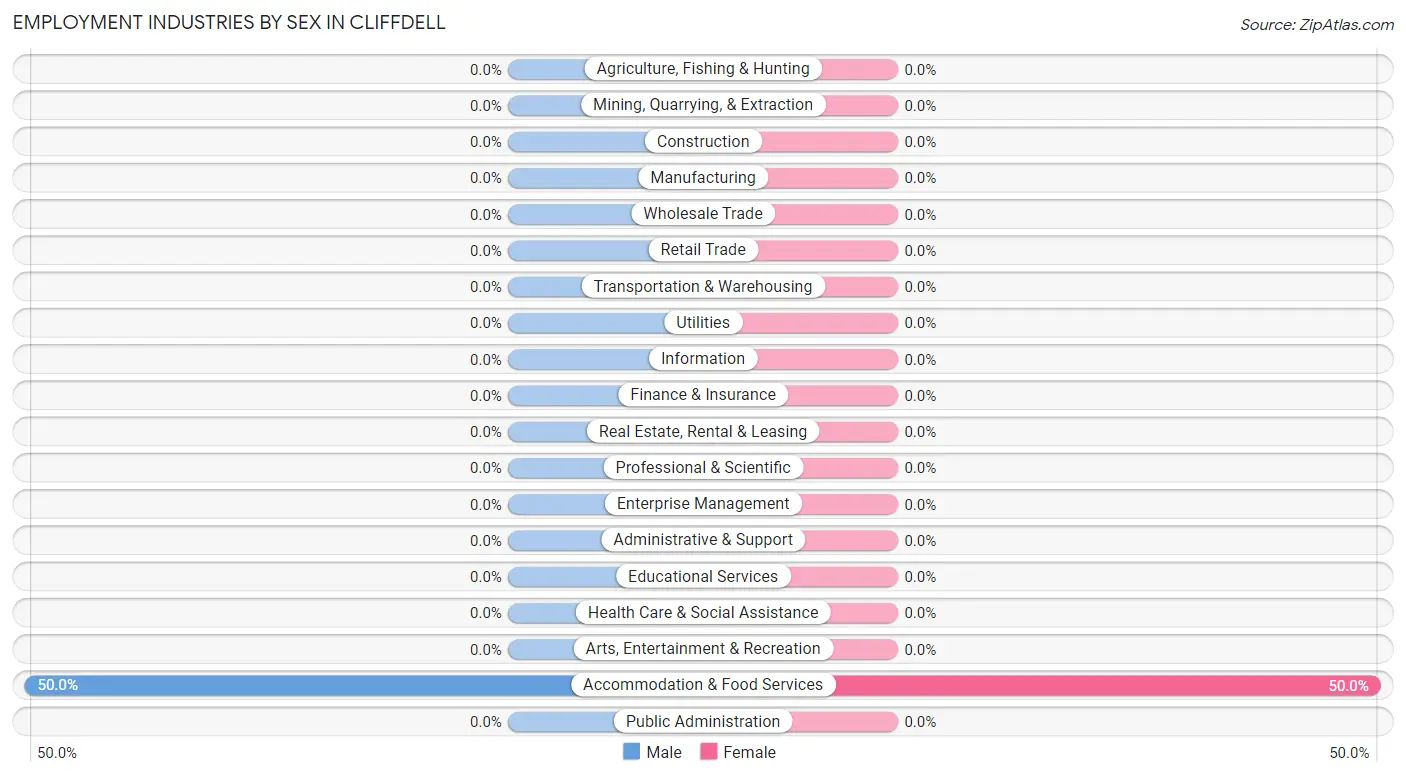
| Industry | Male | Female |
| Agriculture, Fishing & Hunting | 0 (0.0%) | 0 (0.0%) |
| Mining, Quarrying, & Extraction | 0 (0.0%) | 0 (0.0%) |
| Construction | 0 (0.0%) | 0 (0.0%) |
| Manufacturing | 0 (0.0%) | 0 (0.0%) |
| Wholesale Trade | 0 (0.0%) | 0 (0.0%) |
| Retail Trade | 0 (0.0%) | 0 (0.0%) |
| Transportation & Warehousing | 0 (0.0%) | 0 (0.0%) |
| Utilities | 0 (0.0%) | 0 (0.0%) |
| Information | 0 (0.0%) | 0 (0.0%) |
| Finance & Insurance | 0 (0.0%) | 0 (0.0%) |
| Real Estate, Rental & Leasing | 0 (0.0%) | 0 (0.0%) |
| Professional & Scientific | 0 (0.0%) | 0 (0.0%) |
| Enterprise Management | 0 (0.0%) | 0 (0.0%) |
| Administrative & Support | 0 (0.0%) | 0 (0.0%) |
| Educational Services | 0 (0.0%) | 0 (0.0%) |
| Health Care & Social Assistance | 0 (0.0%) | 0 (0.0%) |
| Arts, Entertainment & Recreation | 0 (0.0%) | 0 (0.0%) |
| Accommodation & Food Services | 11 (50.0%) | 11 (50.0%) |
| Public Administration | 0 (0.0%) | 0 (0.0%) |
| Total | 24 (68.6%) | 11 (31.4%) |
Education in Cliffdell
School Enrollment in Cliffdell
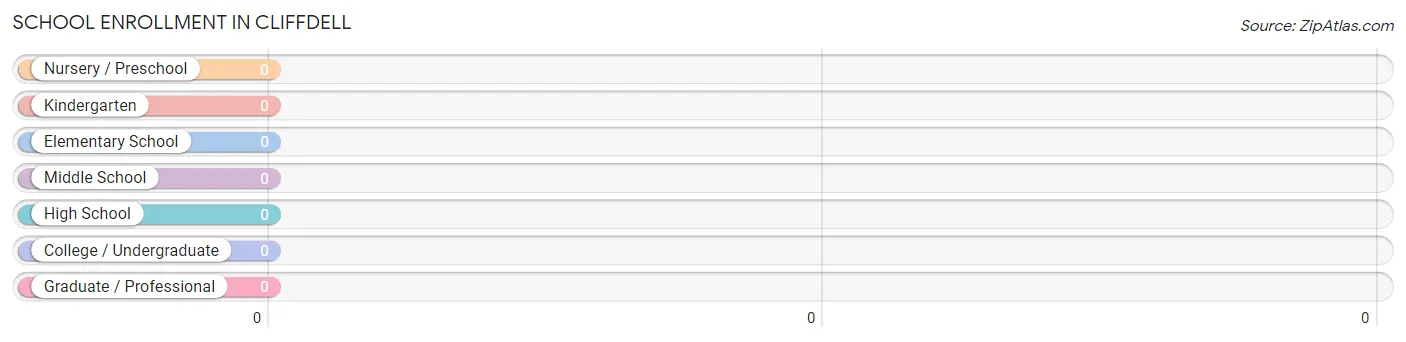
| School Level | # Students | % Students |
| Nursery / Preschool | 0 | 0.0% |
| Kindergarten | 0 | 0.0% |
| Elementary School | 0 | 0.0% |
| Middle School | 0 | 0.0% |
| High School | 0 | 0.0% |
| College / Undergraduate | 0 | 0.0% |
| Graduate / Professional | 0 | 0.0% |
| Total | 0 | 0.0% |
School Enrollment by Age by Funding Source in Cliffdell
| Age Bracket | Public School | Private School |
| 3 to 4 Year Olds | 0 (0.0%) | 0 (0.0%) |
| 5 to 9 Year Old | 0 (0.0%) | 0 (0.0%) |
| 10 to 14 Year Olds | 0 (0.0%) | 0 (0.0%) |
| 15 to 17 Year Olds | 0 (0.0%) | 0 (0.0%) |
| 18 to 19 Year Olds | 0 (0.0%) | 0 (0.0%) |
| 20 to 24 Year Olds | 0 (0.0%) | 0 (0.0%) |
| 25 to 34 Year Olds | 0 (0.0%) | 0 (0.0%) |
| 35 Years and over | 0 (0.0%) | 0 (0.0%) |
| Total | 0 (0.0%) | 0 (0.0%) |
Educational Attainment by Field of Study in Cliffdell
| Field of Study | # Graduates | % Graduates |
| Computers & Mathematics | 0 | 0.0% |
| Bio, Nature & Agricultural | 0 | 0.0% |
| Physical & Health Sciences | 0 | 0.0% |
| Psychology | 0 | 0.0% |
| Social Sciences | 0 | 0.0% |
| Engineering | 0 | 0.0% |
| Multidisciplinary Studies | 0 | 0.0% |
| Science & Technology | 0 | 0.0% |
| Business | 0 | 0.0% |
| Education | 0 | 0.0% |
| Literature & Languages | 0 | 0.0% |
| Liberal Arts & History | 0 | 0.0% |
| Visual & Performing Arts | 0 | 0.0% |
| Communications | 0 | 0.0% |
| Arts & Humanities | 0 | 0.0% |
| Total | 0 | 0.0% |
Transportation & Commute in Cliffdell
Vehicle Availability by Sex in Cliffdell
The most prevalent vehicle ownership categories in Cliffdell are males with 2 vehicles (11, accounting for 45.8%) and females with 2 vehicles (0, making up 100.0%).
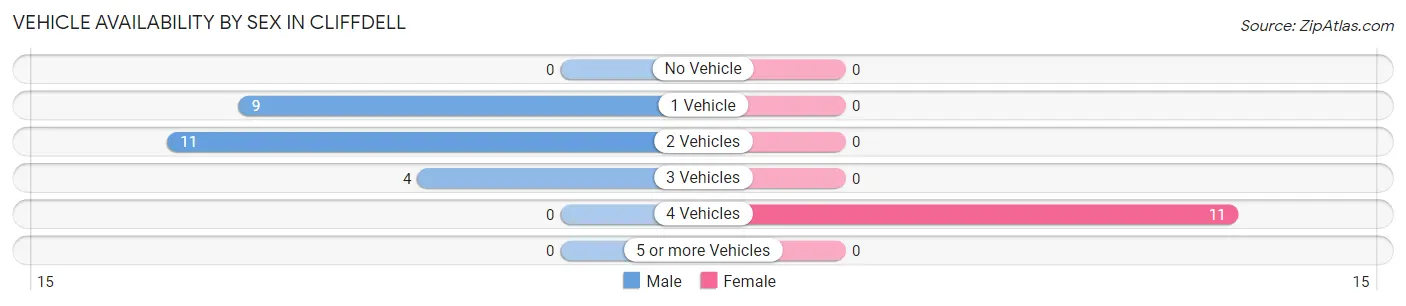
| Vehicles Available | Male | Female |
| No Vehicle | 0 (0.0%) | 0 (0.0%) |
| 1 Vehicle | 9 (37.5%) | 0 (0.0%) |
| 2 Vehicles | 11 (45.8%) | 0 (0.0%) |
| 3 Vehicles | 4 (16.7%) | 0 (0.0%) |
| 4 Vehicles | 0 (0.0%) | 11 (100.0%) |
| 5 or more Vehicles | 0 (0.0%) | 0 (0.0%) |
| Total | 24 (100.0%) | 11 (100.0%) |
Commute Time in Cliffdell
The most frequently occuring commute durations in Cliffdell are less than 5 minutes (26 commuters, 74.3%), 20 to 24 minutes (9 commuters, 25.7%), and 5 to 9 minutes (0 commuters, 0.0%).
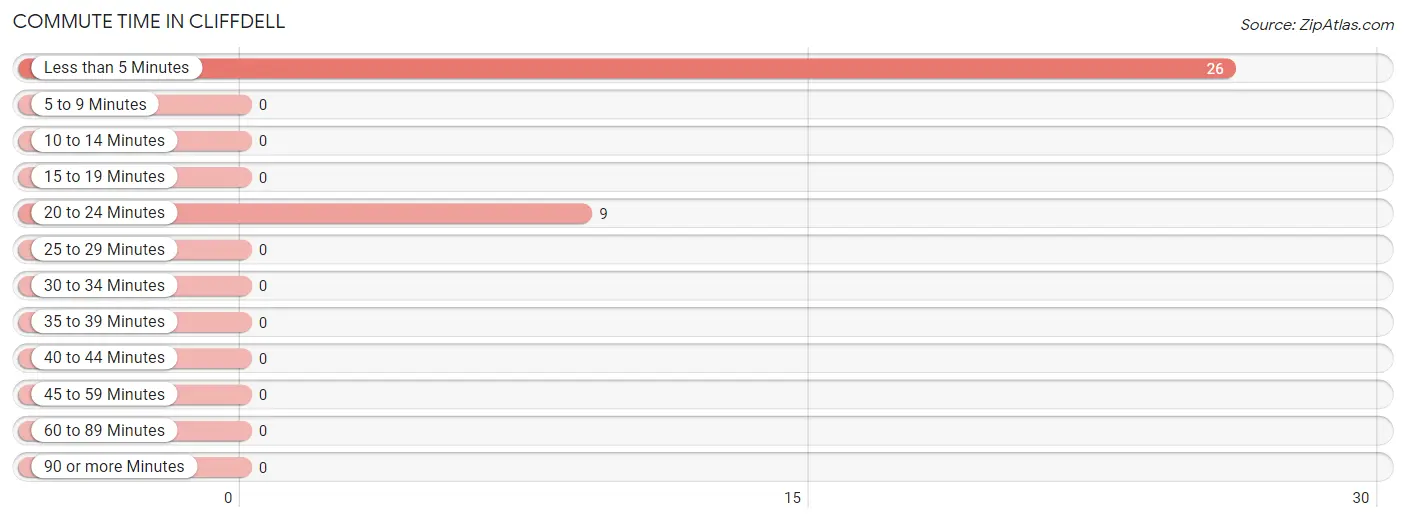
| Commute Time | # Commuters | % Commuters |
| Less than 5 Minutes | 26 | 74.3% |
| 5 to 9 Minutes | 0 | 0.0% |
| 10 to 14 Minutes | 0 | 0.0% |
| 15 to 19 Minutes | 0 | 0.0% |
| 20 to 24 Minutes | 9 | 25.7% |
| 25 to 29 Minutes | 0 | 0.0% |
| 30 to 34 Minutes | 0 | 0.0% |
| 35 to 39 Minutes | 0 | 0.0% |
| 40 to 44 Minutes | 0 | 0.0% |
| 45 to 59 Minutes | 0 | 0.0% |
| 60 to 89 Minutes | 0 | 0.0% |
| 90 or more Minutes | 0 | 0.0% |
Commute Time by Sex in Cliffdell
The most common commute times in Cliffdell are less than 5 minutes (15 commuters, 62.5%) for males and less than 5 minutes (11 commuters, 100.0%) for females.
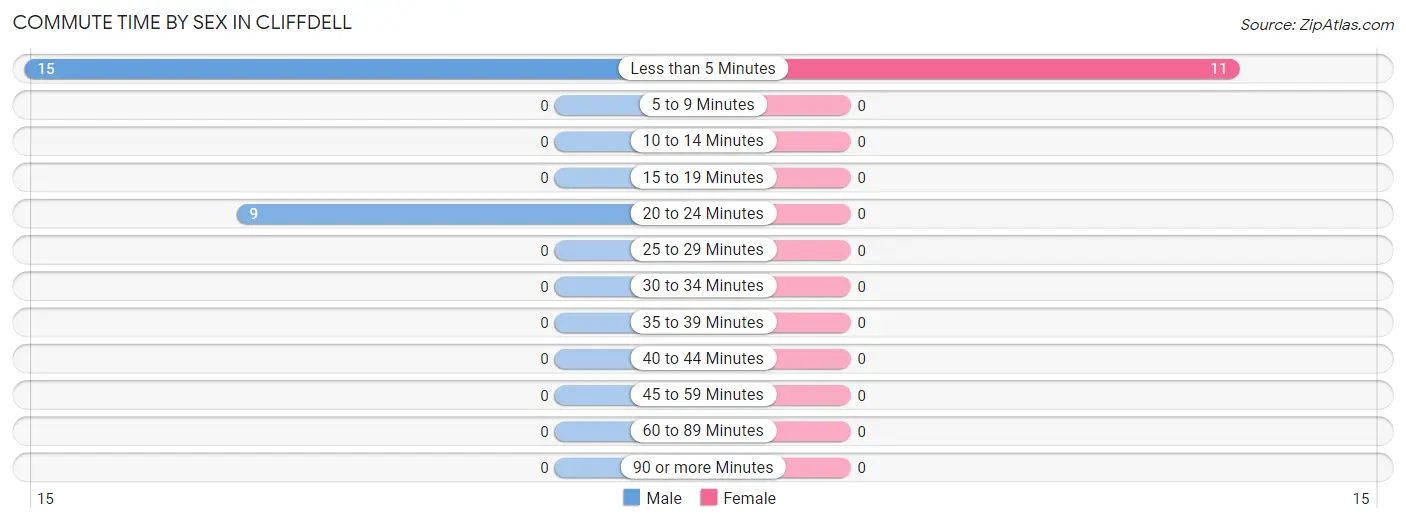
| Commute Time | Male | Female |
| Less than 5 Minutes | 15 (62.5%) | 11 (100.0%) |
| 5 to 9 Minutes | 0 (0.0%) | 0 (0.0%) |
| 10 to 14 Minutes | 0 (0.0%) | 0 (0.0%) |
| 15 to 19 Minutes | 0 (0.0%) | 0 (0.0%) |
| 20 to 24 Minutes | 9 (37.5%) | 0 (0.0%) |
| 25 to 29 Minutes | 0 (0.0%) | 0 (0.0%) |
| 30 to 34 Minutes | 0 (0.0%) | 0 (0.0%) |
| 35 to 39 Minutes | 0 (0.0%) | 0 (0.0%) |
| 40 to 44 Minutes | 0 (0.0%) | 0 (0.0%) |
| 45 to 59 Minutes | 0 (0.0%) | 0 (0.0%) |
| 60 to 89 Minutes | 0 (0.0%) | 0 (0.0%) |
| 90 or more Minutes | 0 (0.0%) | 0 (0.0%) |
Time of Departure to Work by Sex in Cliffdell
The most frequent times of departure to work in Cliffdell are 10:00 AM to 10:59 AM (15, 62.5%) for males and 6:30 AM to 6:59 AM (11, 100.0%) for females.
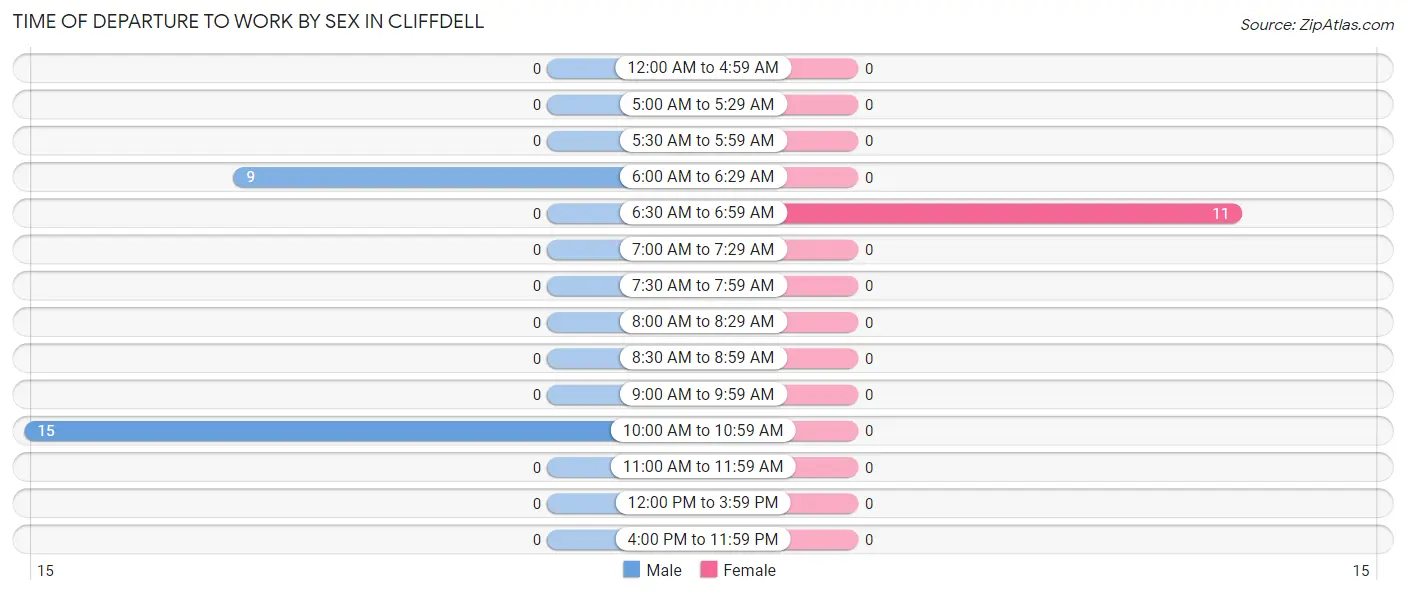
| Time of Departure | Male | Female |
| 12:00 AM to 4:59 AM | 0 (0.0%) | 0 (0.0%) |
| 5:00 AM to 5:29 AM | 0 (0.0%) | 0 (0.0%) |
| 5:30 AM to 5:59 AM | 0 (0.0%) | 0 (0.0%) |
| 6:00 AM to 6:29 AM | 9 (37.5%) | 0 (0.0%) |
| 6:30 AM to 6:59 AM | 0 (0.0%) | 11 (100.0%) |
| 7:00 AM to 7:29 AM | 0 (0.0%) | 0 (0.0%) |
| 7:30 AM to 7:59 AM | 0 (0.0%) | 0 (0.0%) |
| 8:00 AM to 8:29 AM | 0 (0.0%) | 0 (0.0%) |
| 8:30 AM to 8:59 AM | 0 (0.0%) | 0 (0.0%) |
| 9:00 AM to 9:59 AM | 0 (0.0%) | 0 (0.0%) |
| 10:00 AM to 10:59 AM | 15 (62.5%) | 0 (0.0%) |
| 11:00 AM to 11:59 AM | 0 (0.0%) | 0 (0.0%) |
| 12:00 PM to 3:59 PM | 0 (0.0%) | 0 (0.0%) |
| 4:00 PM to 11:59 PM | 0 (0.0%) | 0 (0.0%) |
| Total | 24 (100.0%) | 11 (100.0%) |
Housing Occupancy in Cliffdell
Occupancy by Ownership in Cliffdell
Of the total 33 dwellings in Cliffdell, owner-occupied units account for 24 (72.7%), while renter-occupied units make up 9 (27.3%).
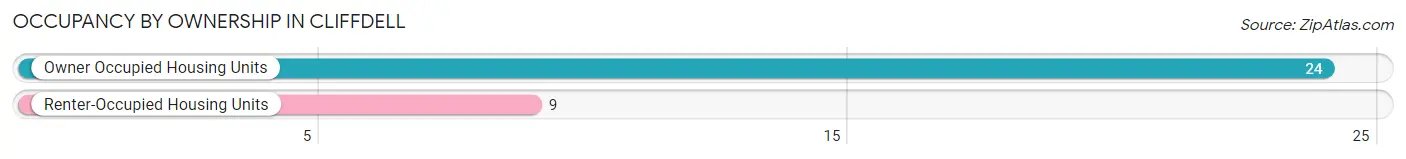
| Occupancy | # Housing Units | % Housing Units |
| Owner Occupied Housing Units | 24 | 72.7% |
| Renter-Occupied Housing Units | 9 | 27.3% |
| Total Occupied Housing Units | 33 | 100.0% |
Occupancy by Household Size in Cliffdell
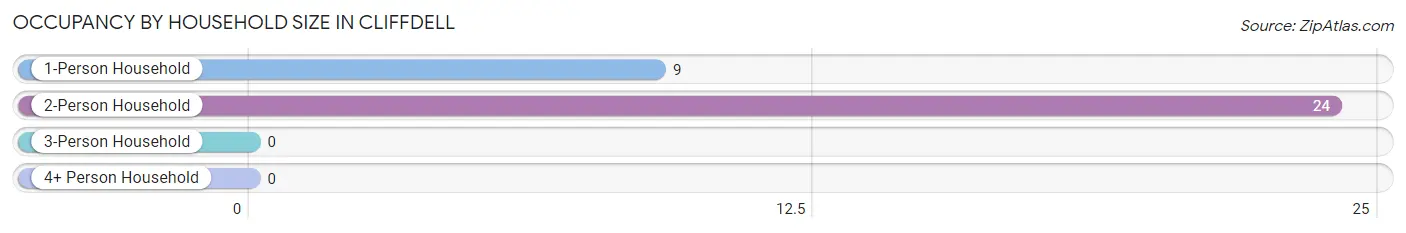
| Household Size | # Housing Units | % Housing Units |
| 1-Person Household | 9 | 27.3% |
| 2-Person Household | 24 | 72.7% |
| 3-Person Household | 0 | 0.0% |
| 4+ Person Household | 0 | 0.0% |
| Total Housing Units | 33 | 100.0% |
Occupancy by Ownership by Household Size in Cliffdell
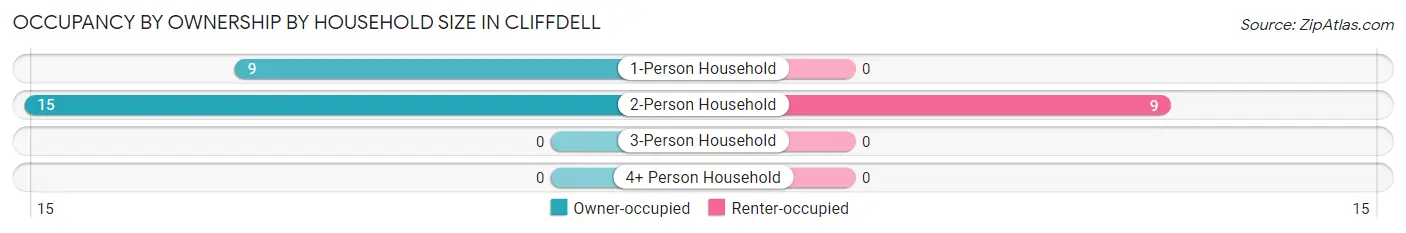
| Household Size | Owner-occupied | Renter-occupied |
| 1-Person Household | 9 (100.0%) | 0 (0.0%) |
| 2-Person Household | 15 (62.5%) | 9 (37.5%) |
| 3-Person Household | 0 (0.0%) | 0 (0.0%) |
| 4+ Person Household | 0 (0.0%) | 0 (0.0%) |
| Total Housing Units | 24 (72.7%) | 9 (27.3%) |
Occupancy by Educational Attainment in Cliffdell
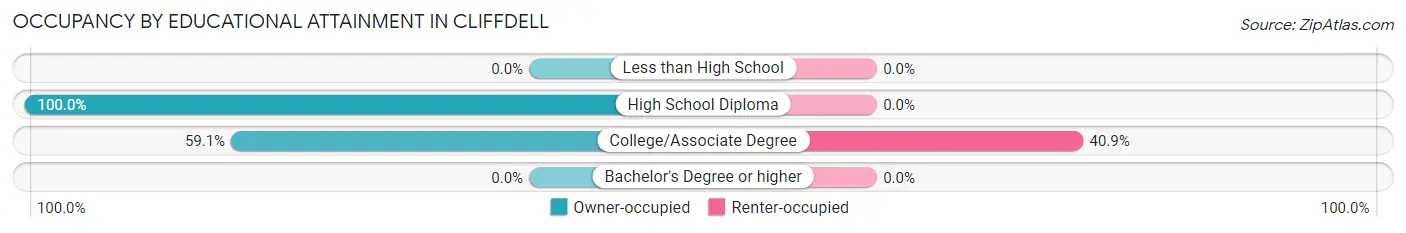
| Household Size | Owner-occupied | Renter-occupied |
| Less than High School | 0 (0.0%) | 0 (0.0%) |
| High School Diploma | 11 (100.0%) | 0 (0.0%) |
| College/Associate Degree | 13 (59.1%) | 9 (40.9%) |
| Bachelor's Degree or higher | 0 (0.0%) | 0 (0.0%) |
Occupancy by Age of Householder in Cliffdell
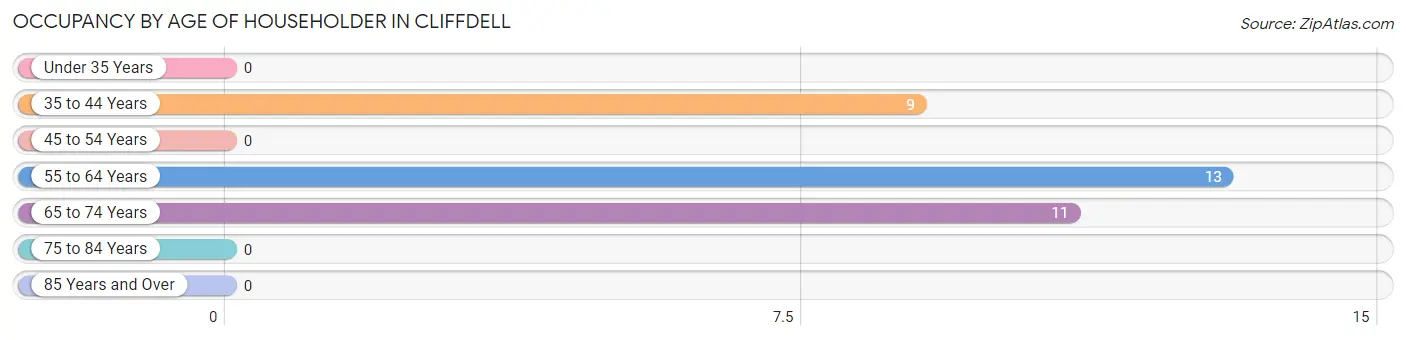
| Age Bracket | # Households | % Households |
| Under 35 Years | 0 | 0.0% |
| 35 to 44 Years | 9 | 27.3% |
| 45 to 54 Years | 0 | 0.0% |
| 55 to 64 Years | 13 | 39.4% |
| 65 to 74 Years | 11 | 33.3% |
| 75 to 84 Years | 0 | 0.0% |
| 85 Years and Over | 0 | 0.0% |
| Total | 33 | 100.0% |
Housing Finances in Cliffdell
Median Income by Occupancy in Cliffdell
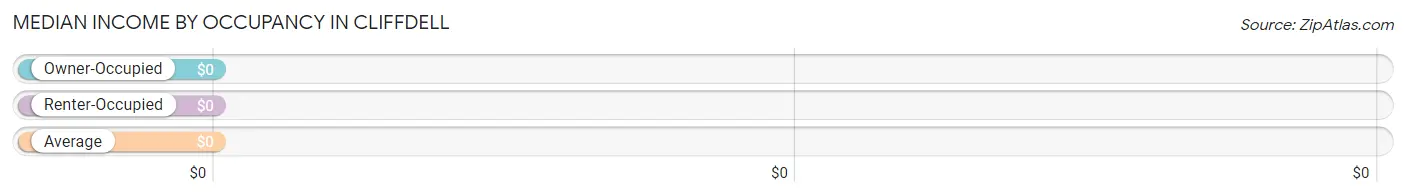
| Occupancy Type | # Households | Median Income |
| Owner-Occupied | 24 (72.7%) | $0 |
| Renter-Occupied | 9 (27.3%) | $0 |
| Average | 33 (100.0%) | $0 |
Occupancy by Householder Income Bracket in Cliffdell
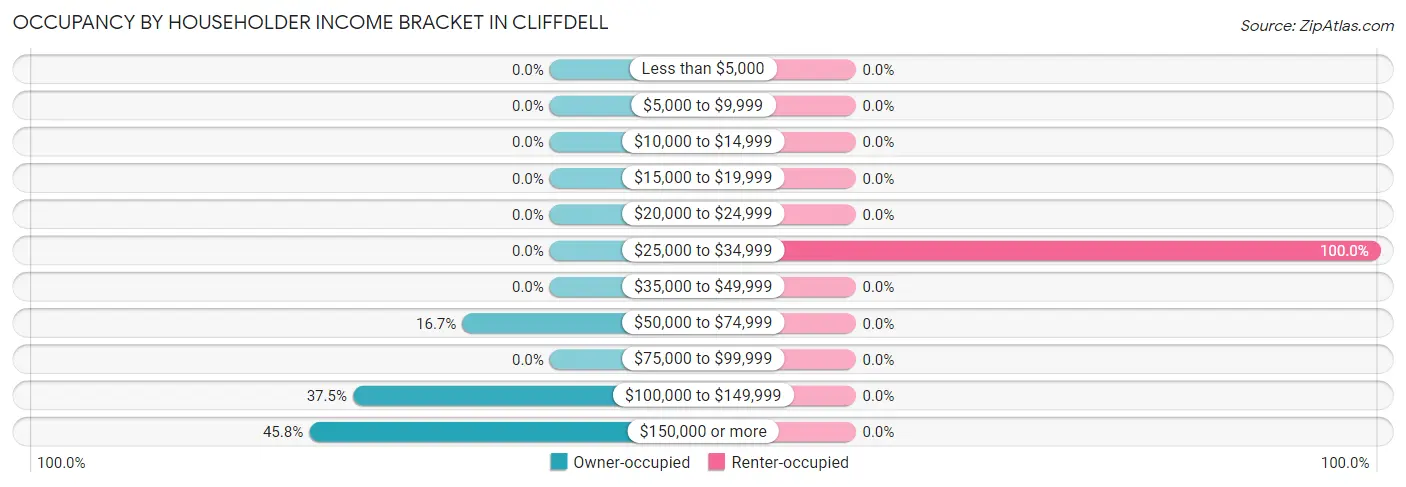
| Income Bracket | Owner-occupied | Renter-occupied |
| Less than $5,000 | 0 (0.0%) | 0 (0.0%) |
| $5,000 to $9,999 | 0 (0.0%) | 0 (0.0%) |
| $10,000 to $14,999 | 0 (0.0%) | 0 (0.0%) |
| $15,000 to $19,999 | 0 (0.0%) | 0 (0.0%) |
| $20,000 to $24,999 | 0 (0.0%) | 0 (0.0%) |
| $25,000 to $34,999 | 0 (0.0%) | 9 (100.0%) |
| $35,000 to $49,999 | 0 (0.0%) | 0 (0.0%) |
| $50,000 to $74,999 | 4 (16.7%) | 0 (0.0%) |
| $75,000 to $99,999 | 0 (0.0%) | 0 (0.0%) |
| $100,000 to $149,999 | 9 (37.5%) | 0 (0.0%) |
| $150,000 or more | 11 (45.8%) | 0 (0.0%) |
| Total | 24 (100.0%) | 9 (100.0%) |
Monthly Housing Cost Tiers in Cliffdell
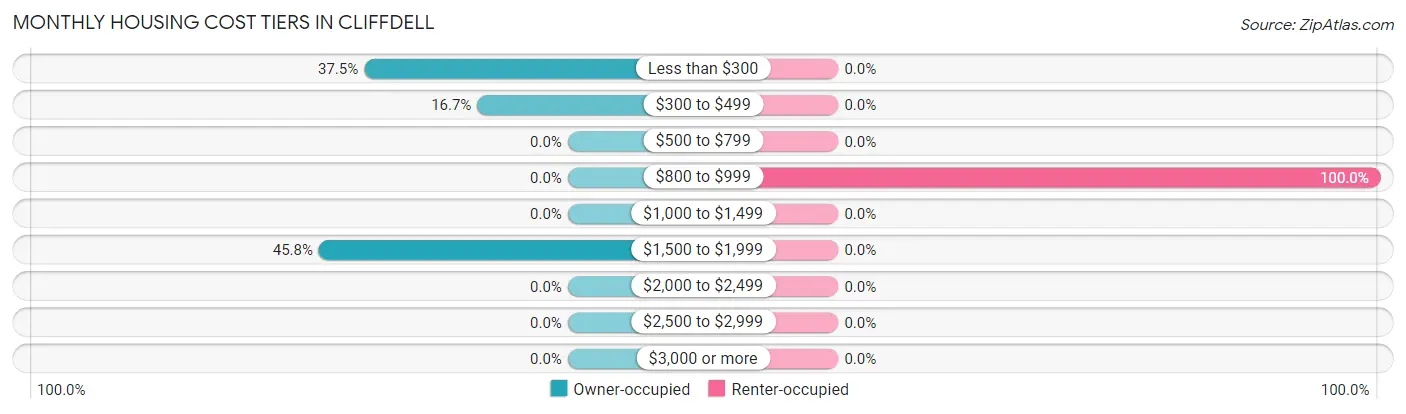
| Monthly Cost | Owner-occupied | Renter-occupied |
| Less than $300 | 9 (37.5%) | 0 (0.0%) |
| $300 to $499 | 4 (16.7%) | 0 (0.0%) |
| $500 to $799 | 0 (0.0%) | 0 (0.0%) |
| $800 to $999 | 0 (0.0%) | 9 (100.0%) |
| $1,000 to $1,499 | 0 (0.0%) | 0 (0.0%) |
| $1,500 to $1,999 | 11 (45.8%) | 0 (0.0%) |
| $2,000 to $2,499 | 0 (0.0%) | 0 (0.0%) |
| $2,500 to $2,999 | 0 (0.0%) | 0 (0.0%) |
| $3,000 or more | 0 (0.0%) | 0 (0.0%) |
| Total | 24 (100.0%) | 9 (100.0%) |
Physical Housing Characteristics in Cliffdell
Housing Structures in Cliffdell
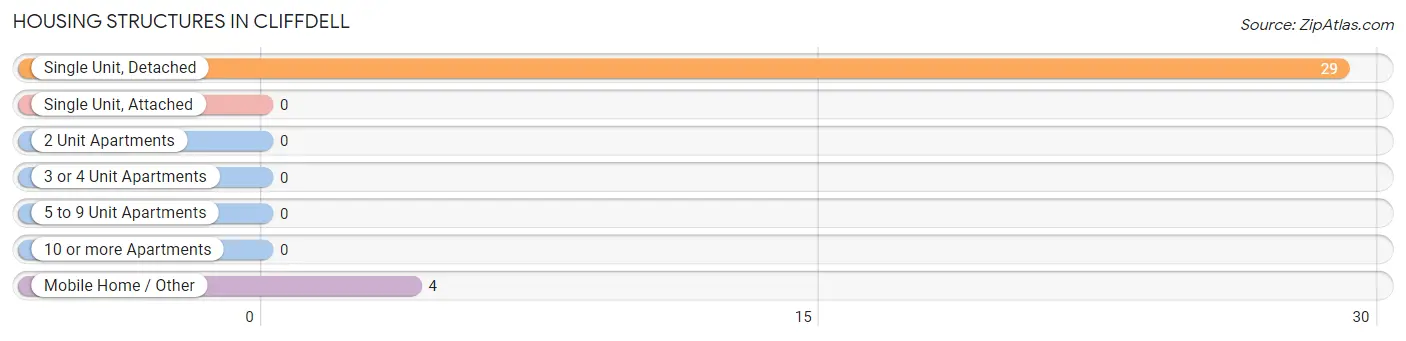
| Structure Type | # Housing Units | % Housing Units |
| Single Unit, Detached | 29 | 87.9% |
| Single Unit, Attached | 0 | 0.0% |
| 2 Unit Apartments | 0 | 0.0% |
| 3 or 4 Unit Apartments | 0 | 0.0% |
| 5 to 9 Unit Apartments | 0 | 0.0% |
| 10 or more Apartments | 0 | 0.0% |
| Mobile Home / Other | 4 | 12.1% |
| Total | 33 | 100.0% |
Housing Structures by Occupancy in Cliffdell
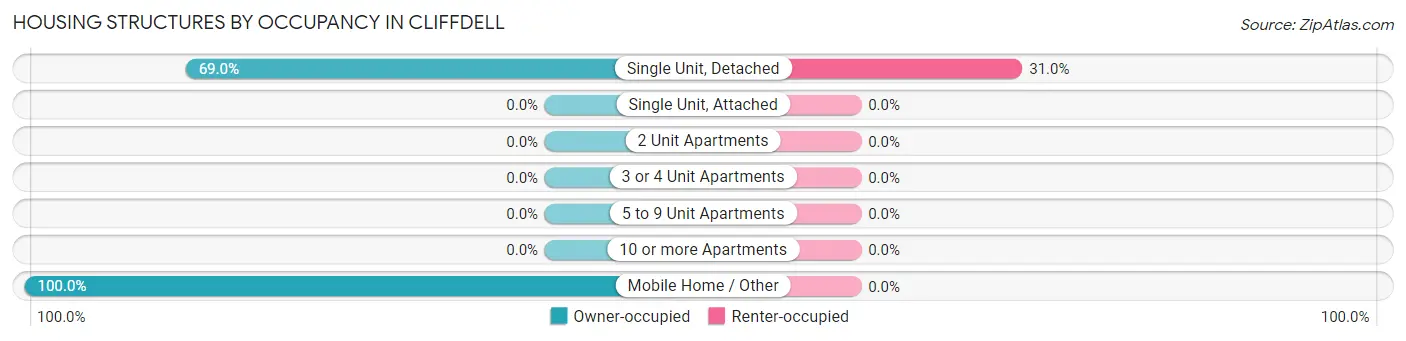
| Structure Type | Owner-occupied | Renter-occupied |
| Single Unit, Detached | 20 (69.0%) | 9 (31.0%) |
| Single Unit, Attached | 0 (0.0%) | 0 (0.0%) |
| 2 Unit Apartments | 0 (0.0%) | 0 (0.0%) |
| 3 or 4 Unit Apartments | 0 (0.0%) | 0 (0.0%) |
| 5 to 9 Unit Apartments | 0 (0.0%) | 0 (0.0%) |
| 10 or more Apartments | 0 (0.0%) | 0 (0.0%) |
| Mobile Home / Other | 4 (100.0%) | 0 (0.0%) |
| Total | 24 (72.7%) | 9 (27.3%) |
Housing Structures by Number of Rooms in Cliffdell
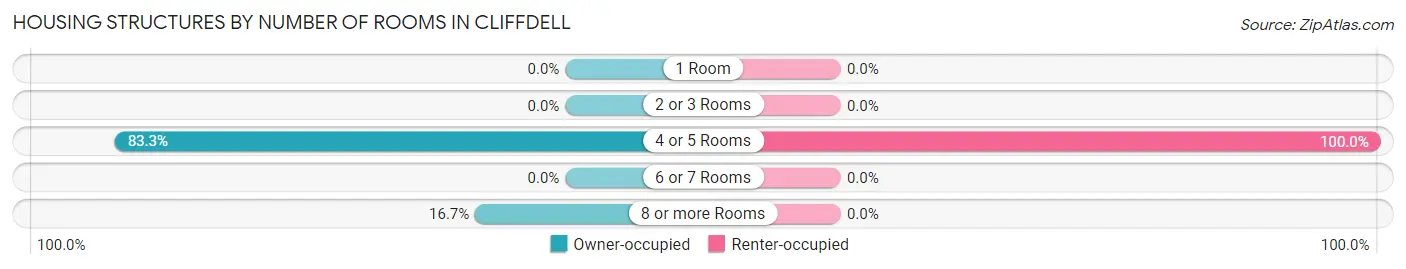
| Number of Rooms | Owner-occupied | Renter-occupied |
| 1 Room | 0 (0.0%) | 0 (0.0%) |
| 2 or 3 Rooms | 0 (0.0%) | 0 (0.0%) |
| 4 or 5 Rooms | 20 (83.3%) | 9 (100.0%) |
| 6 or 7 Rooms | 0 (0.0%) | 0 (0.0%) |
| 8 or more Rooms | 4 (16.7%) | 0 (0.0%) |
| Total | 24 (100.0%) | 9 (100.0%) |
Housing Structure by Heating Type in Cliffdell
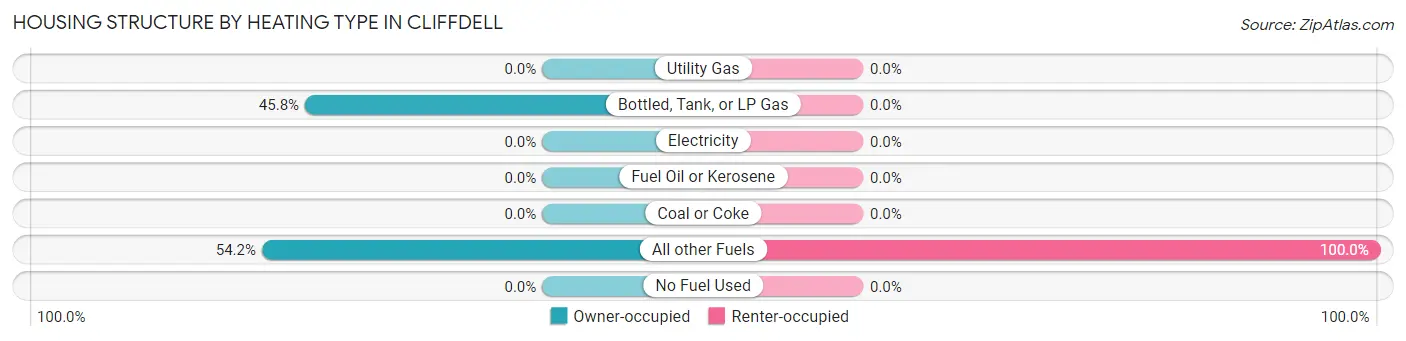
| Heating Type | Owner-occupied | Renter-occupied |
| Utility Gas | 0 (0.0%) | 0 (0.0%) |
| Bottled, Tank, or LP Gas | 11 (45.8%) | 0 (0.0%) |
| Electricity | 0 (0.0%) | 0 (0.0%) |
| Fuel Oil or Kerosene | 0 (0.0%) | 0 (0.0%) |
| Coal or Coke | 0 (0.0%) | 0 (0.0%) |
| All other Fuels | 13 (54.2%) | 9 (100.0%) |
| No Fuel Used | 0 (0.0%) | 0 (0.0%) |
| Total | 24 (100.0%) | 9 (100.0%) |
Household Vehicle Usage in Cliffdell
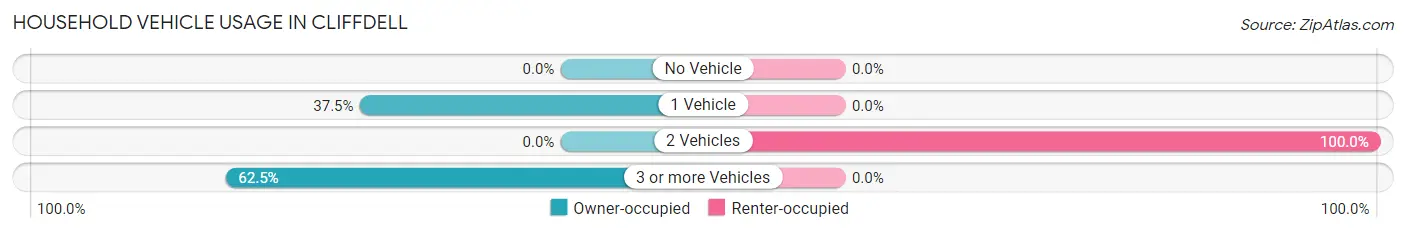
| Vehicles per Household | Owner-occupied | Renter-occupied |
| No Vehicle | 0 (0.0%) | 0 (0.0%) |
| 1 Vehicle | 9 (37.5%) | 0 (0.0%) |
| 2 Vehicles | 0 (0.0%) | 9 (100.0%) |
| 3 or more Vehicles | 15 (62.5%) | 0 (0.0%) |
| Total | 24 (100.0%) | 9 (100.0%) |
Real Estate & Mortgages in Cliffdell
Real Estate and Mortgage Overview in Cliffdell
| Characteristic | Without Mortgage | With Mortgage |
| Housing Units | 13 | 11 |
| Median Property Value | - | - |
| Median Household Income | - | - |
| Monthly Housing Costs | - | - |
| Real Estate Taxes | - | - |
Property Value by Mortgage Status in Cliffdell
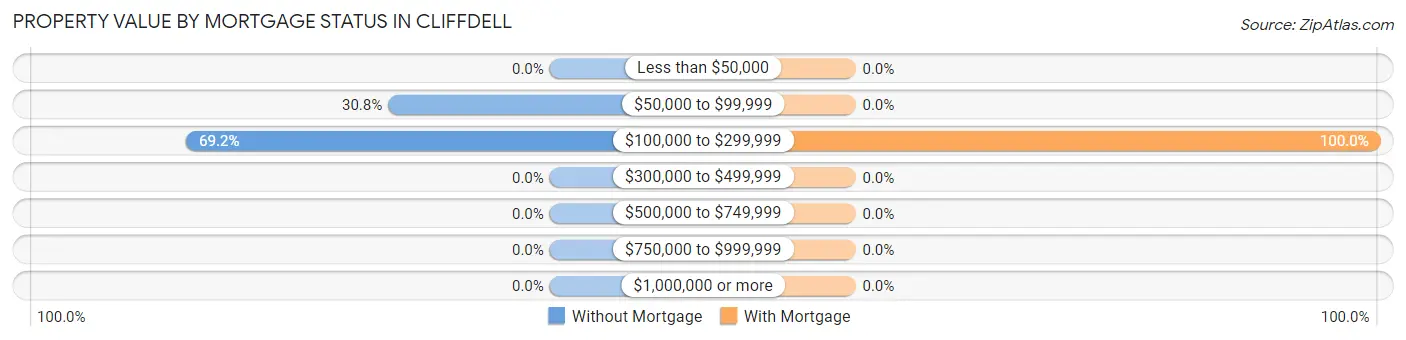
| Property Value | Without Mortgage | With Mortgage |
| Less than $50,000 | 0 (0.0%) | 0 (0.0%) |
| $50,000 to $99,999 | 4 (30.8%) | 0 (0.0%) |
| $100,000 to $299,999 | 9 (69.2%) | 11 (100.0%) |
| $300,000 to $499,999 | 0 (0.0%) | 0 (0.0%) |
| $500,000 to $749,999 | 0 (0.0%) | 0 (0.0%) |
| $750,000 to $999,999 | 0 (0.0%) | 0 (0.0%) |
| $1,000,000 or more | 0 (0.0%) | 0 (0.0%) |
| Total | 13 (100.0%) | 11 (100.0%) |
Household Income by Mortgage Status in Cliffdell
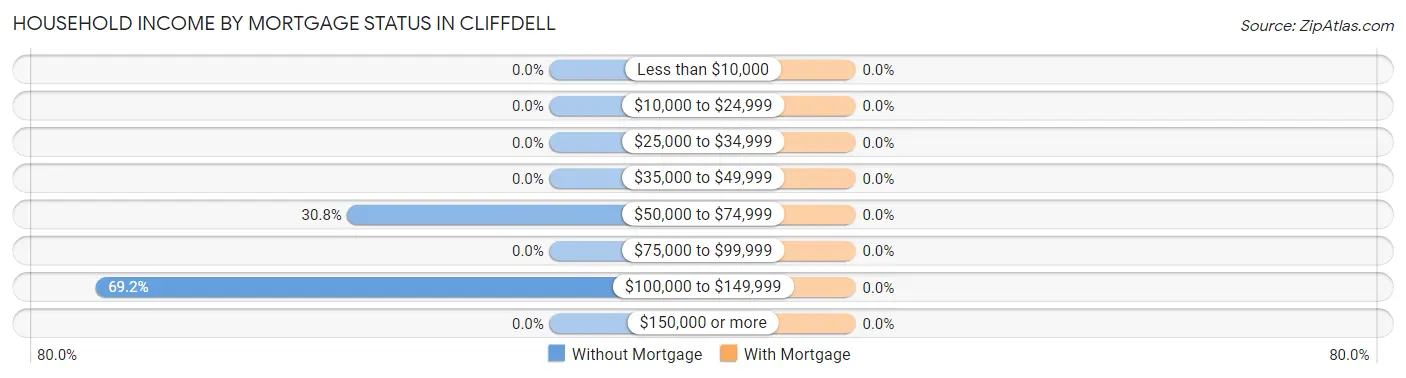
| Household Income | Without Mortgage | With Mortgage |
| Less than $10,000 | 0 (0.0%) | 0 (0.0%) |
| $10,000 to $24,999 | 0 (0.0%) | 0 (0.0%) |
| $25,000 to $34,999 | 0 (0.0%) | 0 (0.0%) |
| $35,000 to $49,999 | 0 (0.0%) | 0 (0.0%) |
| $50,000 to $74,999 | 4 (30.8%) | 0 (0.0%) |
| $75,000 to $99,999 | 0 (0.0%) | 0 (0.0%) |
| $100,000 to $149,999 | 9 (69.2%) | 0 (0.0%) |
| $150,000 or more | 0 (0.0%) | 0 (0.0%) |
| Total | 13 (100.0%) | 11 (100.0%) |
Property Value to Household Income Ratio in Cliffdell
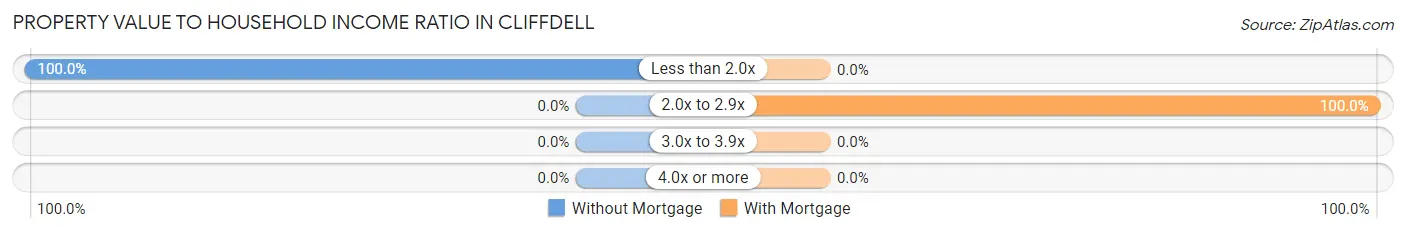
| Value-to-Income Ratio | Without Mortgage | With Mortgage |
| Less than 2.0x | 13 (100.0%) | 0 (0.0%) |
| 2.0x to 2.9x | 0 (0.0%) | 11 (100.0%) |
| 3.0x to 3.9x | 0 (0.0%) | 0 (0.0%) |
| 4.0x or more | 0 (0.0%) | 0 (0.0%) |
| Total | 13 (100.0%) | 11 (100.0%) |
Real Estate Taxes by Mortgage Status in Cliffdell
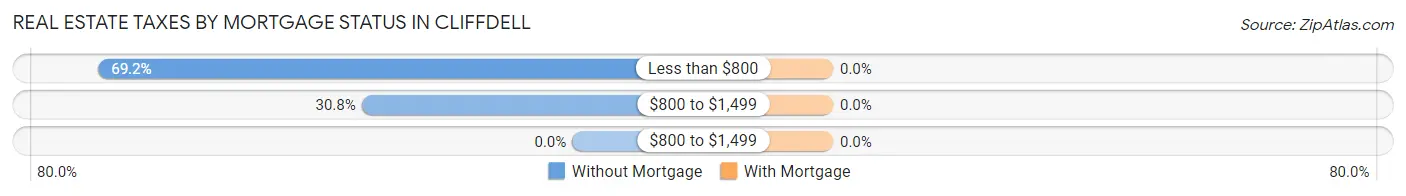
| Property Taxes | Without Mortgage | With Mortgage |
| Less than $800 | 9 (69.2%) | 0 (0.0%) |
| $800 to $1,499 | 4 (30.8%) | 0 (0.0%) |
| $800 to $1,499 | 0 (0.0%) | 0 (0.0%) |
| Total | 13 (100.0%) | 11 (100.0%) |
Health & Disability in Cliffdell
Health Insurance Coverage by Age in Cliffdell
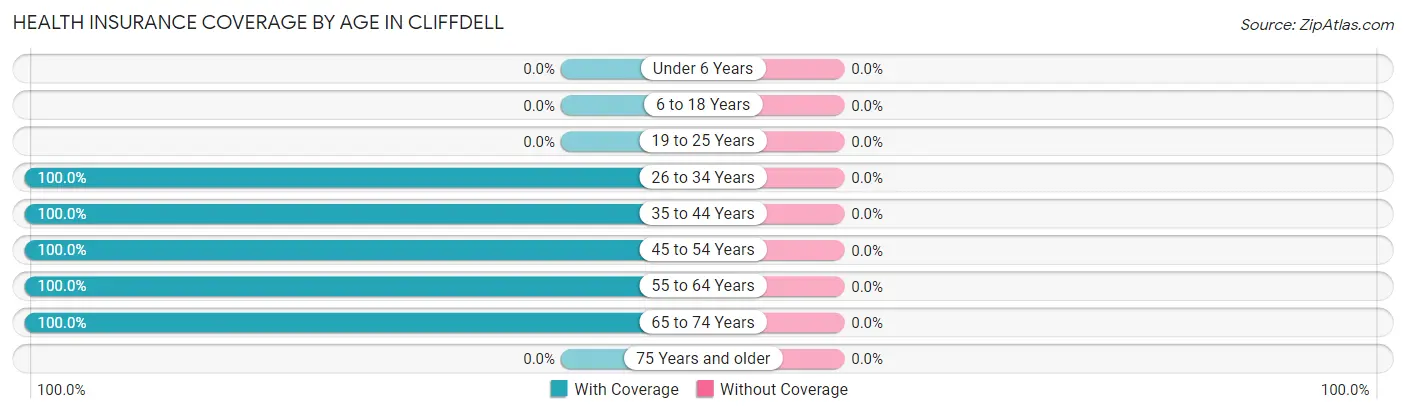
| Age Bracket | With Coverage | Without Coverage |
| Under 6 Years | 0 (0.0%) | 0 (0.0%) |
| 6 to 18 Years | 0 (0.0%) | 0 (0.0%) |
| 19 to 25 Years | 0 (0.0%) | 0 (0.0%) |
| 26 to 34 Years | 1 (100.0%) | 0 (0.0%) |
| 35 to 44 Years | 21 (100.0%) | 0 (0.0%) |
| 45 to 54 Years | 1 (100.0%) | 0 (0.0%) |
| 55 to 64 Years | 17 (100.0%) | 0 (0.0%) |
| 65 to 74 Years | 21 (100.0%) | 0 (0.0%) |
| 75 Years and older | 0 (0.0%) | 0 (0.0%) |
| Total | 61 (100.0%) | 0 (0.0%) |
Health Insurance Coverage by Citizenship Status in Cliffdell
| Citizenship Status | With Coverage | Without Coverage |
| Native Born | 0 (0.0%) | 0 (0.0%) |
| Foreign Born, Citizen | 0 (0.0%) | 0 (0.0%) |
| Foreign Born, not a Citizen | 0 (0.0%) | 0 (0.0%) |
Health Insurance Coverage by Household Income in Cliffdell
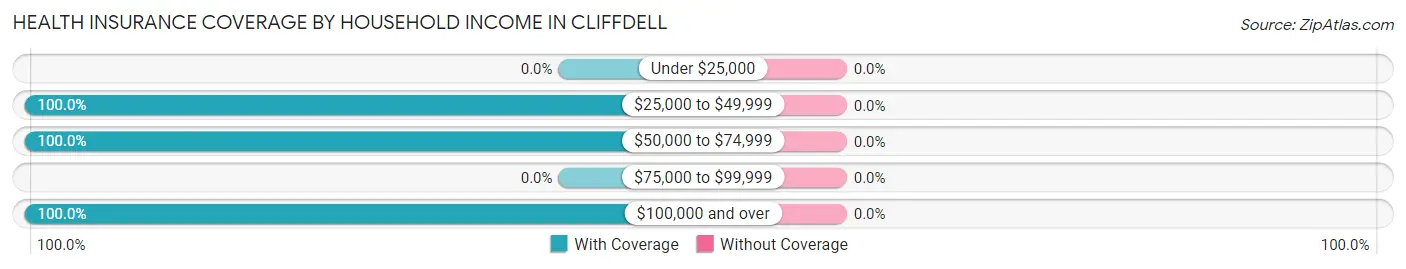
| Household Income | With Coverage | Without Coverage |
| Under $25,000 | 0 (0.0%) | 0 (0.0%) |
| $25,000 to $49,999 | 20 (100.0%) | 0 (0.0%) |
| $50,000 to $74,999 | 8 (100.0%) | 0 (0.0%) |
| $75,000 to $99,999 | 0 (0.0%) | 0 (0.0%) |
| $100,000 and over | 30 (100.0%) | 0 (0.0%) |
Public vs Private Health Insurance Coverage by Age in Cliffdell
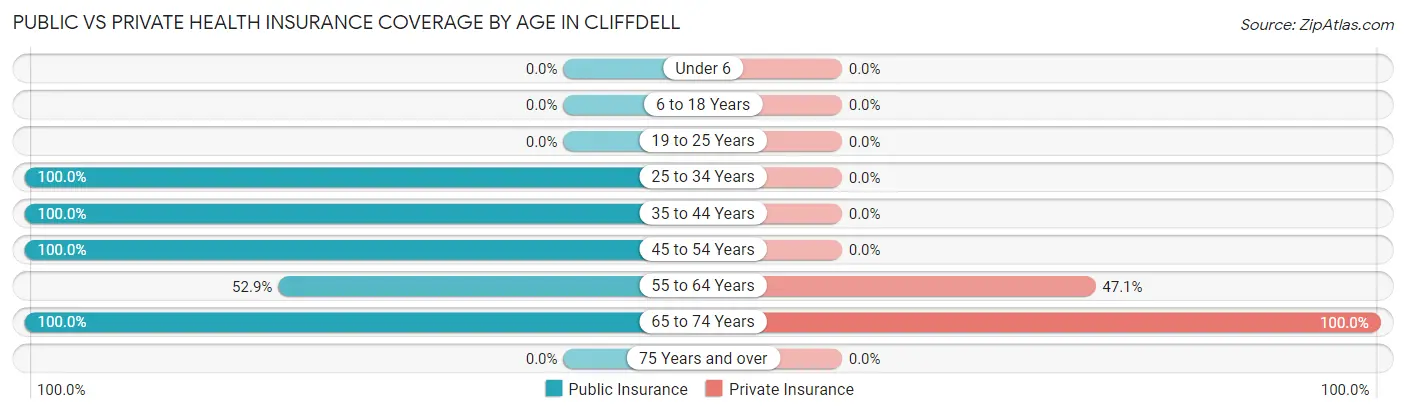
| Age Bracket | Public Insurance | Private Insurance |
| Under 6 | 0 (0.0%) | 0 (0.0%) |
| 6 to 18 Years | 0 (0.0%) | 0 (0.0%) |
| 19 to 25 Years | 0 (0.0%) | 0 (0.0%) |
| 25 to 34 Years | 1 (100.0%) | 0 (0.0%) |
| 35 to 44 Years | 21 (100.0%) | 0 (0.0%) |
| 45 to 54 Years | 1 (100.0%) | 0 (0.0%) |
| 55 to 64 Years | 9 (52.9%) | 8 (47.1%) |
| 65 to 74 Years | 21 (100.0%) | 21 (100.0%) |
| 75 Years and over | 0 (0.0%) | 0 (0.0%) |
| Total | 53 (86.9%) | 29 (47.5%) |
Disability Status by Sex by Age in Cliffdell
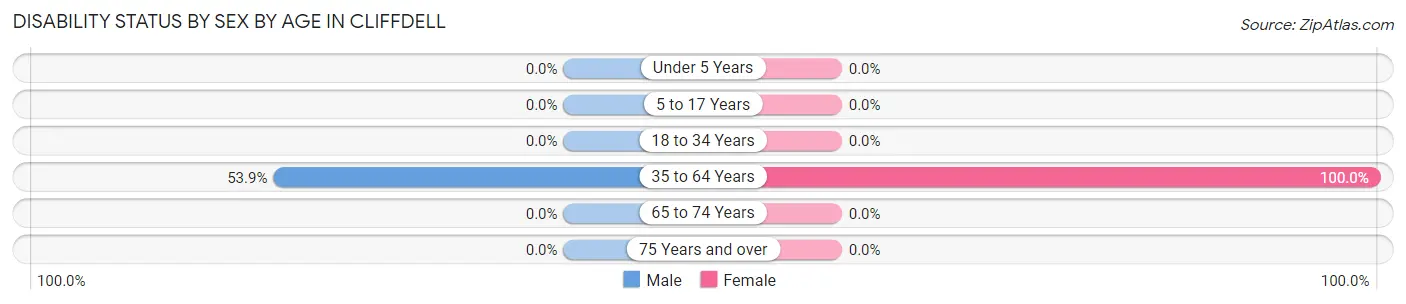
| Age Bracket | Male | Female |
| Under 5 Years | 0 (0.0%) | 0 (0.0%) |
| 5 to 17 Years | 0 (0.0%) | 0 (0.0%) |
| 18 to 34 Years | 0 (0.0%) | 0 (0.0%) |
| 35 to 64 Years | 14 (53.8%) | 13 (100.0%) |
| 65 to 74 Years | 0 (0.0%) | 0 (0.0%) |
| 75 Years and over | 0 (0.0%) | 0 (0.0%) |
Disability Class by Sex by Age in Cliffdell
Disability Class: Hearing Difficulty
| Age Bracket | Male | Female |
| Under 5 Years | 0 (0.0%) | 0 (0.0%) |
| 5 to 17 Years | 0 (0.0%) | 0 (0.0%) |
| 18 to 34 Years | 0 (0.0%) | 0 (0.0%) |
| 35 to 64 Years | 0 (0.0%) | 0 (0.0%) |
| 65 to 74 Years | 0 (0.0%) | 0 (0.0%) |
| 75 Years and over | 0 (0.0%) | 0 (0.0%) |
Disability Class: Vision Difficulty
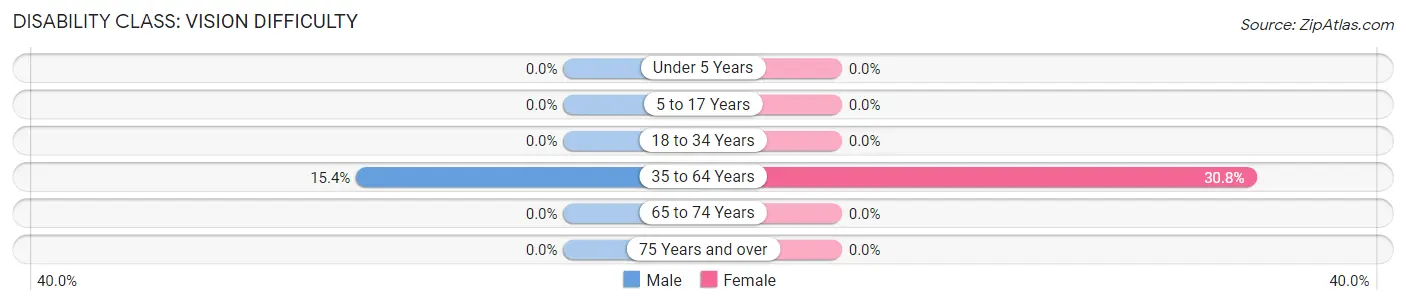
| Age Bracket | Male | Female |
| Under 5 Years | 0 (0.0%) | 0 (0.0%) |
| 5 to 17 Years | 0 (0.0%) | 0 (0.0%) |
| 18 to 34 Years | 0 (0.0%) | 0 (0.0%) |
| 35 to 64 Years | 4 (15.4%) | 4 (30.8%) |
| 65 to 74 Years | 0 (0.0%) | 0 (0.0%) |
| 75 Years and over | 0 (0.0%) | 0 (0.0%) |
Disability Class: Cognitive Difficulty
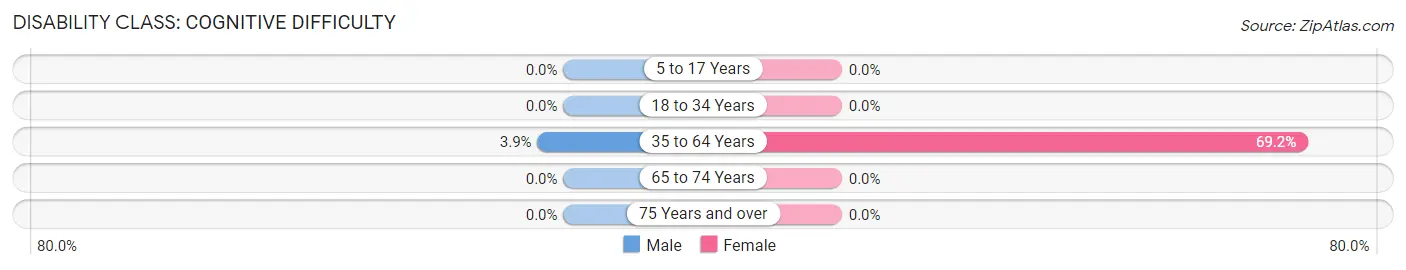
| Age Bracket | Male | Female |
| 5 to 17 Years | 0 (0.0%) | 0 (0.0%) |
| 18 to 34 Years | 0 (0.0%) | 0 (0.0%) |
| 35 to 64 Years | 1 (3.8%) | 9 (69.2%) |
| 65 to 74 Years | 0 (0.0%) | 0 (0.0%) |
| 75 Years and over | 0 (0.0%) | 0 (0.0%) |
Disability Class: Ambulatory Difficulty
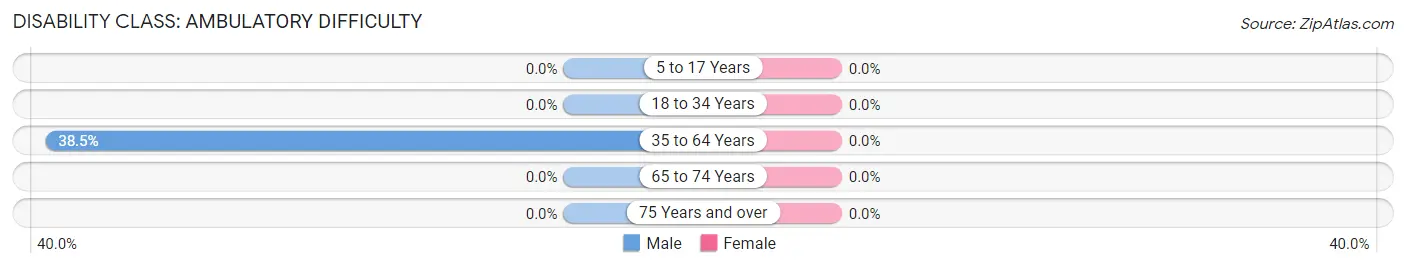
| Age Bracket | Male | Female |
| 5 to 17 Years | 0 (0.0%) | 0 (0.0%) |
| 18 to 34 Years | 0 (0.0%) | 0 (0.0%) |
| 35 to 64 Years | 10 (38.5%) | 0 (0.0%) |
| 65 to 74 Years | 0 (0.0%) | 0 (0.0%) |
| 75 Years and over | 0 (0.0%) | 0 (0.0%) |
Disability Class: Self-Care Difficulty
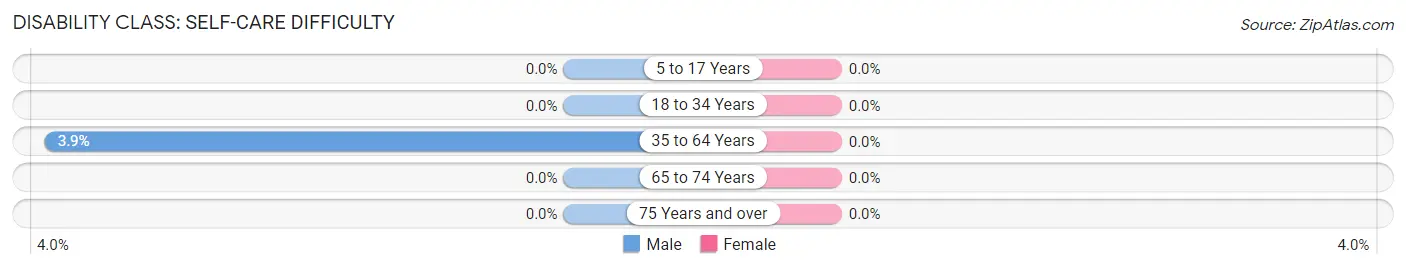
| Age Bracket | Male | Female |
| 5 to 17 Years | 0 (0.0%) | 0 (0.0%) |
| 18 to 34 Years | 0 (0.0%) | 0 (0.0%) |
| 35 to 64 Years | 1 (3.8%) | 0 (0.0%) |
| 65 to 74 Years | 0 (0.0%) | 0 (0.0%) |
| 75 Years and over | 0 (0.0%) | 0 (0.0%) |
Technology Access in Cliffdell
Computing Device Access in Cliffdell
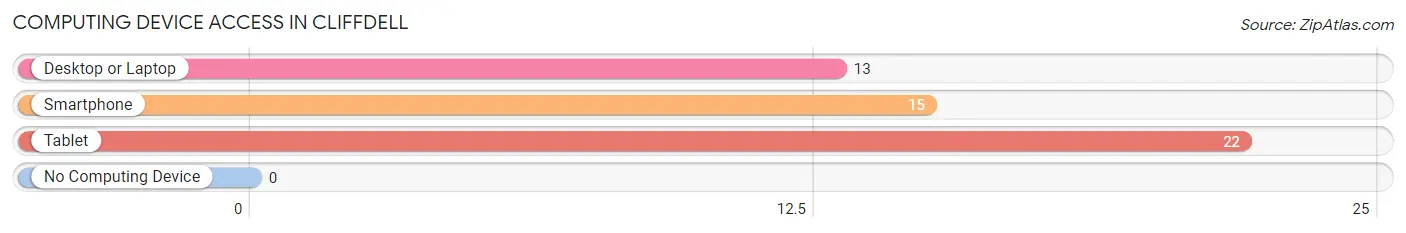
| Device Type | # Households | % Households |
| Desktop or Laptop | 13 | 39.4% |
| Smartphone | 15 | 45.5% |
| Tablet | 22 | 66.7% |
| No Computing Device | 0 | 0.0% |
| Total | 33 | 100.0% |
Internet Access in Cliffdell
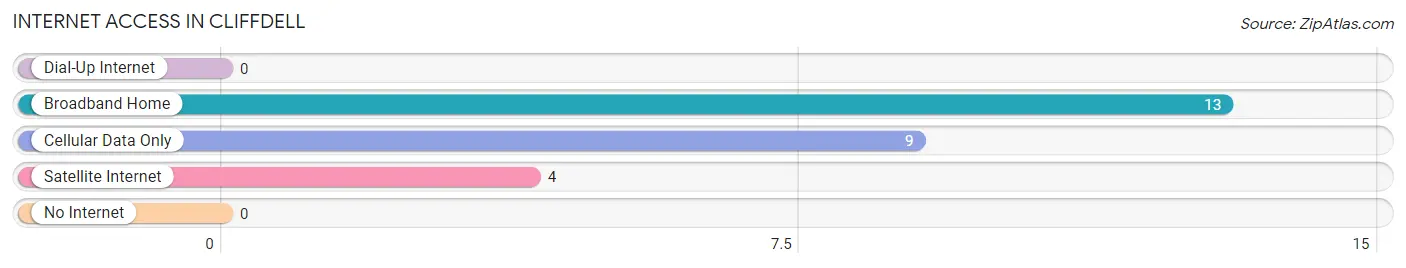
| Internet Type | # Households | % Households |
| Dial-Up Internet | 0 | 0.0% |
| Broadband Home | 13 | 39.4% |
| Cellular Data Only | 9 | 27.3% |
| Satellite Internet | 4 | 12.1% |
| No Internet | 0 | 0.0% |
| Total | 33 | 100.0% |
Cliffdell Summary
Cliffdell is an unincorporated community located in Yakima County, Washington, United States. It is situated in the foothills of the Cascade Mountains, approximately 20 miles east of Yakima. The population of Cliffdell was estimated to be around 200 in 2020.
History
Cliffdell was first settled in the late 1800s by homesteaders who were attracted to the area by its abundant natural resources. The first settlers were mostly of German and Scandinavian descent. The community was named after a nearby cliff, which was named after a local Native American chief.
The first post office in Cliffdell was established in 1891. The town was incorporated in 1909 and the first mayor was elected in 1910. The town was primarily an agricultural community, with the main crops being apples, cherries, and hops.
In the early 1900s, the town was home to several sawmills and a brickyard. The brickyard was destroyed by a fire in the 1920s, but the sawmills continued to operate until the 1950s.
Geography
Cliffdell is located in the foothills of the Cascade Mountains, approximately 20 miles east of Yakima. The town is situated at an elevation of 1,890 feet above sea level. The climate is semi-arid, with hot summers and cold winters.
The town is surrounded by rolling hills and is home to several small lakes and streams. The nearby Naches River is a popular destination for fishing and rafting.
Economy
The economy of Cliffdell is primarily based on agriculture. The main crops are apples, cherries, and hops. The town is also home to several small businesses, including a grocery store, a hardware store, and a restaurant.
Demographics
As of the 2010 census, the population of Cliffdell was estimated to be around 200. The racial makeup of the town was 94.5% White, 0.5% Native American, 0.5% Asian, and 4.5% from other races. The median household income was $37,500.
Conclusion
Cliffdell is a small unincorporated community located in Yakima County, Washington. It is situated in the foothills of the Cascade Mountains and is home to around 200 people. The economy of the town is primarily based on agriculture, with the main crops being apples, cherries, and hops. The town is also home to several small businesses. The racial makeup of the town is predominantly White, with a small percentage of Native American and Asian residents.
Common Questions
What is Per Capita Income in Cliffdell?
Per Capita income in Cliffdell is $65,080.
What is Inequality or Gini Index in Cliffdell?
Inequality or Gini Index in Cliffdell is 0.37.
What is the Total Population of Cliffdell?
Total Population of Cliffdell is 61.
What is the Total Male Population of Cliffdell?
Total Male Population of Cliffdell is 36.
What is the Total Female Population of Cliffdell?
Total Female Population of Cliffdell is 25.
What is the Ratio of Males per 100 Females in Cliffdell?
There are 144.00 Males per 100 Females in Cliffdell.
What is the Ratio of Females per 100 Males in Cliffdell?
There are 69.44 Females per 100 Males in Cliffdell.
What is the Median Population Age in Cliffdell?
Median Population Age in Cliffdell is 58.9 Years.
What is the Average Family Size in Cliffdell
Average Family Size in Cliffdell is 1.9 People.
What is the Average Household Size in Cliffdell
Average Household Size in Cliffdell is 1.8 People.
How Large is the Labor Force in Cliffdell?
There are 36 People in the Labor Forcein in Cliffdell.
What is the Percentage of People in the Labor Force in Cliffdell?
59.0% of People are in the Labor Force in Cliffdell.
What is the Unemployment Rate in Cliffdell?
Unemployment Rate in Cliffdell is 2.8%.