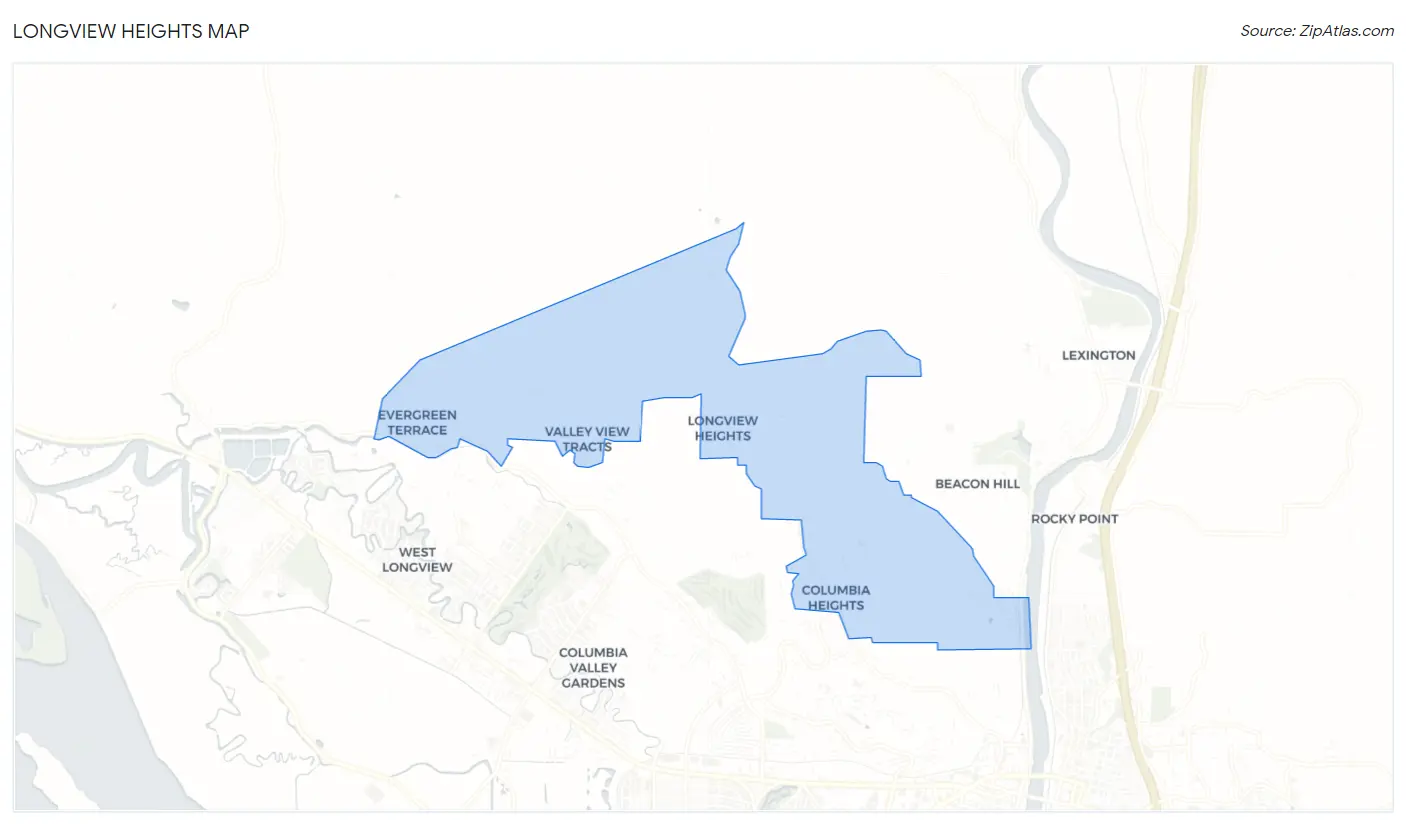
Longview Heights, WA Map & Demographics
Longview Heights Map
Longview Heights Overview
$35,644
PER CAPITA INCOME
$103,333
AVG FAMILY INCOME
$83,833
AVG HOUSEHOLD INCOME
8.9%
WAGE / INCOME GAP [ % ]
91.1¢/ $1
WAGE / INCOME GAP [ $ ]
0.42
INEQUALITY / GINI INDEX
4,199
TOTAL POPULATION
2,187
MALE POPULATION
2,012
FEMALE POPULATION
108.70
MALES / 100 FEMALES
92.00
FEMALES / 100 MALES
40.3
MEDIAN AGE
3.1
AVG FAMILY SIZE
2.7
AVG HOUSEHOLD SIZE
1,764
LABOR FORCE [ PEOPLE ]
54.5%
PERCENT IN LABOR FORCE
6.9%
UNEMPLOYMENT RATE
Income in Longview Heights
Income Overview in Longview Heights
Per Capita Income in Longview Heights is $35,644, while median incomes of families and households are $103,333 and $83,833 respectively.
| Characteristic | Number | Measure |
| Per Capita Income | 4,199 | $35,644 |
| Median Family Income | 1,218 | $103,333 |
| Mean Family Income | 1,218 | $112,850 |
| Median Household Income | 1,562 | $83,833 |
| Mean Household Income | 1,562 | $97,142 |
| Income Deficit | 1,218 | $0 |
| Wage / Income Gap (%) | 4,199 | 8.95% |
| Wage / Income Gap ($) | 4,199 | 91.05¢ per $1 |
| Gini / Inequality Index | 4,199 | 0.42 |
Earnings by Sex in Longview Heights
Average Earnings in Longview Heights are $58,077, $61,964 for men and $56,419 for women, a difference of 8.9%.
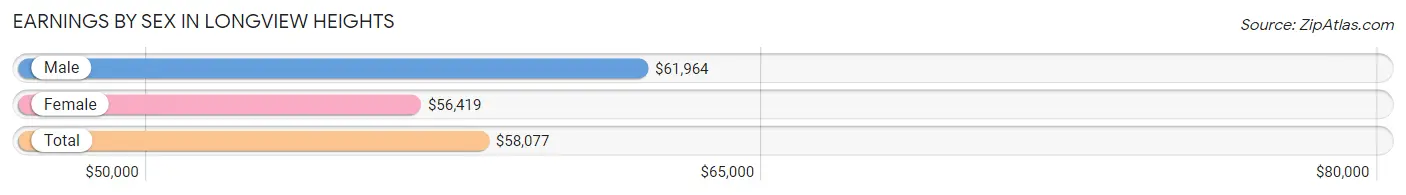
| Sex | Number | Average Earnings |
| Male | 1,091 (56.4%) | $61,964 |
| Female | 843 (43.6%) | $56,419 |
| Total | 1,934 (100.0%) | $58,077 |
Earnings by Sex by Income Bracket in Longview Heights
The most common earnings brackets in Longview Heights are $100,000+ for men (247 | 22.6%) and $100,000+ for women (175 | 20.8%).
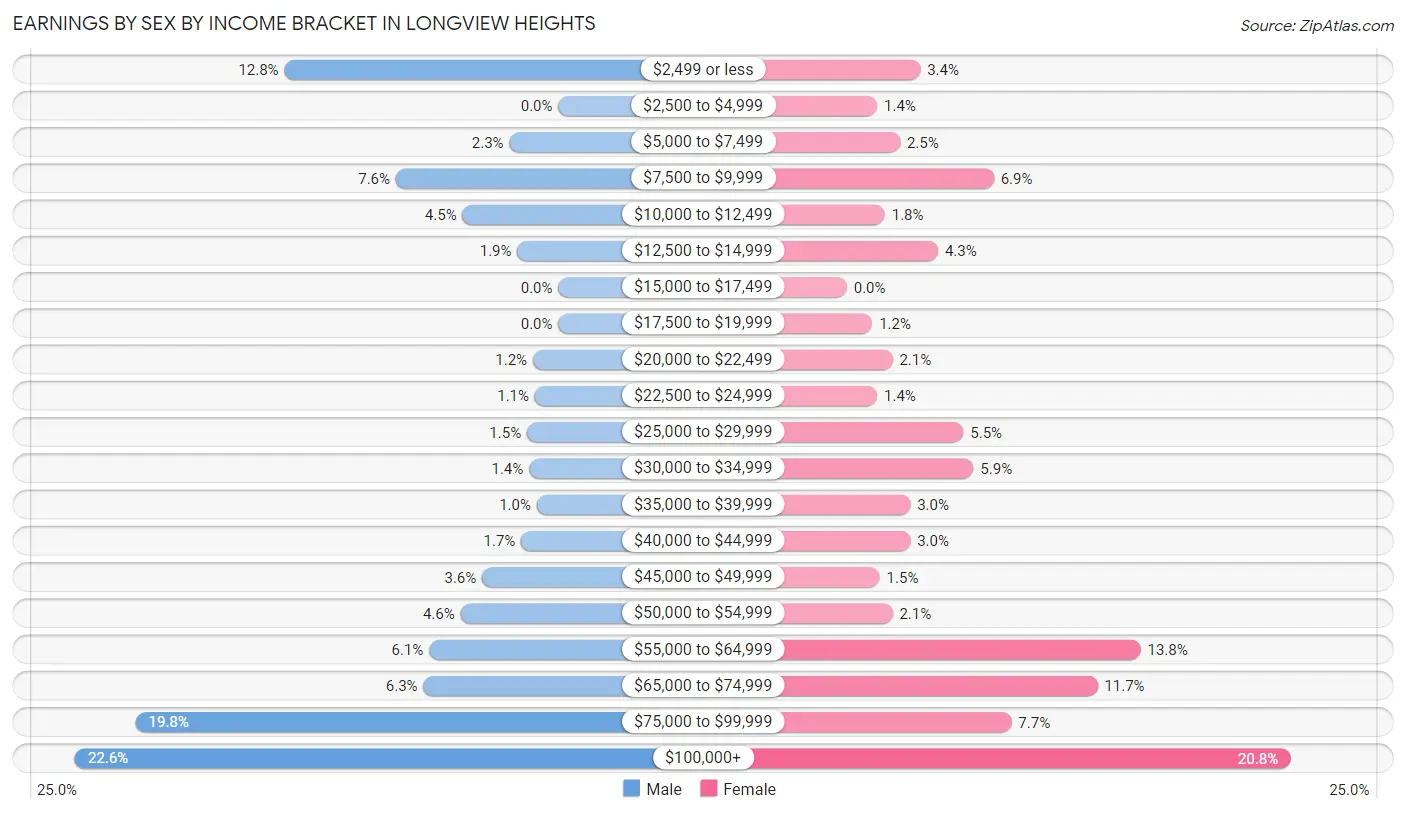
| Income | Male | Female |
| $2,499 or less | 140 (12.8%) | 29 (3.4%) |
| $2,500 to $4,999 | 0 (0.0%) | 12 (1.4%) |
| $5,000 to $7,499 | 25 (2.3%) | 21 (2.5%) |
| $7,500 to $9,999 | 83 (7.6%) | 58 (6.9%) |
| $10,000 to $12,499 | 49 (4.5%) | 15 (1.8%) |
| $12,500 to $14,999 | 21 (1.9%) | 36 (4.3%) |
| $15,000 to $17,499 | 0 (0.0%) | 0 (0.0%) |
| $17,500 to $19,999 | 0 (0.0%) | 10 (1.2%) |
| $20,000 to $22,499 | 13 (1.2%) | 18 (2.1%) |
| $22,500 to $24,999 | 12 (1.1%) | 12 (1.4%) |
| $25,000 to $29,999 | 16 (1.5%) | 46 (5.5%) |
| $30,000 to $34,999 | 15 (1.4%) | 50 (5.9%) |
| $35,000 to $39,999 | 11 (1.0%) | 25 (3.0%) |
| $40,000 to $44,999 | 19 (1.7%) | 25 (3.0%) |
| $45,000 to $49,999 | 39 (3.6%) | 13 (1.5%) |
| $50,000 to $54,999 | 50 (4.6%) | 18 (2.1%) |
| $55,000 to $64,999 | 66 (6.0%) | 116 (13.8%) |
| $65,000 to $74,999 | 69 (6.3%) | 99 (11.7%) |
| $75,000 to $99,999 | 216 (19.8%) | 65 (7.7%) |
| $100,000+ | 247 (22.6%) | 175 (20.8%) |
| Total | 1,091 (100.0%) | 843 (100.0%) |
Earnings by Sex by Educational Attainment in Longview Heights
Average earnings in Longview Heights are $69,767 for men and $63,542 for women, a difference of 8.9%. Men with an educational attainment of bachelor's degree enjoy the highest average annual earnings of $101,591, while those with college or associate's degree education earn the least with $69,508. Women with an educational attainment of graduate degree earn the most with the average annual earnings of $100,221, while those with college or associate's degree education have the smallest earnings of $70,250.
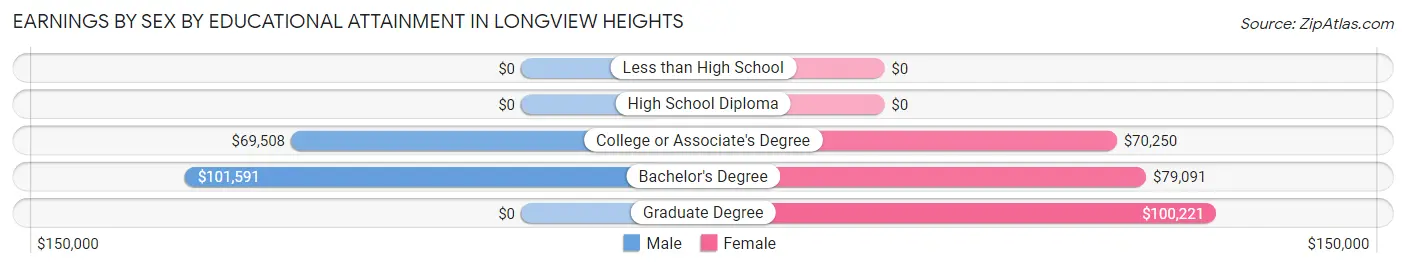
| Educational Attainment | Male Income | Female Income |
| Less than High School | - | - |
| High School Diploma | - | - |
| College or Associate's Degree | $69,508 | $70,250 |
| Bachelor's Degree | $101,591 | $79,091 |
| Graduate Degree | - | - |
| Total | $69,767 | $63,542 |
Family Income in Longview Heights
Family Income Brackets in Longview Heights
According to the Longview Heights family income data, there are 261 families falling into the $150,000 to $199,999 income range, which is the most common income bracket and makes up 21.4% of all families. Conversely, the $10,000 to $14,999 income bracket is the least frequent group with only 26 families (2.1%) belonging to this category.
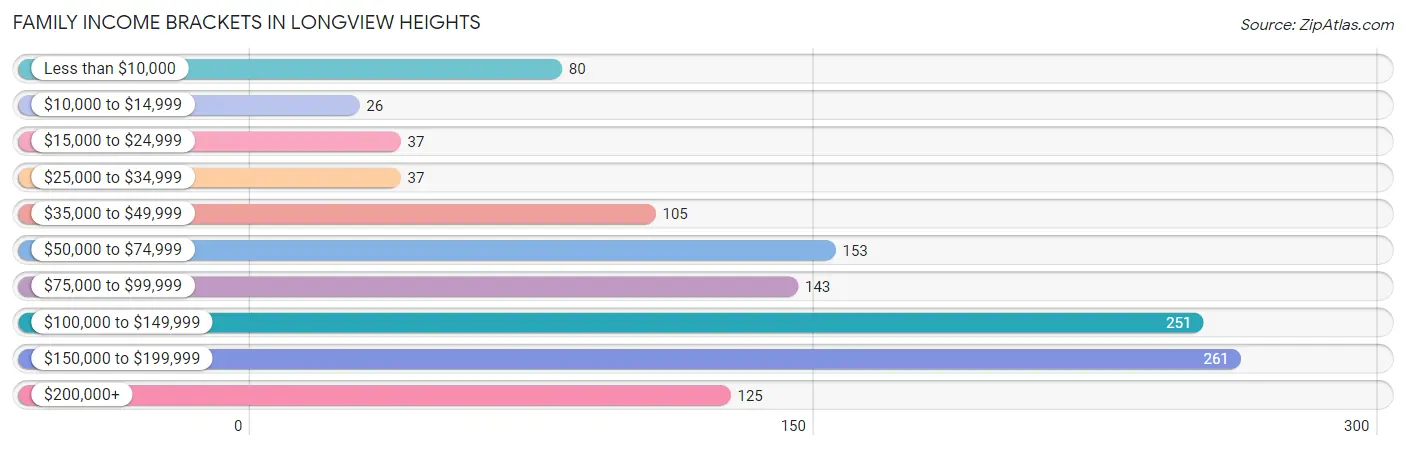
| Income Bracket | # Families | % Families |
| Less than $10,000 | 80 | 6.6% |
| $10,000 to $14,999 | 26 | 2.1% |
| $15,000 to $24,999 | 37 | 3.0% |
| $25,000 to $34,999 | 37 | 3.0% |
| $35,000 to $49,999 | 105 | 8.6% |
| $50,000 to $74,999 | 153 | 12.6% |
| $75,000 to $99,999 | 143 | 11.7% |
| $100,000 to $149,999 | 251 | 20.6% |
| $150,000 to $199,999 | 261 | 21.4% |
| $200,000+ | 125 | 10.3% |
Family Income by Famaliy Size in Longview Heights
4-person families (195 | 16.0%) account for the highest median family income in Longview Heights with $111,849 per family, while 2-person families (609 | 50.0%) have the highest median income of $51,042 per family member.
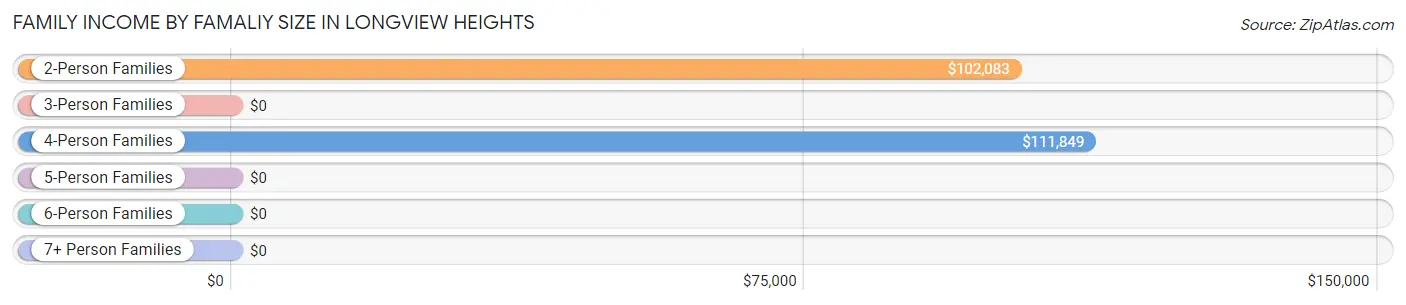
| Income Bracket | # Families | Median Income |
| 2-Person Families | 609 (50.0%) | $102,083 |
| 3-Person Families | 201 (16.5%) | $0 |
| 4-Person Families | 195 (16.0%) | $111,849 |
| 5-Person Families | 91 (7.5%) | $0 |
| 6-Person Families | 32 (2.6%) | $0 |
| 7+ Person Families | 90 (7.4%) | $0 |
| Total | 1,218 (100.0%) | $103,333 |
Family Income by Number of Earners in Longview Heights
The median family income in Longview Heights is $103,333, with families comprising 3+ earners (86) having the highest median family income of $161,071, while families with no earners (196) have the lowest median family income of $44,375, accounting for 7.1% and 16.1% of families, respectively.
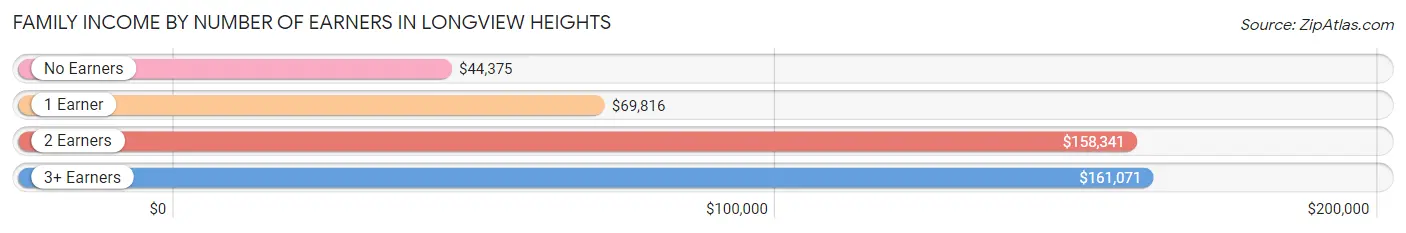
| Number of Earners | # Families | Median Income |
| No Earners | 196 (16.1%) | $44,375 |
| 1 Earner | 391 (32.1%) | $69,816 |
| 2 Earners | 545 (44.8%) | $158,341 |
| 3+ Earners | 86 (7.1%) | $161,071 |
| Total | 1,218 (100.0%) | $103,333 |
Household Income in Longview Heights
Household Income Brackets in Longview Heights
With 273 households falling in the category, the $100,000 to $149,999 income range is the most frequent in Longview Heights, accounting for 17.5% of all households. In contrast, only 55 households (3.5%) fall into the $25,000 to $34,999 income bracket, making it the least populous group.
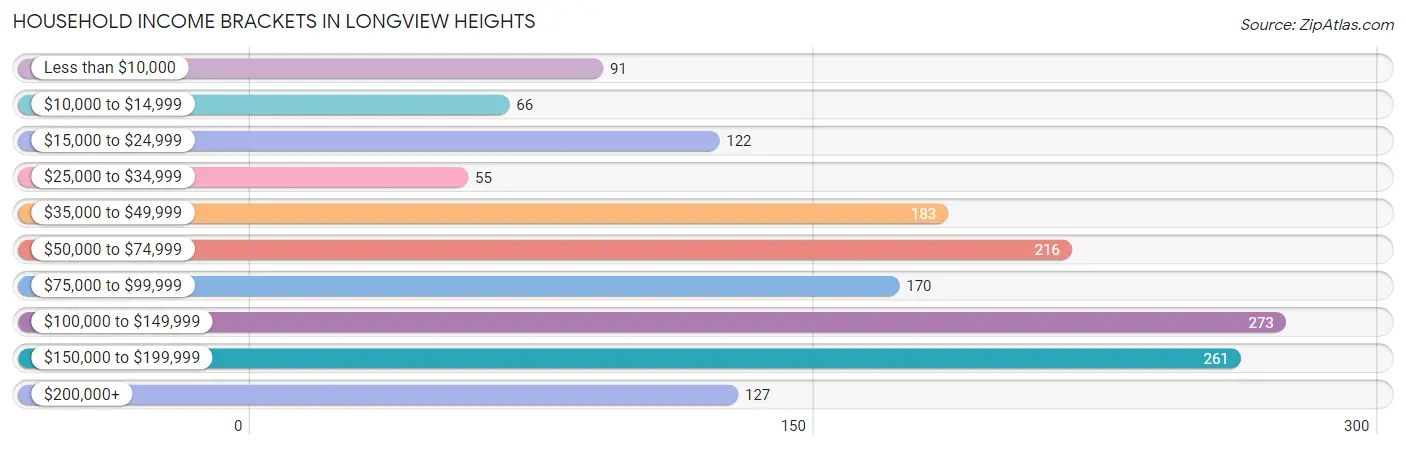
| Income Bracket | # Households | % Households |
| Less than $10,000 | 91 | 5.8% |
| $10,000 to $14,999 | 66 | 4.2% |
| $15,000 to $24,999 | 122 | 7.8% |
| $25,000 to $34,999 | 55 | 3.5% |
| $35,000 to $49,999 | 183 | 11.7% |
| $50,000 to $74,999 | 216 | 13.8% |
| $75,000 to $99,999 | 170 | 10.9% |
| $100,000 to $149,999 | 273 | 17.5% |
| $150,000 to $199,999 | 261 | 16.7% |
| $200,000+ | 127 | 8.1% |
Household Income by Householder Age in Longview Heights
The median household income in Longview Heights is $83,833, with the highest median household income of $106,161 found in the 45 to 64 years age bracket for the primary householder. A total of 619 households (39.6%) fall into this category. Meanwhile, the 15 to 24 years age bracket for the primary householder has the lowest median household income of $0, with 9 households (0.6%) in this group.
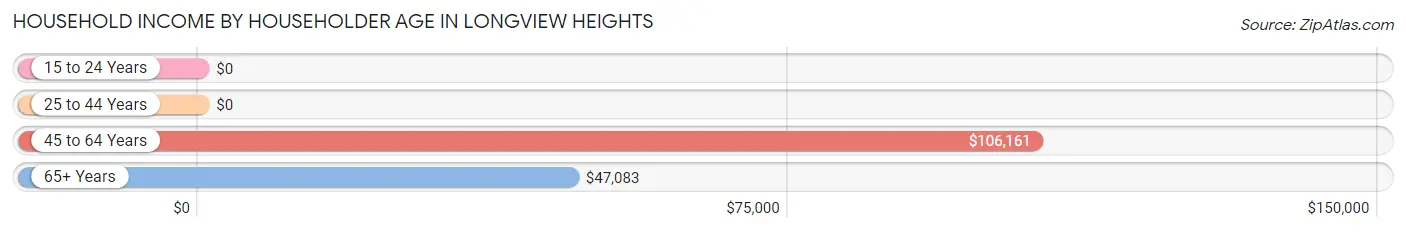
| Income Bracket | # Households | Median Income |
| 15 to 24 Years | 9 (0.6%) | $0 |
| 25 to 44 Years | 453 (29.0%) | $0 |
| 45 to 64 Years | 619 (39.6%) | $106,161 |
| 65+ Years | 481 (30.8%) | $47,083 |
| Total | 1,562 (100.0%) | $83,833 |
Poverty in Longview Heights
Income Below Poverty by Sex and Age in Longview Heights
With 12.0% poverty level for males and 11.0% for females among the residents of Longview Heights, under 5 year old males and 35 to 44 year old females are the most vulnerable to poverty, with 13 males (41.9%) and 68 females (28.9%) in their respective age groups living below the poverty level.
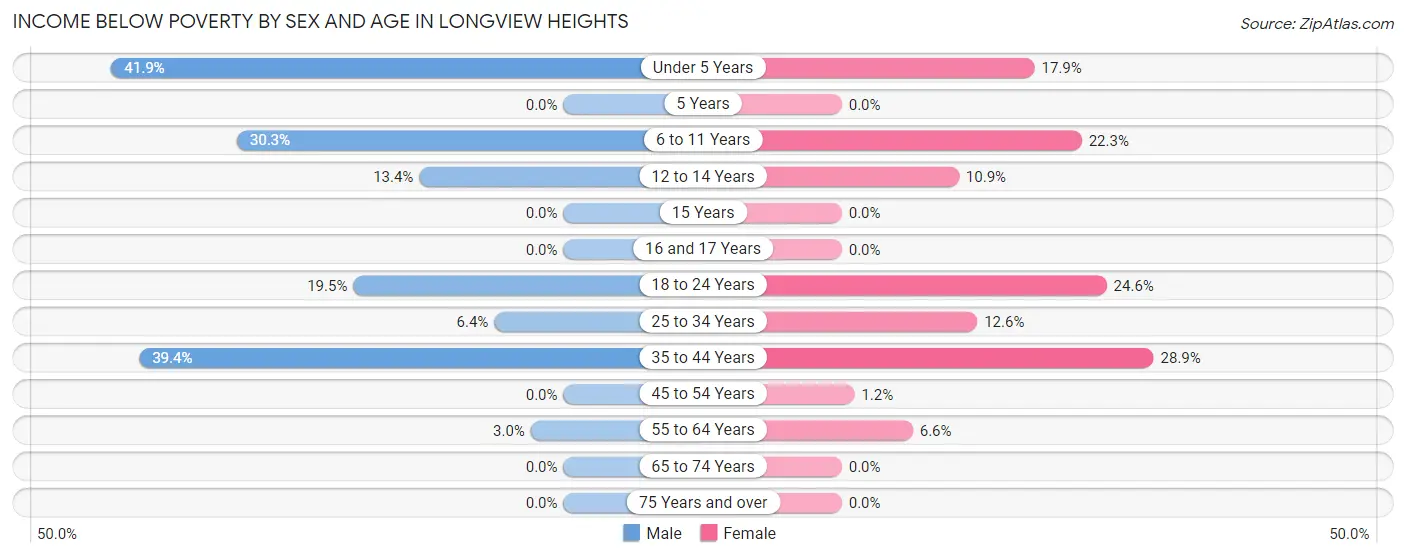
| Age Bracket | Male | Female |
| Under 5 Years | 13 (41.9%) | 17 (17.9%) |
| 5 Years | 0 (0.0%) | 0 (0.0%) |
| 6 to 11 Years | 50 (30.3%) | 55 (22.3%) |
| 12 to 14 Years | 21 (13.4%) | 5 (10.9%) |
| 15 Years | 0 (0.0%) | 0 (0.0%) |
| 16 and 17 Years | 0 (0.0%) | 0 (0.0%) |
| 18 to 24 Years | 39 (19.5%) | 29 (24.6%) |
| 25 to 34 Years | 19 (6.4%) | 24 (12.6%) |
| 35 to 44 Years | 111 (39.4%) | 68 (28.9%) |
| 45 to 54 Years | 0 (0.0%) | 4 (1.2%) |
| 55 to 64 Years | 10 (3.0%) | 17 (6.6%) |
| 65 to 74 Years | 0 (0.0%) | 0 (0.0%) |
| 75 Years and over | 0 (0.0%) | 0 (0.0%) |
| Total | 263 (12.0%) | 219 (11.0%) |
Income Above Poverty by Sex and Age in Longview Heights
According to the poverty statistics in Longview Heights, males aged 5 years and females aged 5 years are the age groups that are most secure financially, with 100.0% of males and 100.0% of females in these age groups living above the poverty line.
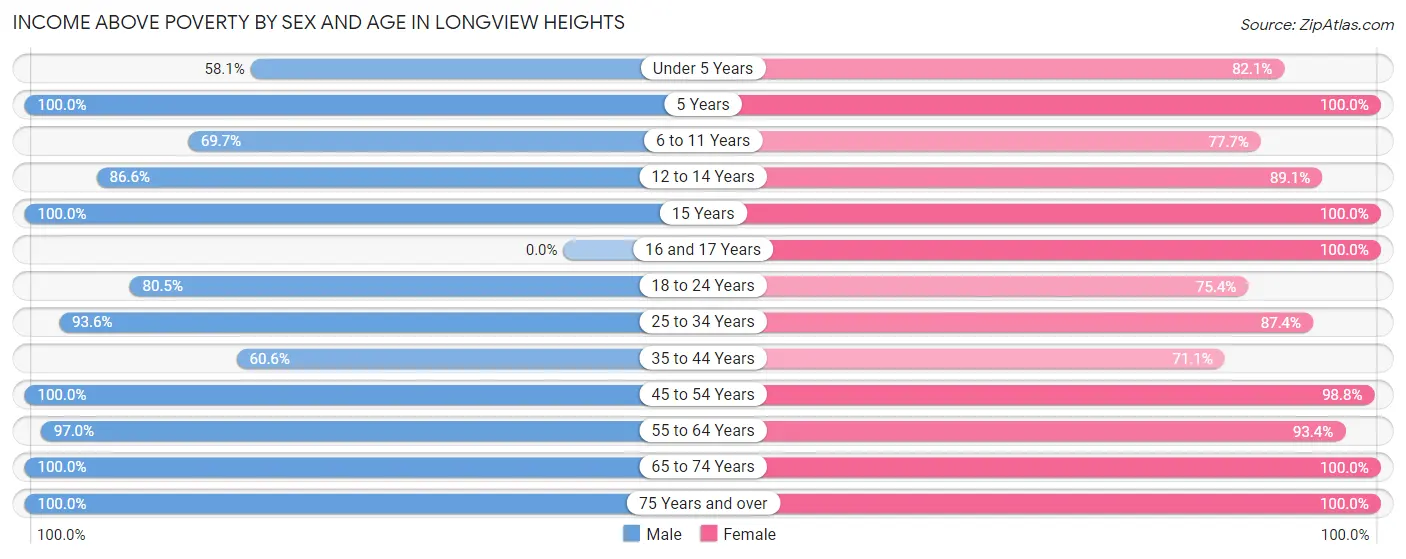
| Age Bracket | Male | Female |
| Under 5 Years | 18 (58.1%) | 78 (82.1%) |
| 5 Years | 20 (100.0%) | 12 (100.0%) |
| 6 to 11 Years | 115 (69.7%) | 192 (77.7%) |
| 12 to 14 Years | 136 (86.6%) | 41 (89.1%) |
| 15 Years | 130 (100.0%) | 33 (100.0%) |
| 16 and 17 Years | 0 (0.0%) | 52 (100.0%) |
| 18 to 24 Years | 161 (80.5%) | 89 (75.4%) |
| 25 to 34 Years | 277 (93.6%) | 167 (87.4%) |
| 35 to 44 Years | 171 (60.6%) | 167 (71.1%) |
| 45 to 54 Years | 257 (100.0%) | 335 (98.8%) |
| 55 to 64 Years | 320 (97.0%) | 241 (93.4%) |
| 65 to 74 Years | 251 (100.0%) | 299 (100.0%) |
| 75 Years and over | 68 (100.0%) | 60 (100.0%) |
| Total | 1,924 (88.0%) | 1,766 (89.0%) |
Income Below Poverty Among Married-Couple Families in Longview Heights
The poverty statistics for married-couple families in Longview Heights show that 6.1% or 59 of the total 963 families live below the poverty line. Families with 3 or 4 children have the highest poverty rate of 23.1%, comprising of 37 families. On the other hand, families with no children have the lowest poverty rate of 0.0%, which includes 0 families.
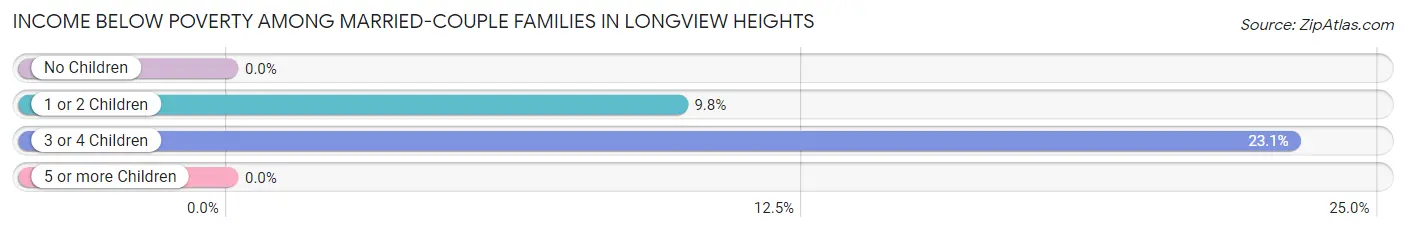
| Children | Above Poverty | Below Poverty |
| No Children | 578 (100.0%) | 0 (0.0%) |
| 1 or 2 Children | 203 (90.2%) | 22 (9.8%) |
| 3 or 4 Children | 123 (76.9%) | 37 (23.1%) |
| 5 or more Children | 0 (0.0%) | 0 (0.0%) |
| Total | 904 (93.9%) | 59 (6.1%) |
Income Below Poverty Among Single-Parent Households in Longview Heights
According to the poverty data in Longview Heights, 16.0% or 19 single-father households and 38.2% or 52 single-mother households are living below the poverty line. Among single-father households, those with 1 or 2 children have the highest poverty rate, with 19 households (19.2%) experiencing poverty. Likewise, among single-mother households, those with no children have the highest poverty rate, with 48 households (57.1%) falling below the poverty line.
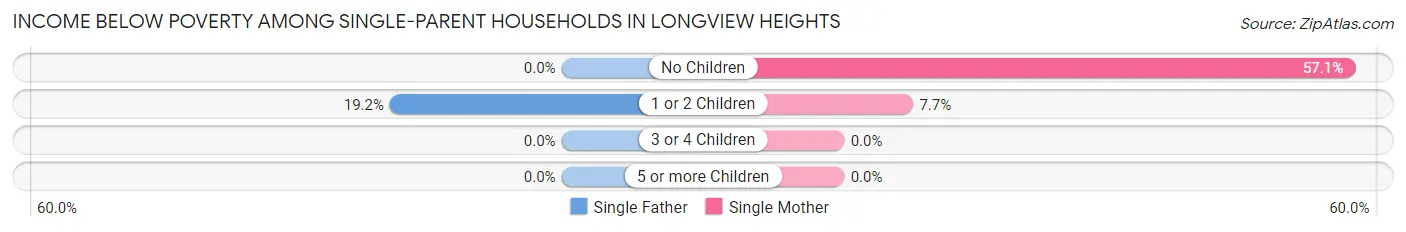
| Children | Single Father | Single Mother |
| No Children | 0 (0.0%) | 48 (57.1%) |
| 1 or 2 Children | 19 (19.2%) | 4 (7.7%) |
| 3 or 4 Children | 0 (0.0%) | 0 (0.0%) |
| 5 or more Children | 0 (0.0%) | 0 (0.0%) |
| Total | 19 (16.0%) | 52 (38.2%) |
Income Below Poverty Among Married-Couple vs Single-Parent Households in Longview Heights
The poverty data for Longview Heights shows that 59 of the married-couple family households (6.1%) and 71 of the single-parent households (27.8%) are living below the poverty level. Within the married-couple family households, those with 3 or 4 children have the highest poverty rate, with 37 households (23.1%) falling below the poverty line. Among the single-parent households, those with no children have the highest poverty rate, with 48 household (46.2%) living below poverty.
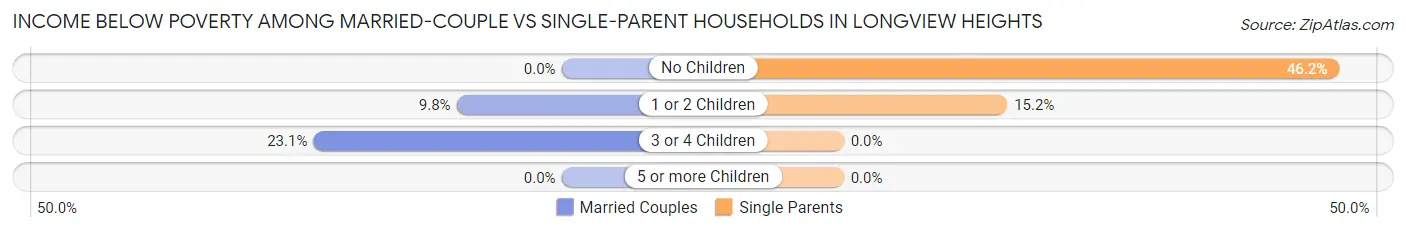
| Children | Married-Couple Families | Single-Parent Households |
| No Children | 0 (0.0%) | 48 (46.2%) |
| 1 or 2 Children | 22 (9.8%) | 23 (15.2%) |
| 3 or 4 Children | 37 (23.1%) | 0 (0.0%) |
| 5 or more Children | 0 (0.0%) | 0 (0.0%) |
| Total | 59 (6.1%) | 71 (27.8%) |
Race in Longview Heights
The most populous races in Longview Heights are White / Caucasian (3,633 | 86.5%), Hispanic or Latino (334 | 8.0%), and Two or more Races (282 | 6.7%).
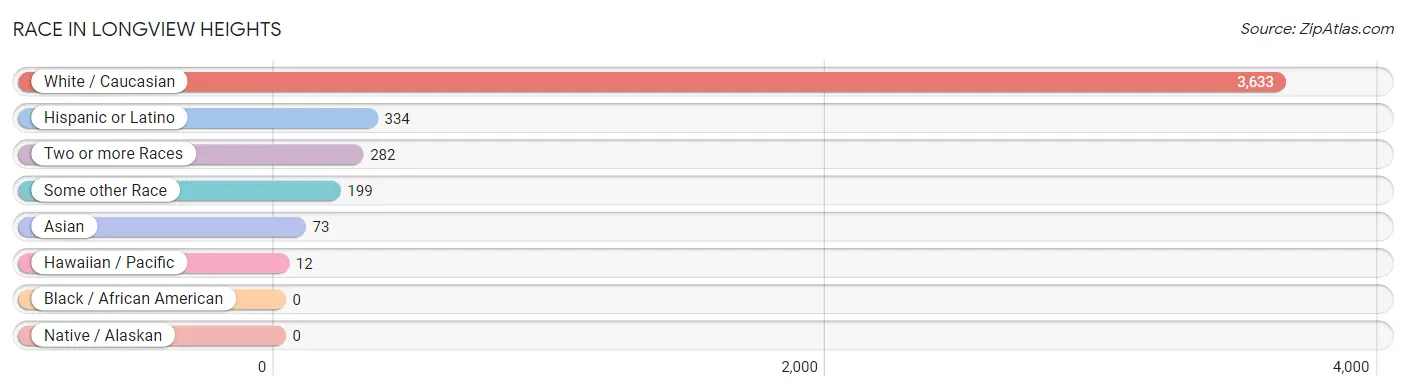
| Race | # Population | % Population |
| Asian | 73 | 1.7% |
| Black / African American | 0 | 0.0% |
| Hawaiian / Pacific | 12 | 0.3% |
| Hispanic or Latino | 334 | 8.0% |
| Native / Alaskan | 0 | 0.0% |
| White / Caucasian | 3,633 | 86.5% |
| Two or more Races | 282 | 6.7% |
| Some other Race | 199 | 4.7% |
| Total | 4,199 | 100.0% |
Ancestry in Longview Heights
The most populous ancestries reported in Longview Heights are English (750 | 17.9%), German (537 | 12.8%), Irish (376 | 8.9%), Mexican (231 | 5.5%), and Norwegian (218 | 5.2%), together accounting for 50.3% of all Longview Heights residents.
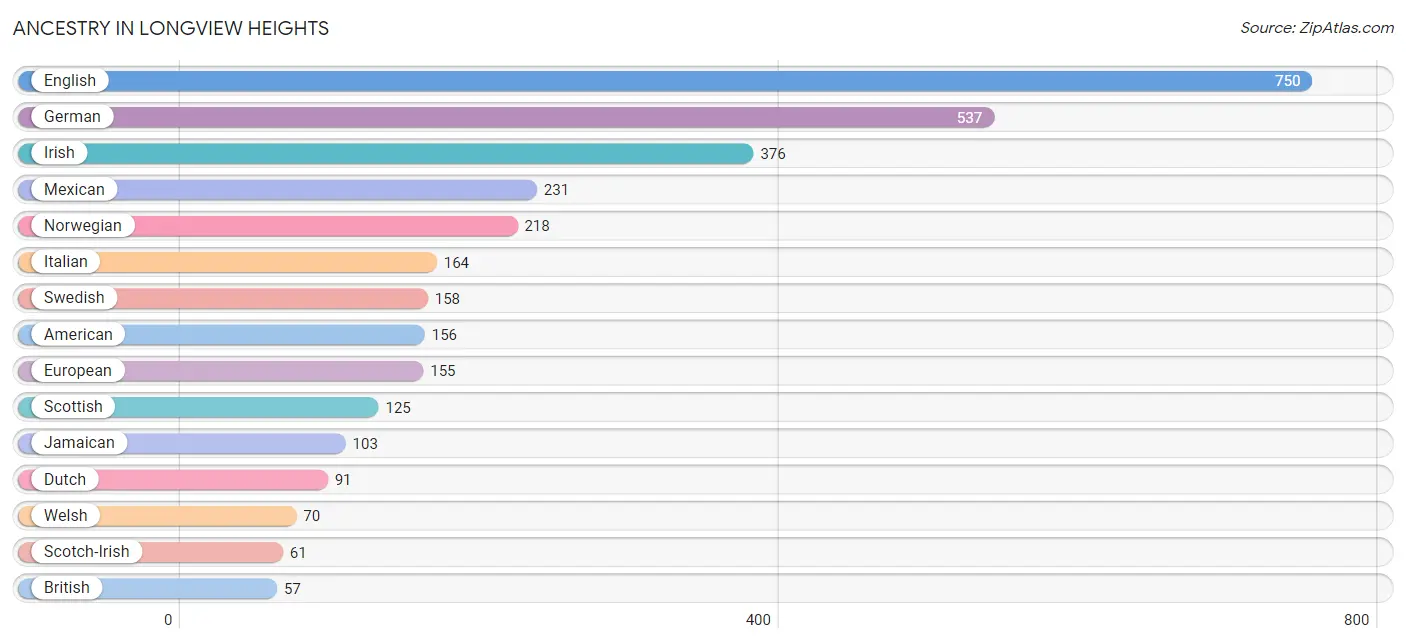
| Ancestry | # Population | % Population |
| American | 156 | 3.7% |
| Arab | 51 | 1.2% |
| Bhutanese | 8 | 0.2% |
| British | 57 | 1.4% |
| Burmese | 12 | 0.3% |
| Central American | 9 | 0.2% |
| Cuban | 48 | 1.1% |
| Danish | 14 | 0.3% |
| Dutch | 91 | 2.2% |
| English | 750 | 17.9% |
| European | 155 | 3.7% |
| Finnish | 27 | 0.6% |
| French | 42 | 1.0% |
| German | 537 | 12.8% |
| Honduran | 9 | 0.2% |
| Icelander | 8 | 0.2% |
| Indian (Asian) | 24 | 0.6% |
| Irish | 376 | 8.9% |
| Italian | 164 | 3.9% |
| Jamaican | 103 | 2.5% |
| Japanese | 40 | 0.9% |
| Korean | 8 | 0.2% |
| Lebanese | 11 | 0.3% |
| Mexican | 231 | 5.5% |
| Native Hawaiian | 12 | 0.3% |
| Norwegian | 218 | 5.2% |
| Polish | 48 | 1.1% |
| Portuguese | 22 | 0.5% |
| Romanian | 38 | 0.9% |
| Russian | 14 | 0.3% |
| Scandinavian | 38 | 0.9% |
| Scotch-Irish | 61 | 1.5% |
| Scottish | 125 | 3.0% |
| Spaniard | 8 | 0.2% |
| Spanish | 38 | 0.9% |
| Swedish | 158 | 3.8% |
| Ukrainian | 9 | 0.2% |
| Welsh | 70 | 1.7% | View All 38 Rows |
Immigrants in Longview Heights
The most numerous immigrant groups reported in Longview Heights came from Central America (59 | 1.4%), Latin America (59 | 1.4%), Mexico (59 | 1.4%), Asia (33 | 0.8%), and Eastern Asia (25 | 0.6%), together accounting for 5.6% of all Longview Heights residents.
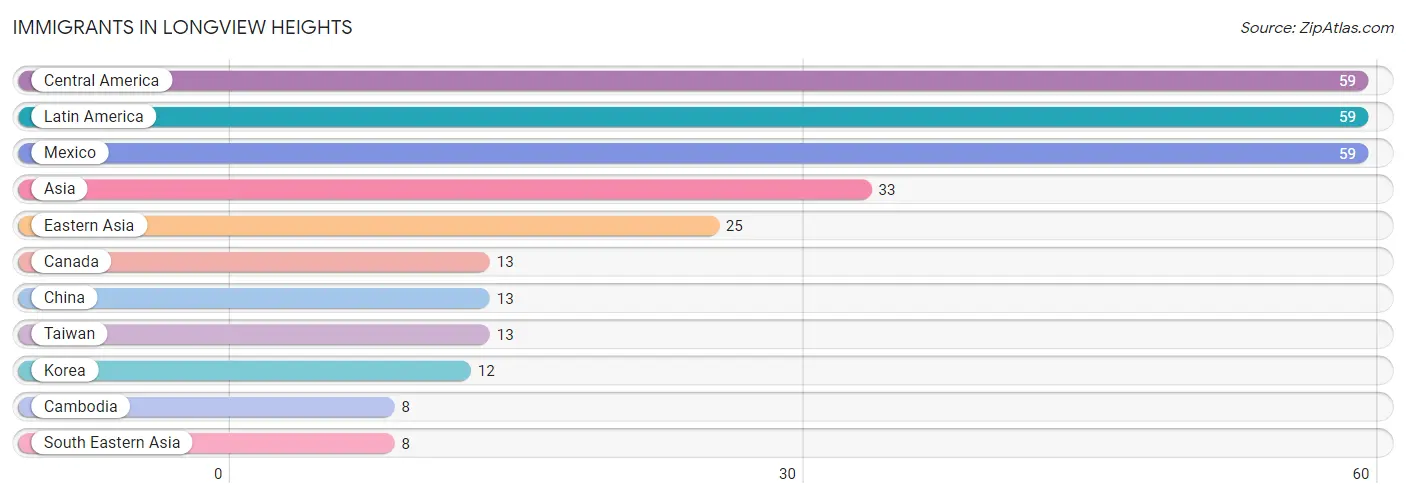
| Immigration Origin | # Population | % Population |
| Asia | 33 | 0.8% |
| Cambodia | 8 | 0.2% |
| Canada | 13 | 0.3% |
| Central America | 59 | 1.4% |
| China | 13 | 0.3% |
| Eastern Asia | 25 | 0.6% |
| Korea | 12 | 0.3% |
| Latin America | 59 | 1.4% |
| Mexico | 59 | 1.4% |
| South Eastern Asia | 8 | 0.2% |
| Taiwan | 13 | 0.3% | View All 11 Rows |
Sex and Age in Longview Heights
Sex and Age in Longview Heights
The most populous age groups in Longview Heights are 10 to 14 Years (211 | 9.7%) for men and 10 to 14 Years (195 | 9.7%) for women.
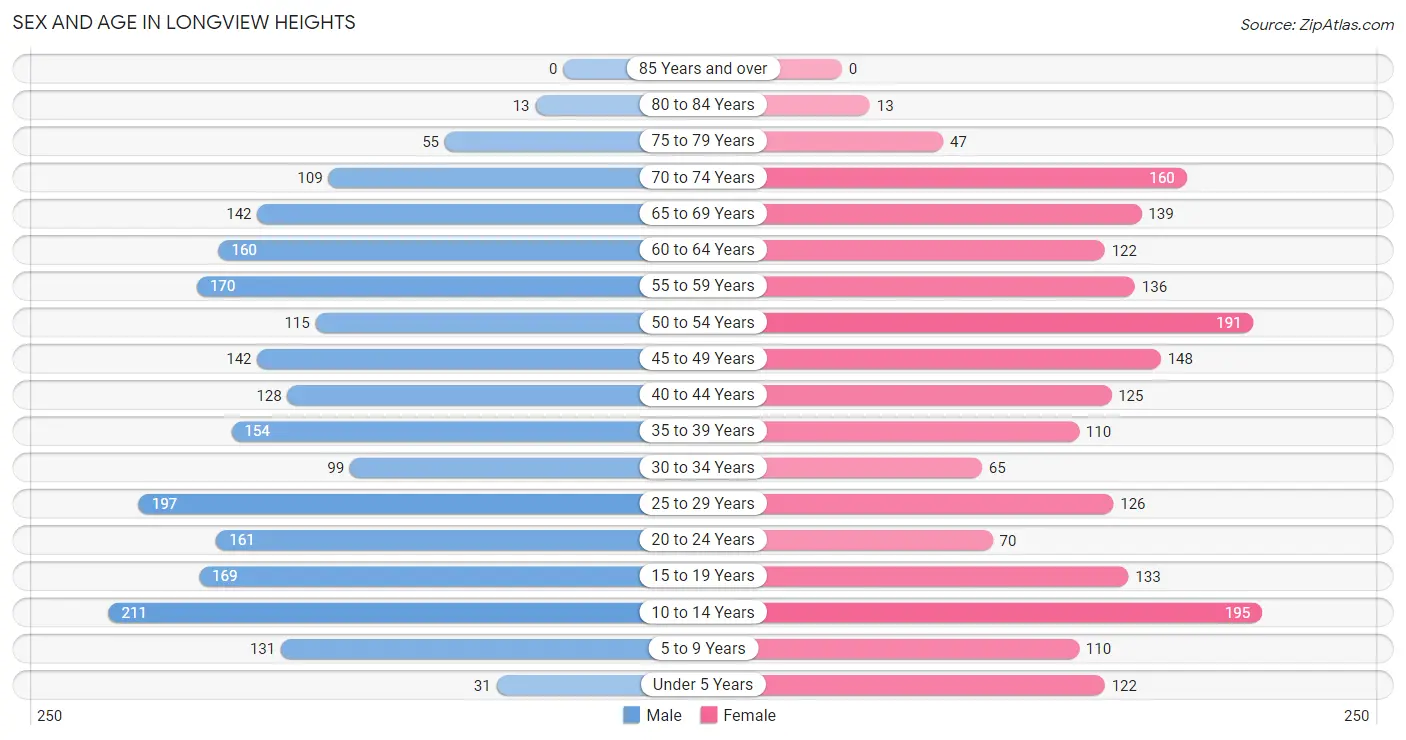
| Age Bracket | Male | Female |
| Under 5 Years | 31 (1.4%) | 122 (6.1%) |
| 5 to 9 Years | 131 (6.0%) | 110 (5.5%) |
| 10 to 14 Years | 211 (9.7%) | 195 (9.7%) |
| 15 to 19 Years | 169 (7.7%) | 133 (6.6%) |
| 20 to 24 Years | 161 (7.4%) | 70 (3.5%) |
| 25 to 29 Years | 197 (9.0%) | 126 (6.3%) |
| 30 to 34 Years | 99 (4.5%) | 65 (3.2%) |
| 35 to 39 Years | 154 (7.0%) | 110 (5.5%) |
| 40 to 44 Years | 128 (5.9%) | 125 (6.2%) |
| 45 to 49 Years | 142 (6.5%) | 148 (7.4%) |
| 50 to 54 Years | 115 (5.3%) | 191 (9.5%) |
| 55 to 59 Years | 170 (7.8%) | 136 (6.8%) |
| 60 to 64 Years | 160 (7.3%) | 122 (6.1%) |
| 65 to 69 Years | 142 (6.5%) | 139 (6.9%) |
| 70 to 74 Years | 109 (5.0%) | 160 (8.0%) |
| 75 to 79 Years | 55 (2.5%) | 47 (2.3%) |
| 80 to 84 Years | 13 (0.6%) | 13 (0.6%) |
| 85 Years and over | 0 (0.0%) | 0 (0.0%) |
| Total | 2,187 (100.0%) | 2,012 (100.0%) |
Families and Households in Longview Heights
Median Family Size in Longview Heights
The median family size in Longview Heights is 3.13 persons per family, with married-couple families (963 | 79.1%) accounting for the largest median family size of 3.24 persons per family. On the other hand, single male/father families (119 | 9.8%) represent the smallest median family size with 2.27 persons per family.
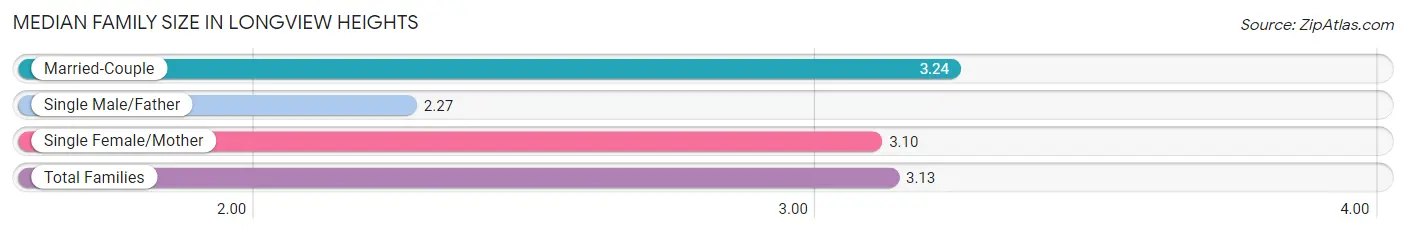
| Family Type | # Families | Family Size |
| Married-Couple | 963 (79.1%) | 3.24 |
| Single Male/Father | 119 (9.8%) | 2.27 |
| Single Female/Mother | 136 (11.2%) | 3.10 |
| Total Families | 1,218 (100.0%) | 3.13 |
Median Household Size in Longview Heights
The median household size in Longview Heights is 2.69 persons per household, with single female/mother households (136 | 8.7%) accounting for the largest median household size of 3.29 persons per household. non-family households (344 | 22.0%) represent the smallest median household size with 1.03 persons per household.
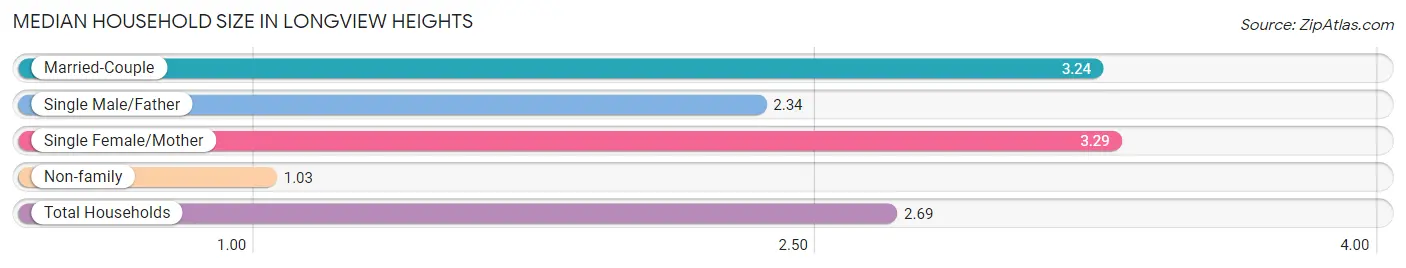
| Household Type | # Households | Household Size |
| Married-Couple | 963 (61.7%) | 3.24 |
| Single Male/Father | 119 (7.6%) | 2.34 |
| Single Female/Mother | 136 (8.7%) | 3.29 |
| Non-family | 344 (22.0%) | 1.03 |
| Total Households | 1,562 (100.0%) | 2.69 |
Household Size by Marriage Status in Longview Heights
Out of a total of 1,562 households in Longview Heights, 1,218 (78.0%) are family households, while 344 (22.0%) are nonfamily households. The most numerous type of family households are 2-person households, comprising 569, and the most common type of nonfamily households are 1-person households, comprising 335.
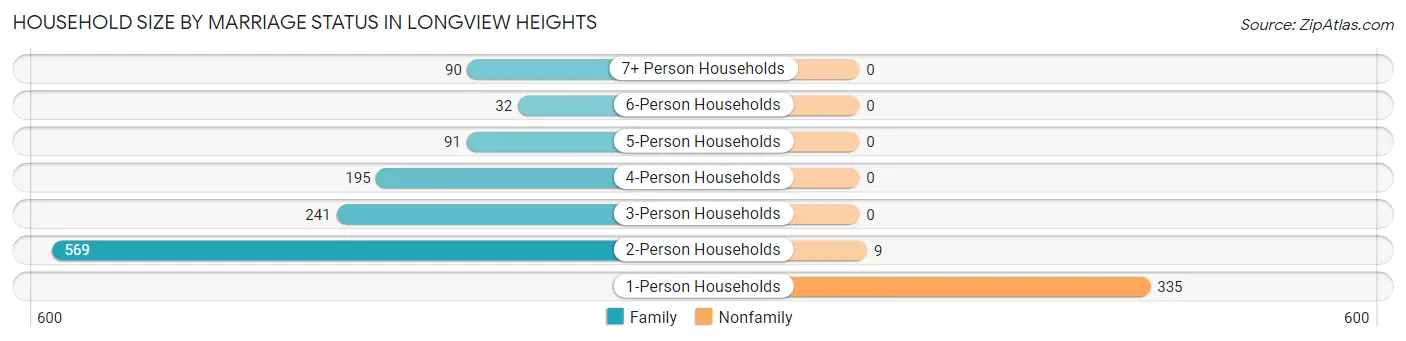
| Household Size | Family Households | Nonfamily Households |
| 1-Person Households | - | 335 (21.4%) |
| 2-Person Households | 569 (36.4%) | 9 (0.6%) |
| 3-Person Households | 241 (15.4%) | 0 (0.0%) |
| 4-Person Households | 195 (12.5%) | 0 (0.0%) |
| 5-Person Households | 91 (5.8%) | 0 (0.0%) |
| 6-Person Households | 32 (2.1%) | 0 (0.0%) |
| 7+ Person Households | 90 (5.8%) | 0 (0.0%) |
| Total | 1,218 (78.0%) | 344 (22.0%) |
Female Fertility in Longview Heights
Fertility by Age in Longview Heights
Average fertility rate in Longview Heights is 19.0 births per 1,000 women. Women in the age bracket of 35 to 50 years have the highest fertility rate with 38.0 births per 1,000 women. Women in the age bracket of 35 to 50 years acount for 100.0% of all women with births.
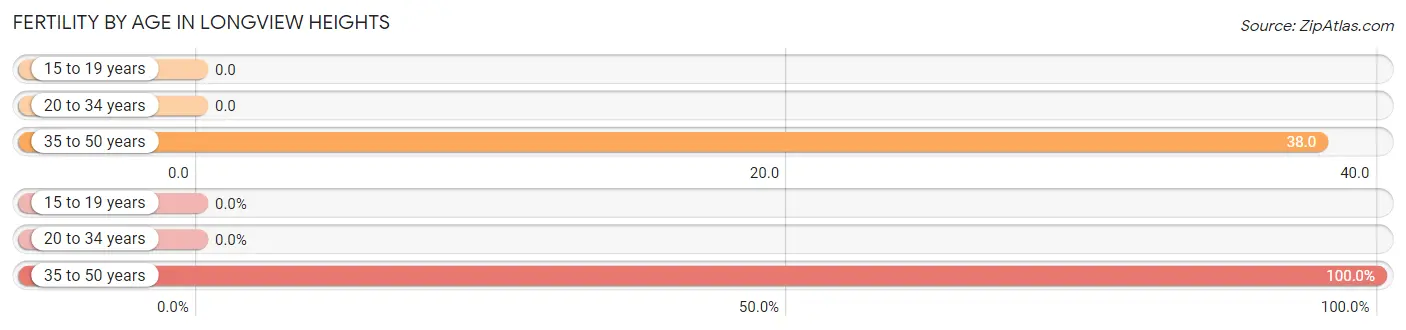
| Age Bracket | Women with Births | Births / 1,000 Women |
| 15 to 19 years | 0 (0.0%) | 0.0 |
| 20 to 34 years | 0 (0.0%) | 0.0 |
| 35 to 50 years | 15 (100.0%) | 38.0 |
| Total | 15 (100.0%) | 19.0 |
Fertility by Age by Marriage Status in Longview Heights
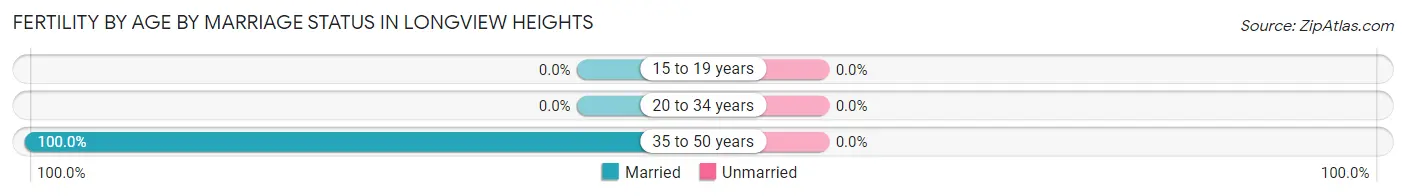
| Age Bracket | Married | Unmarried |
| 15 to 19 years | 0 (0.0%) | 0 (0.0%) |
| 20 to 34 years | 0 (0.0%) | 0 (0.0%) |
| 35 to 50 years | 15 (100.0%) | 0 (0.0%) |
| Total | 15 (100.0%) | 0 (0.0%) |
Fertility by Education in Longview Heights
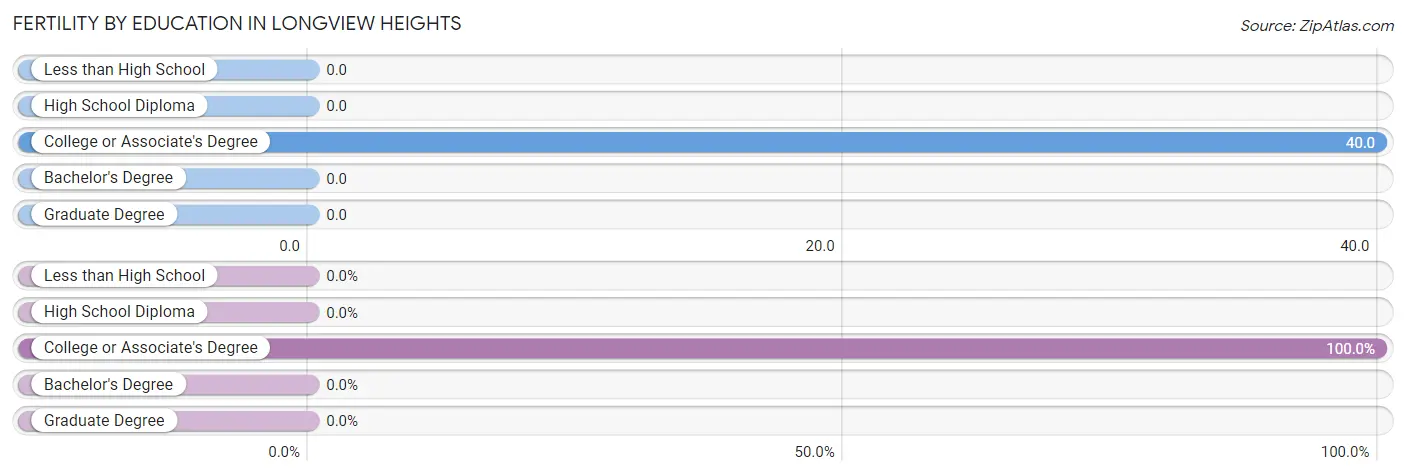
| Educational Attainment | Women with Births | Births / 1,000 Women |
| Less than High School | 0 (0.0%) | 0.0 |
| High School Diploma | 0 (0.0%) | 0.0 |
| College or Associate's Degree | 15 (100.0%) | 40.0 |
| Bachelor's Degree | 0 (0.0%) | 0.0 |
| Graduate Degree | 0 (0.0%) | 0.0 |
| Total | 15 (100.0%) | 19.0 |
Fertility by Education by Marriage Status in Longview Heights
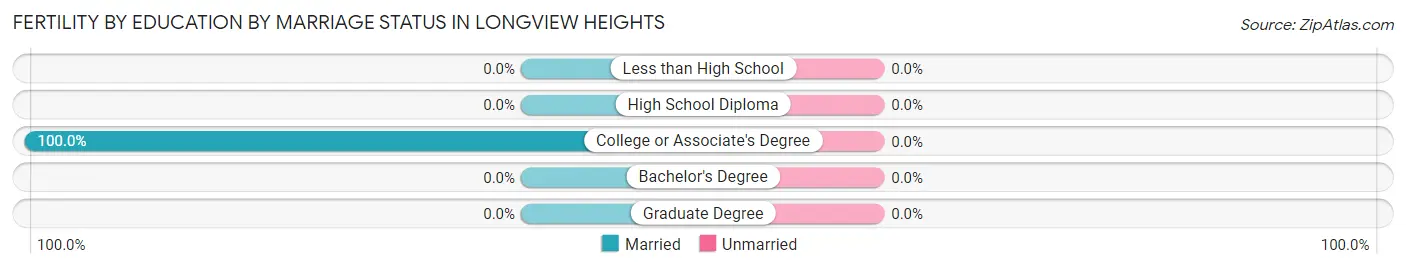
| Educational Attainment | Married | Unmarried |
| Less than High School | 0 (0.0%) | 0 (0.0%) |
| High School Diploma | 0 (0.0%) | 0 (0.0%) |
| College or Associate's Degree | 15 (100.0%) | 0 (0.0%) |
| Bachelor's Degree | 0 (0.0%) | 0 (0.0%) |
| Graduate Degree | 0 (0.0%) | 0 (0.0%) |
| Total | 15 (100.0%) | 0 (0.0%) |
Employment Characteristics in Longview Heights
Employment by Class of Employer in Longview Heights
Among the 1,526 employed individuals in Longview Heights, private company employees (935 | 61.3%), local government employees (213 | 14.0%), and not-for-profit organizations (172 | 11.3%) make up the most common classes of employment.
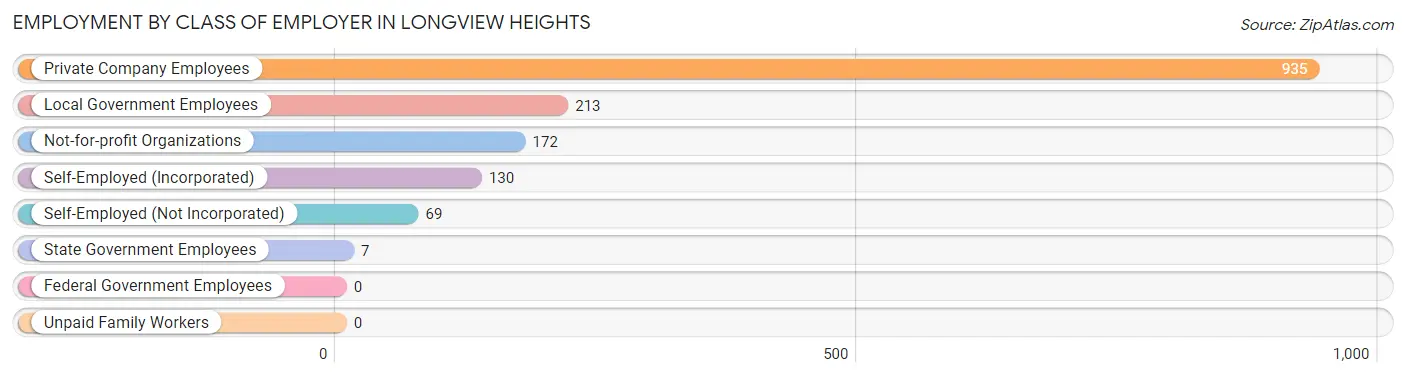
| Employer Class | # Employees | % Employees |
| Private Company Employees | 935 | 61.3% |
| Self-Employed (Incorporated) | 130 | 8.5% |
| Self-Employed (Not Incorporated) | 69 | 4.5% |
| Not-for-profit Organizations | 172 | 11.3% |
| Local Government Employees | 213 | 14.0% |
| State Government Employees | 7 | 0.5% |
| Federal Government Employees | 0 | 0.0% |
| Unpaid Family Workers | 0 | 0.0% |
| Total | 1,526 | 100.0% |
Employment Status by Age in Longview Heights
According to the labor force statistics for Longview Heights, out of the total population over 16 years of age (3,236), 54.5% or 1,764 individuals are in the labor force, with 6.9% or 122 of them unemployed. The age group with the highest labor force participation rate is 30 to 34 years, with 89.0% or 146 individuals in the labor force. Within the labor force, the 25 to 29 years age range has the highest percentage of unemployed individuals, with 53.5% or 77 of them being unemployed.
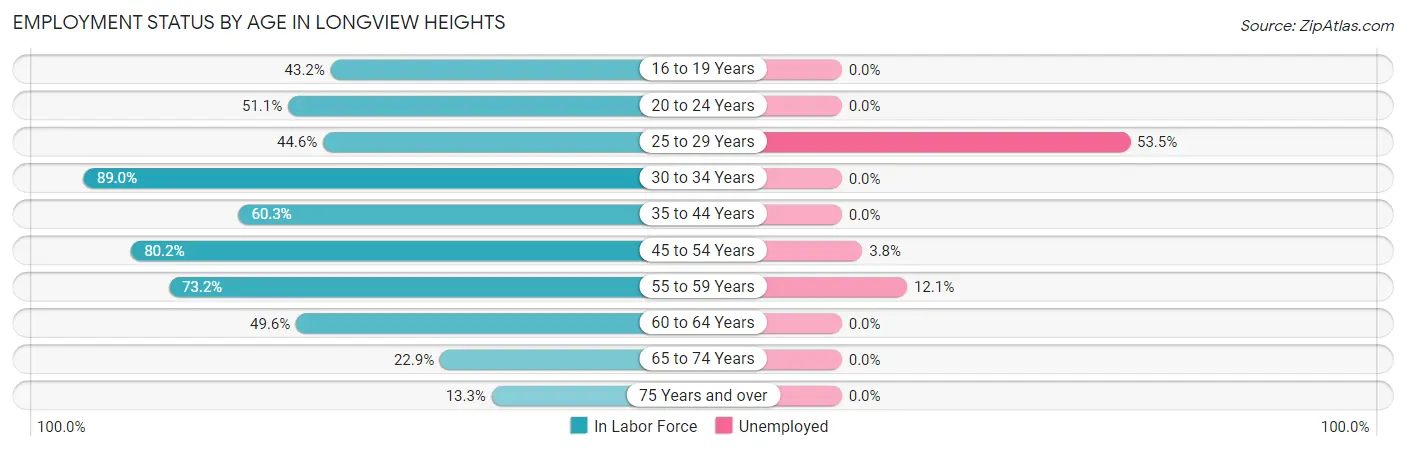
| Age Bracket | In Labor Force | Unemployed |
| 16 to 19 Years | 60 (43.2%) | 0 (0.0%) |
| 20 to 24 Years | 118 (51.1%) | 0 (0.0%) |
| 25 to 29 Years | 144 (44.6%) | 77 (53.5%) |
| 30 to 34 Years | 146 (89.0%) | 0 (0.0%) |
| 35 to 44 Years | 312 (60.3%) | 0 (0.0%) |
| 45 to 54 Years | 478 (80.2%) | 18 (3.8%) |
| 55 to 59 Years | 224 (73.2%) | 27 (12.1%) |
| 60 to 64 Years | 140 (49.6%) | 0 (0.0%) |
| 65 to 74 Years | 126 (22.9%) | 0 (0.0%) |
| 75 Years and over | 17 (13.3%) | 0 (0.0%) |
| Total | 1,764 (54.5%) | 122 (6.9%) |
Employment Status by Educational Attainment in Longview Heights
According to labor force statistics for Longview Heights, 66.0% of individuals (1,444) out of the total population between 25 and 64 years of age (2,188) are in the labor force, with 8.4% or 121 of them being unemployed. The group with the highest labor force participation rate are those with the educational attainment of college / associate degree, with 72.3% or 796 individuals in the labor force. Within the labor force, individuals with bachelor's degree or higher education have the highest percentage of unemployment, with 14.6% or 35 of them being unemployed.
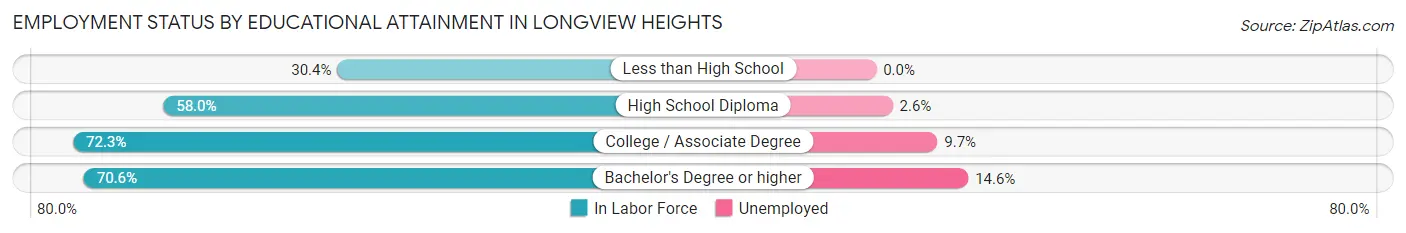
| Educational Attainment | In Labor Force | Unemployed |
| Less than High School | 28 (30.4%) | 0 (0.0%) |
| High School Diploma | 380 (58.0%) | 17 (2.6%) |
| College / Associate Degree | 796 (72.3%) | 107 (9.7%) |
| Bachelor's Degree or higher | 240 (70.6%) | 50 (14.6%) |
| Total | 1,444 (66.0%) | 184 (8.4%) |
Employment Occupations by Sex in Longview Heights
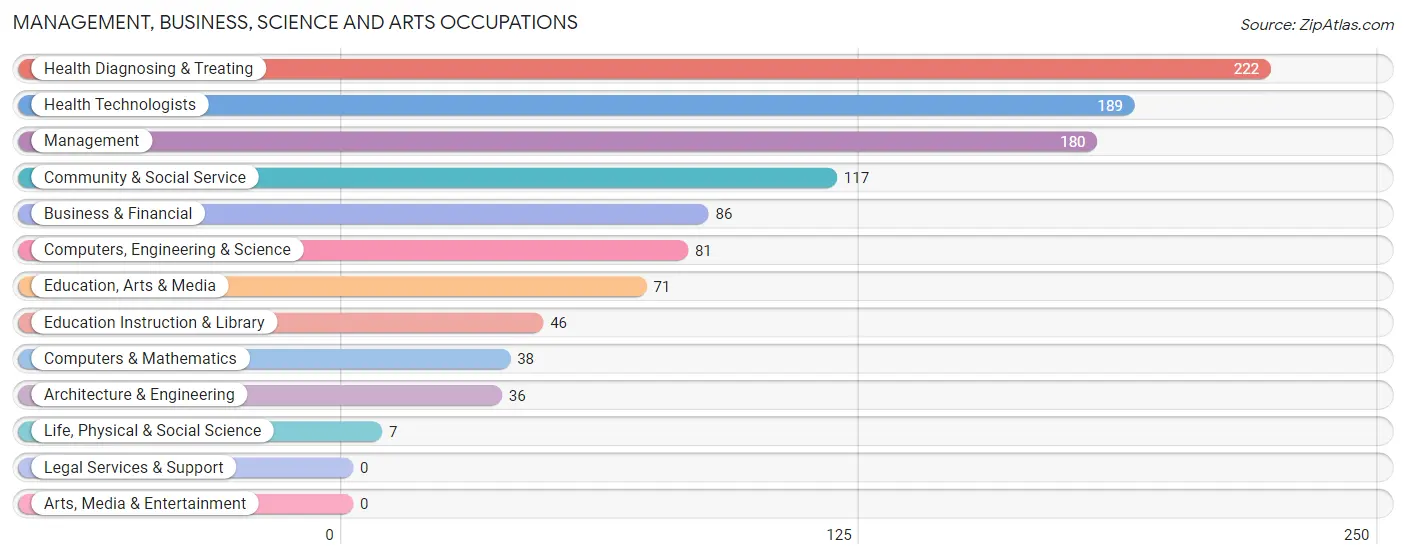
Management, Business, Science and Arts Occupations
The most common Management, Business, Science and Arts occupations in Longview Heights are Health Diagnosing & Treating (222 | 13.5%), Health Technologists (189 | 11.5%), Management (180 | 11.0%), Community & Social Service (117 | 7.1%), and Business & Financial (86 | 5.2%).
Management, Business, Science and Arts Occupations by Sex
Within the Management, Business, Science and Arts occupations in Longview Heights, the most male-oriented occupations are Architecture & Engineering (100.0%), Education, Arts & Media (100.0%), and Community & Social Service (85.5%), while the most female-oriented occupations are Life, Physical & Social Science (100.0%), Health Diagnosing & Treating (91.0%), and Health Technologists (89.4%).
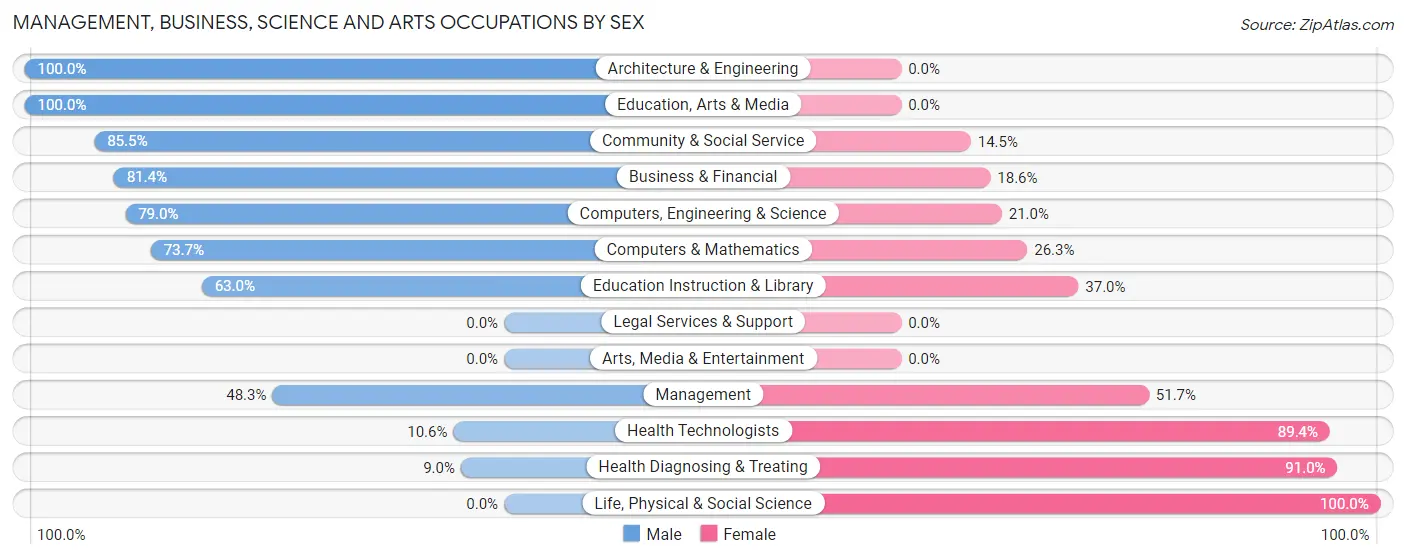
| Occupation | Male | Female |
| Management | 87 (48.3%) | 93 (51.7%) |
| Business & Financial | 70 (81.4%) | 16 (18.6%) |
| Computers, Engineering & Science | 64 (79.0%) | 17 (21.0%) |
| Computers & Mathematics | 28 (73.7%) | 10 (26.3%) |
| Architecture & Engineering | 36 (100.0%) | 0 (0.0%) |
| Life, Physical & Social Science | 0 (0.0%) | 7 (100.0%) |
| Community & Social Service | 100 (85.5%) | 17 (14.5%) |
| Education, Arts & Media | 71 (100.0%) | 0 (0.0%) |
| Legal Services & Support | 0 (0.0%) | 0 (0.0%) |
| Education Instruction & Library | 29 (63.0%) | 17 (37.0%) |
| Arts, Media & Entertainment | 0 (0.0%) | 0 (0.0%) |
| Health Diagnosing & Treating | 20 (9.0%) | 202 (91.0%) |
| Health Technologists | 20 (10.6%) | 169 (89.4%) |
| Total (Category) | 341 (49.7%) | 345 (50.3%) |
| Total (Overall) | 882 (53.7%) | 761 (46.3%) |
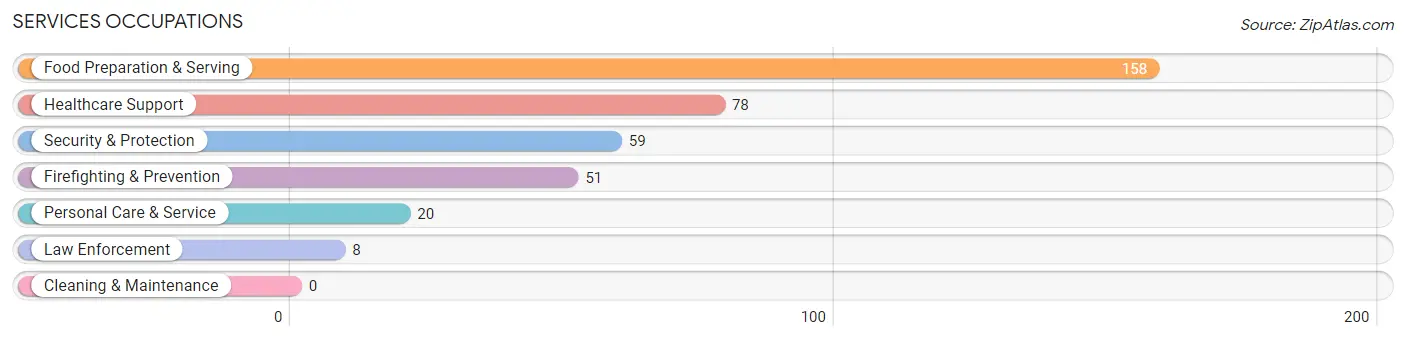
Services Occupations
The most common Services occupations in Longview Heights are Food Preparation & Serving (158 | 9.6%), Healthcare Support (78 | 4.8%), Security & Protection (59 | 3.6%), Firefighting & Prevention (51 | 3.1%), and Personal Care & Service (20 | 1.2%).
Services Occupations by Sex
Within the Services occupations in Longview Heights, the most male-oriented occupations are Law Enforcement (100.0%), Food Preparation & Serving (46.8%), and Healthcare Support (26.9%), while the most female-oriented occupations are Firefighting & Prevention (100.0%), Personal Care & Service (100.0%), and Security & Protection (86.4%).
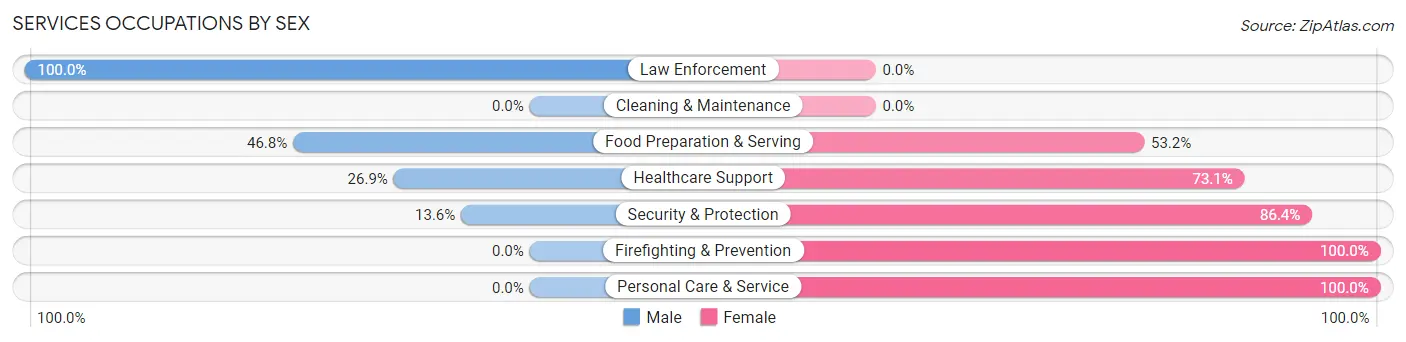
| Occupation | Male | Female |
| Healthcare Support | 21 (26.9%) | 57 (73.1%) |
| Security & Protection | 8 (13.6%) | 51 (86.4%) |
| Firefighting & Prevention | 0 (0.0%) | 51 (100.0%) |
| Law Enforcement | 8 (100.0%) | 0 (0.0%) |
| Food Preparation & Serving | 74 (46.8%) | 84 (53.2%) |
| Cleaning & Maintenance | 0 (0.0%) | 0 (0.0%) |
| Personal Care & Service | 0 (0.0%) | 20 (100.0%) |
| Total (Category) | 103 (32.7%) | 212 (67.3%) |
| Total (Overall) | 882 (53.7%) | 761 (46.3%) |
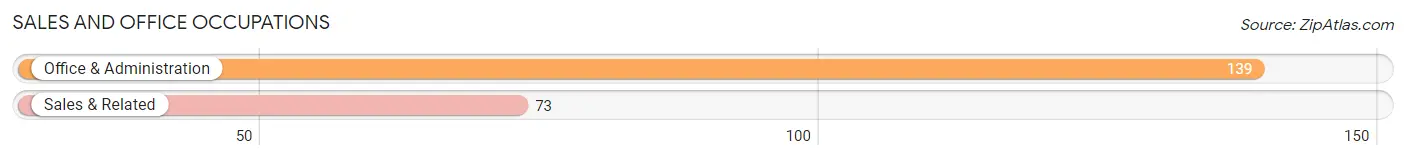
Sales and Office Occupations
The most common Sales and Office occupations in Longview Heights are Office & Administration (139 | 8.5%), and Sales & Related (73 | 4.4%).
Sales and Office Occupations by Sex
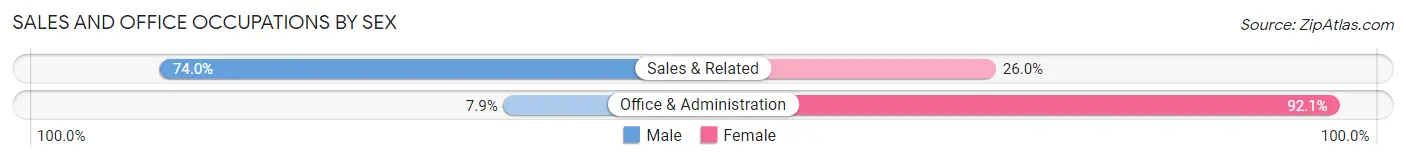
| Occupation | Male | Female |
| Sales & Related | 54 (74.0%) | 19 (26.0%) |
| Office & Administration | 11 (7.9%) | 128 (92.1%) |
| Total (Category) | 65 (30.7%) | 147 (69.3%) |
| Total (Overall) | 882 (53.7%) | 761 (46.3%) |
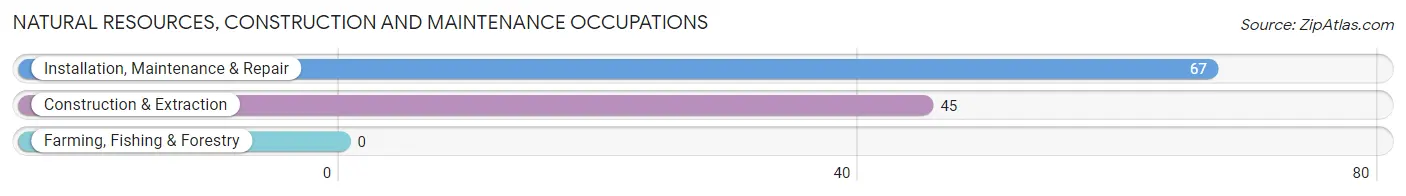
Natural Resources, Construction and Maintenance Occupations
The most common Natural Resources, Construction and Maintenance occupations in Longview Heights are Installation, Maintenance & Repair (67 | 4.1%), and Construction & Extraction (45 | 2.7%).
Natural Resources, Construction and Maintenance Occupations by Sex
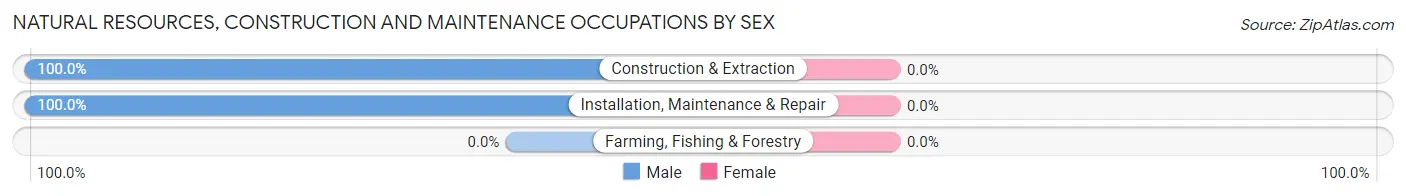
| Occupation | Male | Female |
| Farming, Fishing & Forestry | 0 (0.0%) | 0 (0.0%) |
| Construction & Extraction | 45 (100.0%) | 0 (0.0%) |
| Installation, Maintenance & Repair | 67 (100.0%) | 0 (0.0%) |
| Total (Category) | 112 (100.0%) | 0 (0.0%) |
| Total (Overall) | 882 (53.7%) | 761 (46.3%) |
Production, Transportation and Moving Occupations
The most common Production, Transportation and Moving occupations in Longview Heights are Transportation (173 | 10.5%), Production (130 | 7.9%), and Material Moving (15 | 0.9%).
Production, Transportation and Moving Occupations by Sex
| Occupation | Male | Female |
| Production | 100 (76.9%) | 30 (23.1%) |
| Transportation | 146 (84.4%) | 27 (15.6%) |
| Material Moving | 15 (100.0%) | 0 (0.0%) |
| Total (Category) | 261 (82.1%) | 57 (17.9%) |
| Total (Overall) | 882 (53.7%) | 761 (46.3%) |
Employment Industries by Sex in Longview Heights
Employment Industries in Longview Heights
The major employment industries in Longview Heights include Health Care & Social Assistance (339 | 20.6%), Manufacturing (241 | 14.7%), Transportation & Warehousing (163 | 9.9%), Retail Trade (135 | 8.2%), and Accommodation & Food Services (123 | 7.5%).
Employment Industries by Sex in Longview Heights
The Longview Heights industries that see more men than women are Mining, Quarrying, & Extraction (100.0%), Real Estate, Rental & Leasing (100.0%), and Professional & Scientific (100.0%), whereas the industries that tend to have a higher number of women are Utilities (100.0%), Administrative & Support (100.0%), and Arts, Entertainment & Recreation (100.0%).
| Industry | Male | Female |
| Agriculture, Fishing & Hunting | 0 (0.0%) | 0 (0.0%) |
| Mining, Quarrying, & Extraction | 56 (100.0%) | 0 (0.0%) |
| Construction | 63 (52.9%) | 56 (47.1%) |
| Manufacturing | 178 (73.9%) | 63 (26.1%) |
| Wholesale Trade | 0 (0.0%) | 0 (0.0%) |
| Retail Trade | 43 (31.9%) | 92 (68.1%) |
| Transportation & Warehousing | 146 (89.6%) | 17 (10.4%) |
| Utilities | 0 (0.0%) | 48 (100.0%) |
| Information | 0 (0.0%) | 0 (0.0%) |
| Finance & Insurance | 9 (36.0%) | 16 (64.0%) |
| Real Estate, Rental & Leasing | 15 (100.0%) | 0 (0.0%) |
| Professional & Scientific | 99 (100.0%) | 0 (0.0%) |
| Enterprise Management | 0 (0.0%) | 0 (0.0%) |
| Administrative & Support | 0 (0.0%) | 8 (100.0%) |
| Educational Services | 29 (39.7%) | 44 (60.3%) |
| Health Care & Social Assistance | 112 (33.0%) | 227 (67.0%) |
| Arts, Entertainment & Recreation | 0 (0.0%) | 15 (100.0%) |
| Accommodation & Food Services | 74 (60.2%) | 49 (39.8%) |
| Public Administration | 8 (8.6%) | 85 (91.4%) |
| Total | 882 (53.7%) | 761 (46.3%) |
Education in Longview Heights
School Enrollment in Longview Heights
The most common levels of schooling among the 886 students in Longview Heights are middle school (307 | 34.6%), high school (265 | 29.9%), and elementary school (196 | 22.1%).
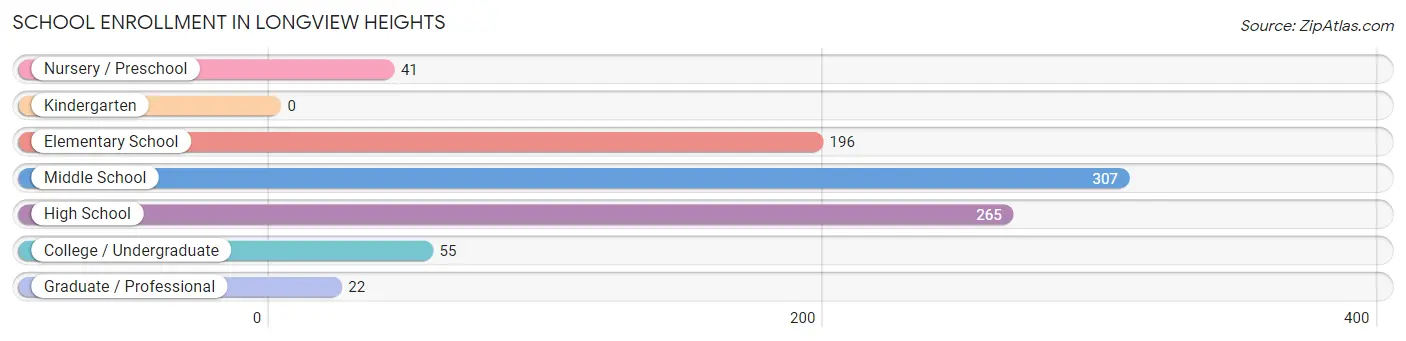
| School Level | # Students | % Students |
| Nursery / Preschool | 41 | 4.6% |
| Kindergarten | 0 | 0.0% |
| Elementary School | 196 | 22.1% |
| Middle School | 307 | 34.6% |
| High School | 265 | 29.9% |
| College / Undergraduate | 55 | 6.2% |
| Graduate / Professional | 22 | 2.5% |
| Total | 886 | 100.0% |
School Enrollment by Age by Funding Source in Longview Heights
Out of a total of 886 students who are enrolled in schools in Longview Heights, 186 (21.0%) attend a private institution, while the remaining 700 (79.0%) are enrolled in public schools. The age group of 3 to 4 year olds has the highest likelihood of being enrolled in private schools, with 21 (100.0% in the age bracket) enrolled. Conversely, the age group of 18 to 19 year olds has the lowest likelihood of being enrolled in a private school, with 21 (100.0% in the age bracket) attending a public institution.
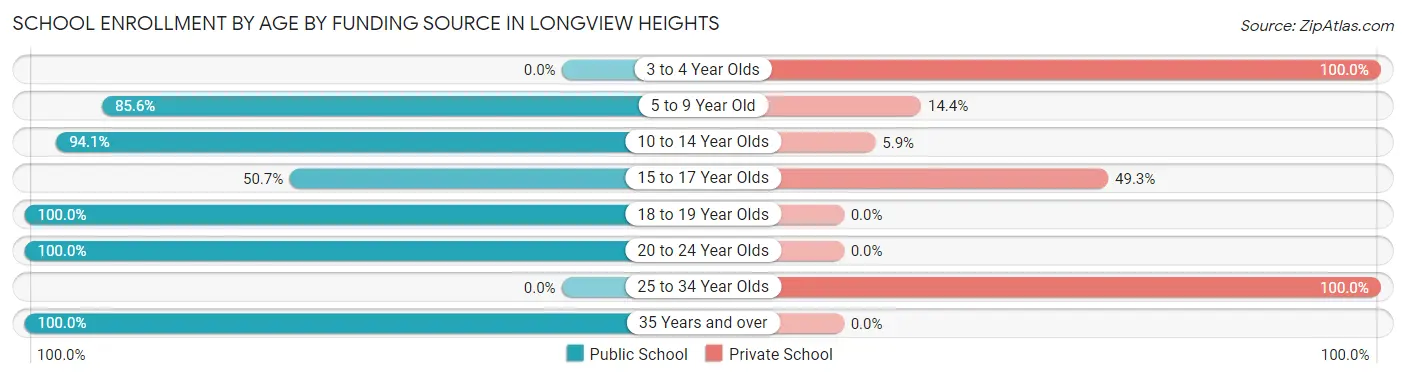
| Age Bracket | Public School | Private School |
| 3 to 4 Year Olds | 0 (0.0%) | 21 (100.0%) |
| 5 to 9 Year Old | 196 (85.6%) | 33 (14.4%) |
| 10 to 14 Year Olds | 335 (94.1%) | 21 (5.9%) |
| 15 to 17 Year Olds | 103 (50.7%) | 100 (49.3%) |
| 18 to 19 Year Olds | 21 (100.0%) | 0 (0.0%) |
| 20 to 24 Year Olds | 34 (100.0%) | 0 (0.0%) |
| 25 to 34 Year Olds | 0 (0.0%) | 11 (100.0%) |
| 35 Years and over | 11 (100.0%) | 0 (0.0%) |
| Total | 700 (79.0%) | 186 (21.0%) |
Educational Attainment by Field of Study in Longview Heights
Science & technology (132 | 17.5%), business (116 | 15.3%), psychology (81 | 10.7%), bio, nature & agricultural (76 | 10.1%), and physical & health sciences (76 | 10.1%) are the most common fields of study among 756 individuals in Longview Heights who have obtained a bachelor's degree or higher.
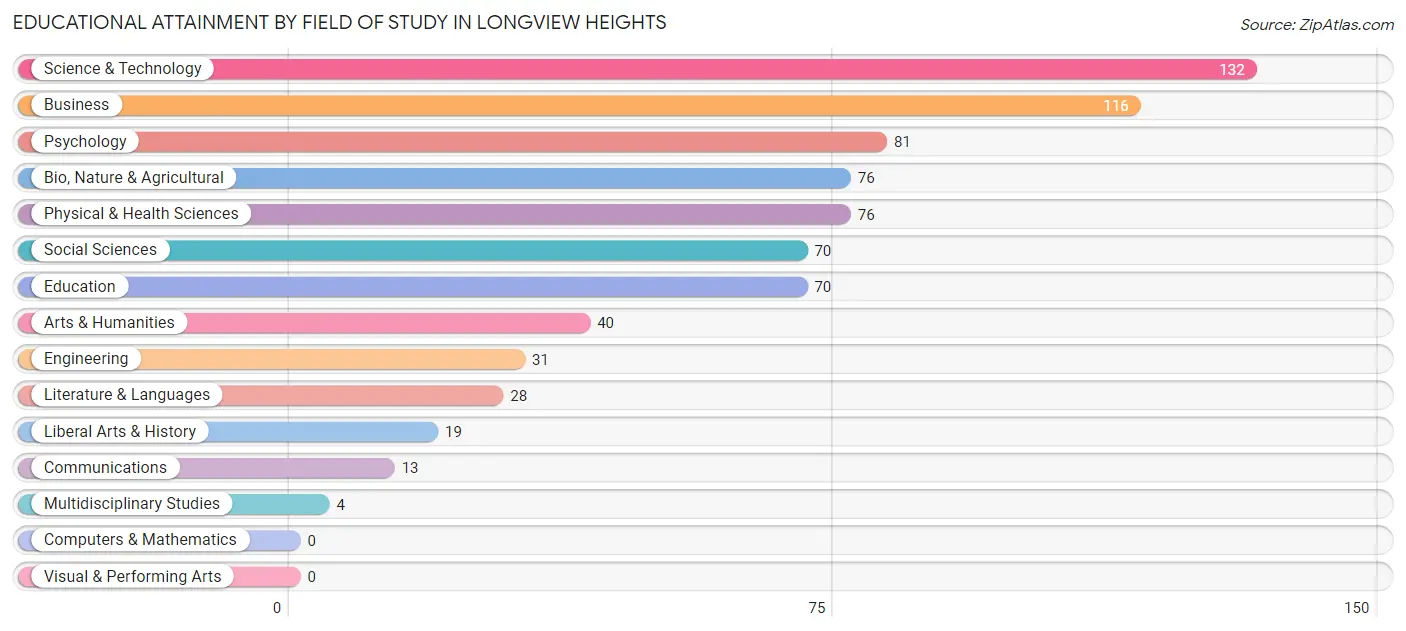
| Field of Study | # Graduates | % Graduates |
| Computers & Mathematics | 0 | 0.0% |
| Bio, Nature & Agricultural | 76 | 10.1% |
| Physical & Health Sciences | 76 | 10.1% |
| Psychology | 81 | 10.7% |
| Social Sciences | 70 | 9.3% |
| Engineering | 31 | 4.1% |
| Multidisciplinary Studies | 4 | 0.5% |
| Science & Technology | 132 | 17.5% |
| Business | 116 | 15.3% |
| Education | 70 | 9.3% |
| Literature & Languages | 28 | 3.7% |
| Liberal Arts & History | 19 | 2.5% |
| Visual & Performing Arts | 0 | 0.0% |
| Communications | 13 | 1.7% |
| Arts & Humanities | 40 | 5.3% |
| Total | 756 | 100.0% |
Transportation & Commute in Longview Heights
Vehicle Availability by Sex in Longview Heights
The most prevalent vehicle ownership categories in Longview Heights are males with 2 vehicles (329, accounting for 40.1%) and females with 2 vehicles (165, making up 46.6%).
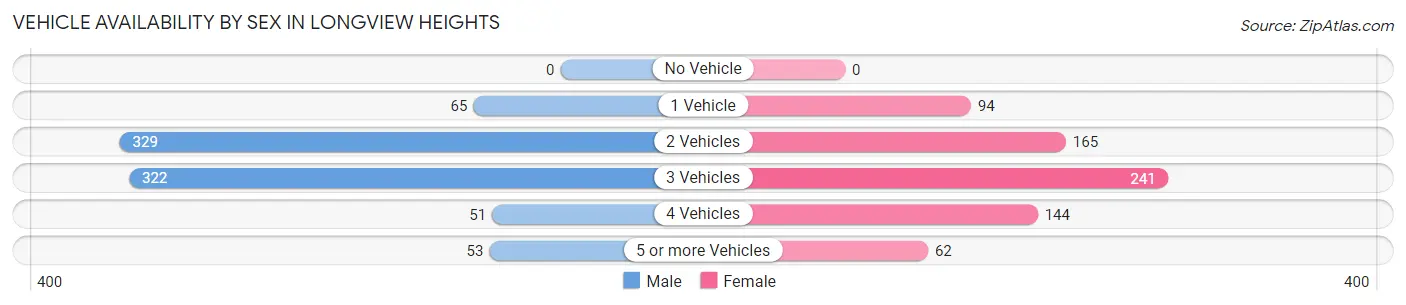
| Vehicles Available | Male | Female |
| No Vehicle | 0 (0.0%) | 0 (0.0%) |
| 1 Vehicle | 65 (7.9%) | 94 (13.3%) |
| 2 Vehicles | 329 (40.1%) | 165 (23.4%) |
| 3 Vehicles | 322 (39.3%) | 241 (34.1%) |
| 4 Vehicles | 51 (6.2%) | 144 (20.4%) |
| 5 or more Vehicles | 53 (6.5%) | 62 (8.8%) |
| Total | 820 (100.0%) | 706 (100.0%) |
Commute Time in Longview Heights
The most frequently occuring commute durations in Longview Heights are 15 to 19 minutes (378 commuters, 29.3%), 10 to 14 minutes (322 commuters, 25.0%), and 20 to 24 minutes (156 commuters, 12.1%).
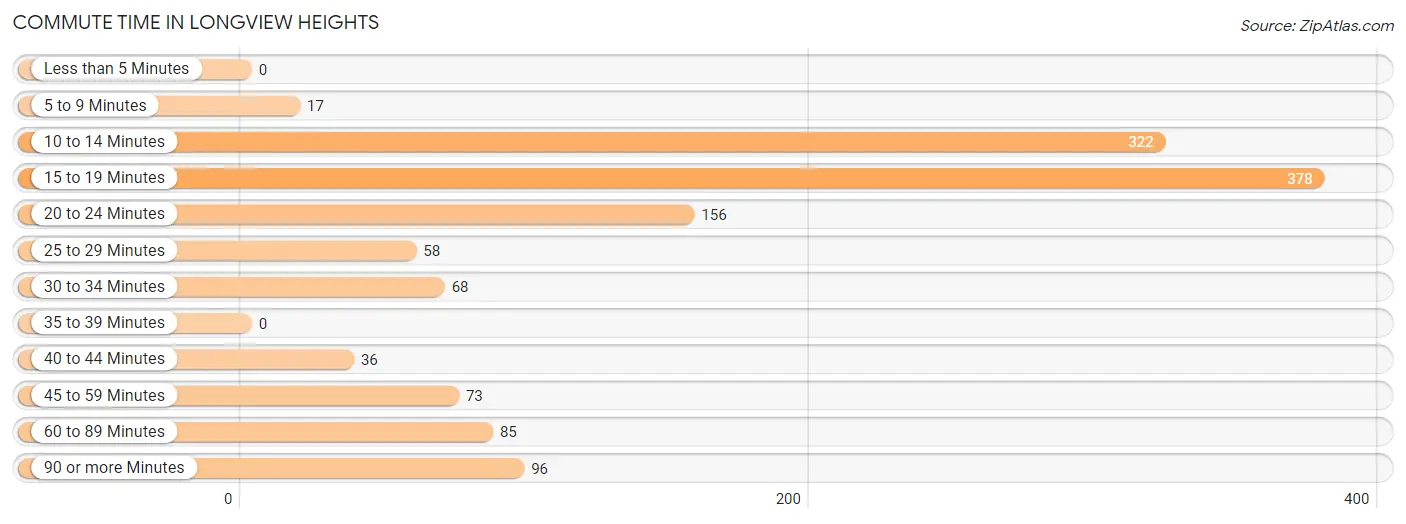
| Commute Time | # Commuters | % Commuters |
| Less than 5 Minutes | 0 | 0.0% |
| 5 to 9 Minutes | 17 | 1.3% |
| 10 to 14 Minutes | 322 | 25.0% |
| 15 to 19 Minutes | 378 | 29.3% |
| 20 to 24 Minutes | 156 | 12.1% |
| 25 to 29 Minutes | 58 | 4.5% |
| 30 to 34 Minutes | 68 | 5.3% |
| 35 to 39 Minutes | 0 | 0.0% |
| 40 to 44 Minutes | 36 | 2.8% |
| 45 to 59 Minutes | 73 | 5.7% |
| 60 to 89 Minutes | 85 | 6.6% |
| 90 or more Minutes | 96 | 7.4% |
Commute Time by Sex in Longview Heights
The most common commute times in Longview Heights are 15 to 19 minutes (166 commuters, 23.8%) for males and 15 to 19 minutes (212 commuters, 35.9%) for females.
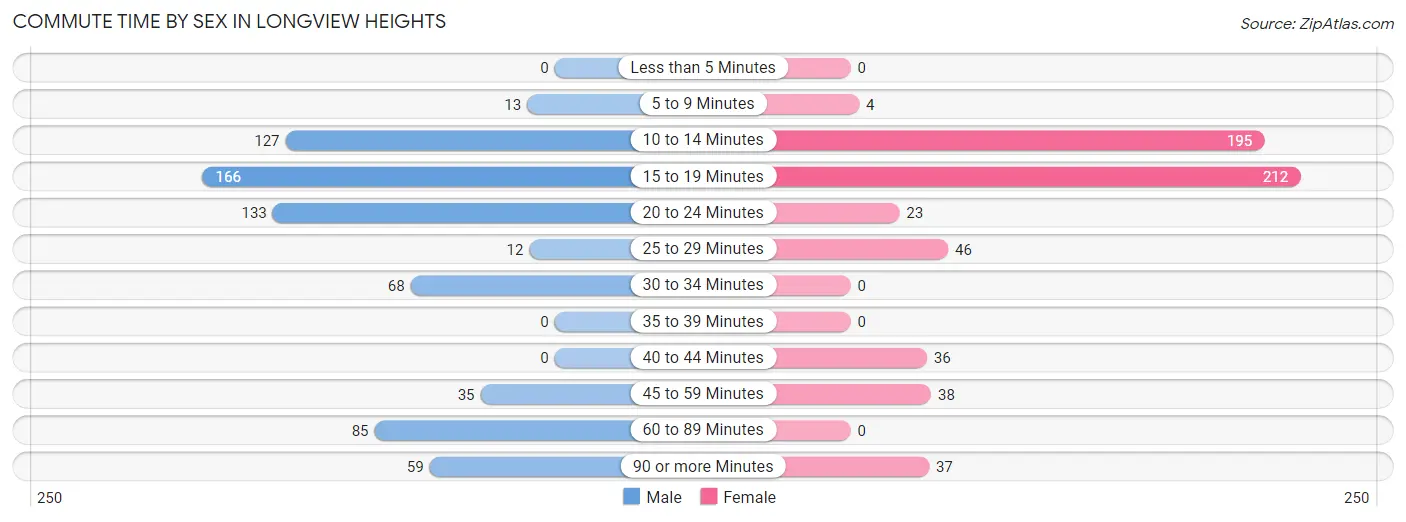
| Commute Time | Male | Female |
| Less than 5 Minutes | 0 (0.0%) | 0 (0.0%) |
| 5 to 9 Minutes | 13 (1.9%) | 4 (0.7%) |
| 10 to 14 Minutes | 127 (18.2%) | 195 (33.0%) |
| 15 to 19 Minutes | 166 (23.8%) | 212 (35.9%) |
| 20 to 24 Minutes | 133 (19.1%) | 23 (3.9%) |
| 25 to 29 Minutes | 12 (1.7%) | 46 (7.8%) |
| 30 to 34 Minutes | 68 (9.7%) | 0 (0.0%) |
| 35 to 39 Minutes | 0 (0.0%) | 0 (0.0%) |
| 40 to 44 Minutes | 0 (0.0%) | 36 (6.1%) |
| 45 to 59 Minutes | 35 (5.0%) | 38 (6.4%) |
| 60 to 89 Minutes | 85 (12.2%) | 0 (0.0%) |
| 90 or more Minutes | 59 (8.5%) | 37 (6.3%) |
Time of Departure to Work by Sex in Longview Heights
The most frequent times of departure to work in Longview Heights are 5:30 AM to 5:59 AM (186, 26.7%) for males and 7:00 AM to 7:29 AM (154, 26.1%) for females.
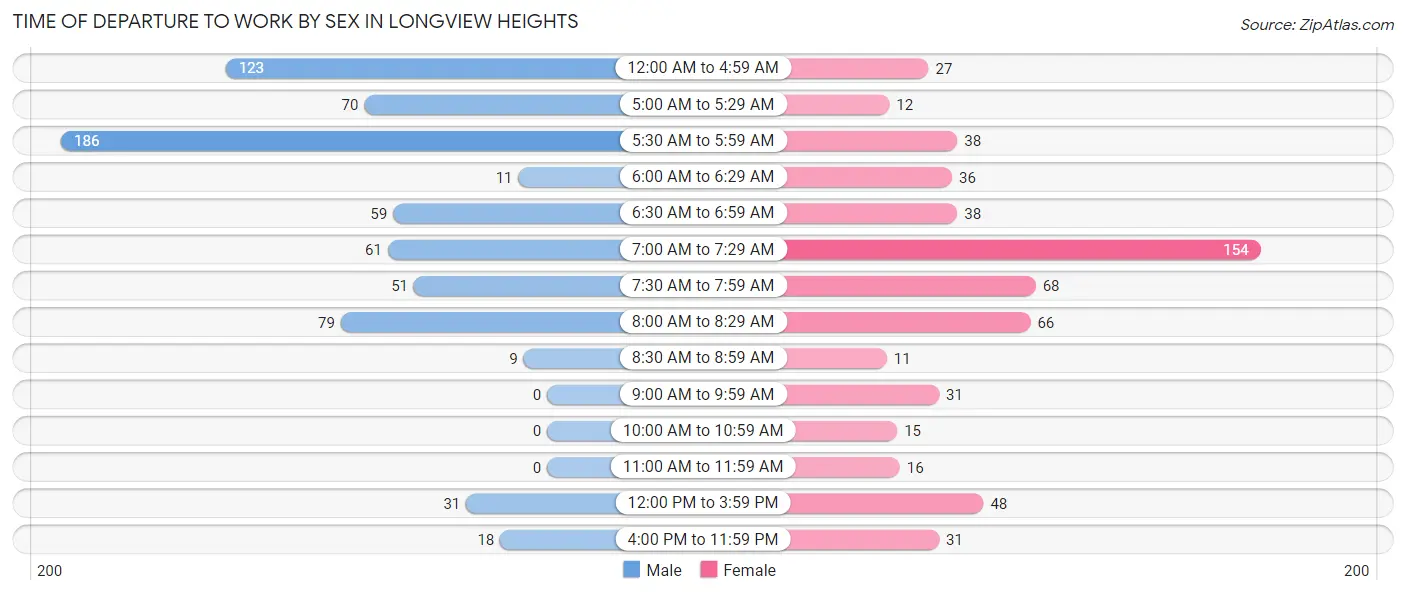
| Time of Departure | Male | Female |
| 12:00 AM to 4:59 AM | 123 (17.6%) | 27 (4.6%) |
| 5:00 AM to 5:29 AM | 70 (10.0%) | 12 (2.0%) |
| 5:30 AM to 5:59 AM | 186 (26.7%) | 38 (6.4%) |
| 6:00 AM to 6:29 AM | 11 (1.6%) | 36 (6.1%) |
| 6:30 AM to 6:59 AM | 59 (8.5%) | 38 (6.4%) |
| 7:00 AM to 7:29 AM | 61 (8.7%) | 154 (26.1%) |
| 7:30 AM to 7:59 AM | 51 (7.3%) | 68 (11.5%) |
| 8:00 AM to 8:29 AM | 79 (11.3%) | 66 (11.2%) |
| 8:30 AM to 8:59 AM | 9 (1.3%) | 11 (1.9%) |
| 9:00 AM to 9:59 AM | 0 (0.0%) | 31 (5.2%) |
| 10:00 AM to 10:59 AM | 0 (0.0%) | 15 (2.5%) |
| 11:00 AM to 11:59 AM | 0 (0.0%) | 16 (2.7%) |
| 12:00 PM to 3:59 PM | 31 (4.4%) | 48 (8.1%) |
| 4:00 PM to 11:59 PM | 18 (2.6%) | 31 (5.2%) |
| Total | 698 (100.0%) | 591 (100.0%) |
Housing Occupancy in Longview Heights
Occupancy by Ownership in Longview Heights
Of the total 1,562 dwellings in Longview Heights, owner-occupied units account for 1,297 (83.0%), while renter-occupied units make up 265 (17.0%).
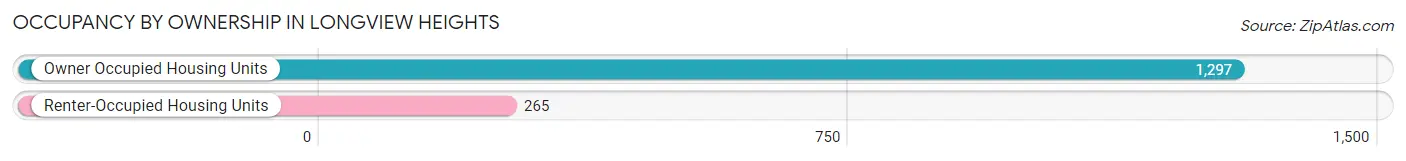
| Occupancy | # Housing Units | % Housing Units |
| Owner Occupied Housing Units | 1,297 | 83.0% |
| Renter-Occupied Housing Units | 265 | 17.0% |
| Total Occupied Housing Units | 1,562 | 100.0% |
Occupancy by Household Size in Longview Heights
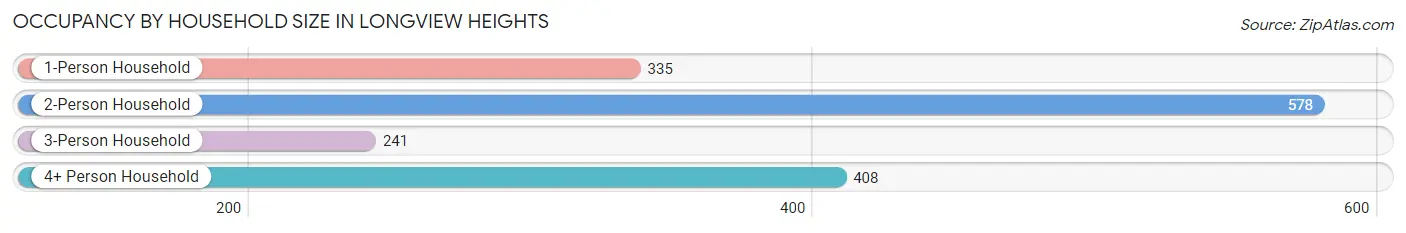
| Household Size | # Housing Units | % Housing Units |
| 1-Person Household | 335 | 21.4% |
| 2-Person Household | 578 | 37.0% |
| 3-Person Household | 241 | 15.4% |
| 4+ Person Household | 408 | 26.1% |
| Total Housing Units | 1,562 | 100.0% |
Occupancy by Ownership by Household Size in Longview Heights
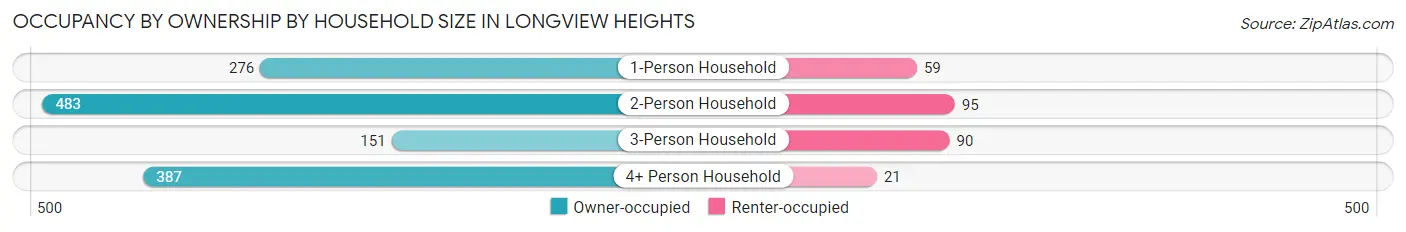
| Household Size | Owner-occupied | Renter-occupied |
| 1-Person Household | 276 (82.4%) | 59 (17.6%) |
| 2-Person Household | 483 (83.6%) | 95 (16.4%) |
| 3-Person Household | 151 (62.7%) | 90 (37.3%) |
| 4+ Person Household | 387 (94.9%) | 21 (5.1%) |
| Total Housing Units | 1,297 (83.0%) | 265 (17.0%) |
Occupancy by Educational Attainment in Longview Heights
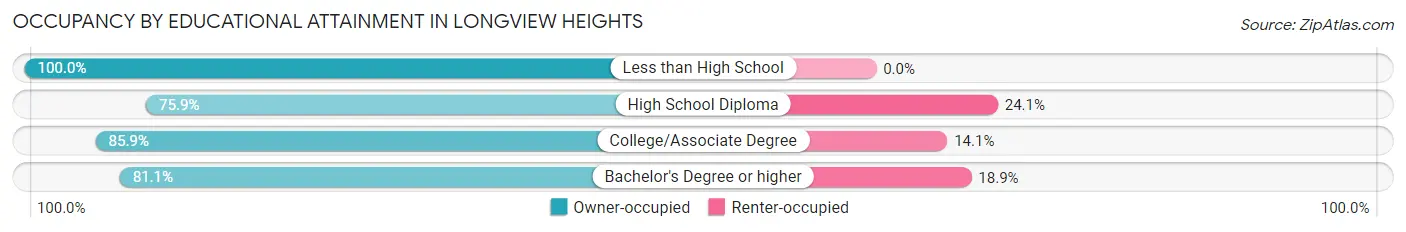
| Household Size | Owner-occupied | Renter-occupied |
| Less than High School | 48 (100.0%) | 0 (0.0%) |
| High School Diploma | 255 (75.9%) | 81 (24.1%) |
| College/Associate Degree | 689 (85.9%) | 113 (14.1%) |
| Bachelor's Degree or higher | 305 (81.1%) | 71 (18.9%) |
Occupancy by Age of Householder in Longview Heights
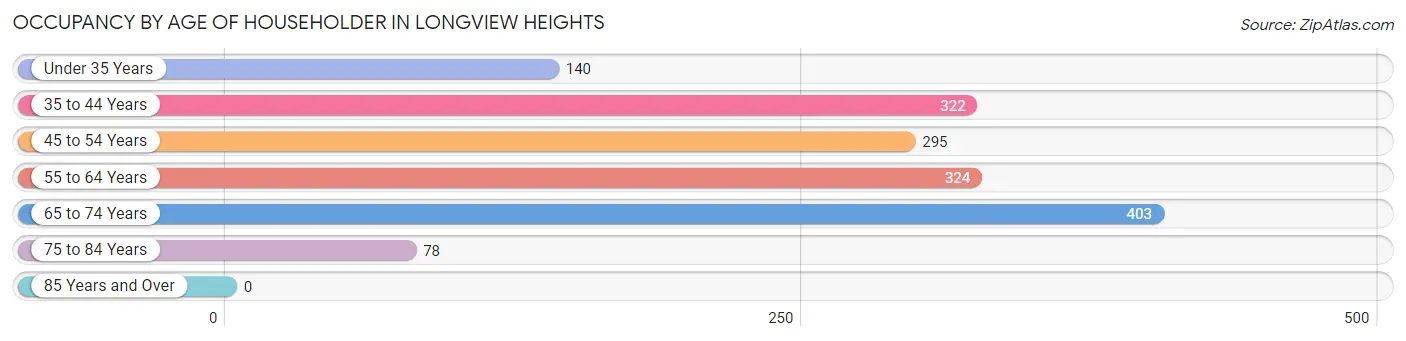
| Age Bracket | # Households | % Households |
| Under 35 Years | 140 | 9.0% |
| 35 to 44 Years | 322 | 20.6% |
| 45 to 54 Years | 295 | 18.9% |
| 55 to 64 Years | 324 | 20.7% |
| 65 to 74 Years | 403 | 25.8% |
| 75 to 84 Years | 78 | 5.0% |
| 85 Years and Over | 0 | 0.0% |
| Total | 1,562 | 100.0% |
Housing Finances in Longview Heights
Median Income by Occupancy in Longview Heights
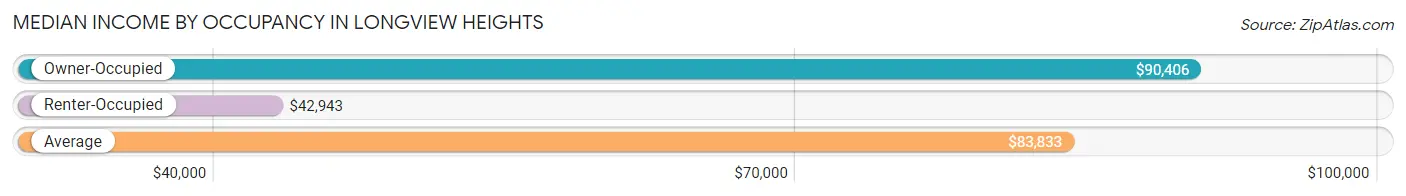
| Occupancy Type | # Households | Median Income |
| Owner-Occupied | 1,297 (83.0%) | $90,406 |
| Renter-Occupied | 265 (17.0%) | $42,943 |
| Average | 1,562 (100.0%) | $83,833 |
Occupancy by Householder Income Bracket in Longview Heights
| Income Bracket | Owner-occupied | Renter-occupied |
| Less than $5,000 | 40 (3.1%) | 19 (7.2%) |
| $5,000 to $9,999 | 0 (0.0%) | 31 (11.7%) |
| $10,000 to $14,999 | 22 (1.7%) | 44 (16.6%) |
| $15,000 to $19,999 | 40 (3.1%) | 0 (0.0%) |
| $20,000 to $24,999 | 63 (4.9%) | 19 (7.2%) |
| $25,000 to $34,999 | 55 (4.2%) | 0 (0.0%) |
| $35,000 to $49,999 | 123 (9.5%) | 59 (22.3%) |
| $50,000 to $74,999 | 215 (16.6%) | 0 (0.0%) |
| $75,000 to $99,999 | 162 (12.5%) | 9 (3.4%) |
| $100,000 to $149,999 | 242 (18.7%) | 32 (12.1%) |
| $150,000 or more | 335 (25.8%) | 52 (19.6%) |
| Total | 1,297 (100.0%) | 265 (100.0%) |
Monthly Housing Cost Tiers in Longview Heights
| Monthly Cost | Owner-occupied | Renter-occupied |
| Less than $300 | 13 (1.0%) | 0 (0.0%) |
| $300 to $499 | 92 (7.1%) | 0 (0.0%) |
| $500 to $799 | 238 (18.3%) | 0 (0.0%) |
| $800 to $999 | 111 (8.6%) | 71 (26.8%) |
| $1,000 to $1,499 | 114 (8.8%) | 112 (42.3%) |
| $1,500 to $1,999 | 199 (15.3%) | 63 (23.8%) |
| $2,000 to $2,499 | 289 (22.3%) | 0 (0.0%) |
| $2,500 to $2,999 | 160 (12.3%) | 0 (0.0%) |
| $3,000 or more | 81 (6.2%) | 0 (0.0%) |
| Total | 1,297 (100.0%) | 265 (100.0%) |
Physical Housing Characteristics in Longview Heights
Housing Structures in Longview Heights
| Structure Type | # Housing Units | % Housing Units |
| Single Unit, Detached | 1,238 | 79.3% |
| Single Unit, Attached | 52 | 3.3% |
| 2 Unit Apartments | 48 | 3.1% |
| 3 or 4 Unit Apartments | 0 | 0.0% |
| 5 to 9 Unit Apartments | 21 | 1.3% |
| 10 or more Apartments | 110 | 7.0% |
| Mobile Home / Other | 93 | 5.9% |
| Total | 1,562 | 100.0% |
Housing Structures by Occupancy in Longview Heights
| Structure Type | Owner-occupied | Renter-occupied |
| Single Unit, Detached | 1,215 (98.1%) | 23 (1.9%) |
| Single Unit, Attached | 0 (0.0%) | 52 (100.0%) |
| 2 Unit Apartments | 0 (0.0%) | 48 (100.0%) |
| 3 or 4 Unit Apartments | 0 (0.0%) | 0 (0.0%) |
| 5 to 9 Unit Apartments | 0 (0.0%) | 21 (100.0%) |
| 10 or more Apartments | 0 (0.0%) | 110 (100.0%) |
| Mobile Home / Other | 82 (88.2%) | 11 (11.8%) |
| Total | 1,297 (83.0%) | 265 (17.0%) |
Housing Structures by Number of Rooms in Longview Heights
| Number of Rooms | Owner-occupied | Renter-occupied |
| 1 Room | 0 (0.0%) | 0 (0.0%) |
| 2 or 3 Rooms | 0 (0.0%) | 9 (3.4%) |
| 4 or 5 Rooms | 126 (9.7%) | 215 (81.1%) |
| 6 or 7 Rooms | 431 (33.2%) | 11 (4.2%) |
| 8 or more Rooms | 740 (57.1%) | 30 (11.3%) |
| Total | 1,297 (100.0%) | 265 (100.0%) |
Housing Structure by Heating Type in Longview Heights
| Heating Type | Owner-occupied | Renter-occupied |
| Utility Gas | 120 (9.2%) | 0 (0.0%) |
| Bottled, Tank, or LP Gas | 0 (0.0%) | 0 (0.0%) |
| Electricity | 1,102 (85.0%) | 265 (100.0%) |
| Fuel Oil or Kerosene | 0 (0.0%) | 0 (0.0%) |
| Coal or Coke | 0 (0.0%) | 0 (0.0%) |
| All other Fuels | 75 (5.8%) | 0 (0.0%) |
| No Fuel Used | 0 (0.0%) | 0 (0.0%) |
| Total | 1,297 (100.0%) | 265 (100.0%) |
Household Vehicle Usage in Longview Heights
| Vehicles per Household | Owner-occupied | Renter-occupied |
| No Vehicle | 0 (0.0%) | 0 (0.0%) |
| 1 Vehicle | 289 (22.3%) | 141 (53.2%) |
| 2 Vehicles | 469 (36.2%) | 61 (23.0%) |
| 3 or more Vehicles | 539 (41.6%) | 63 (23.8%) |
| Total | 1,297 (100.0%) | 265 (100.0%) |
Real Estate & Mortgages in Longview Heights
Real Estate and Mortgage Overview in Longview Heights
| Characteristic | Without Mortgage | With Mortgage |
| Housing Units | 426 | 871 |
| Median Property Value | $260,200 | $420,000 |
| Median Household Income | $55,391 | $278 |
| Monthly Housing Costs | $620 | $81 |
| Real Estate Taxes | $3,107 | $0 |
Property Value by Mortgage Status in Longview Heights
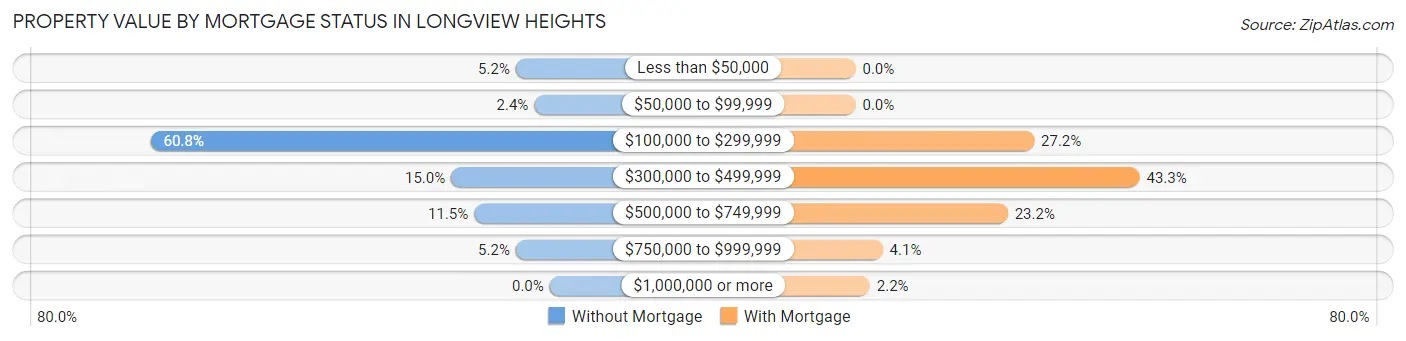
| Property Value | Without Mortgage | With Mortgage |
| Less than $50,000 | 22 (5.2%) | 0 (0.0%) |
| $50,000 to $99,999 | 10 (2.4%) | 0 (0.0%) |
| $100,000 to $299,999 | 259 (60.8%) | 237 (27.2%) |
| $300,000 to $499,999 | 64 (15.0%) | 377 (43.3%) |
| $500,000 to $749,999 | 49 (11.5%) | 202 (23.2%) |
| $750,000 to $999,999 | 22 (5.2%) | 36 (4.1%) |
| $1,000,000 or more | 0 (0.0%) | 19 (2.2%) |
| Total | 426 (100.0%) | 871 (100.0%) |
Household Income by Mortgage Status in Longview Heights
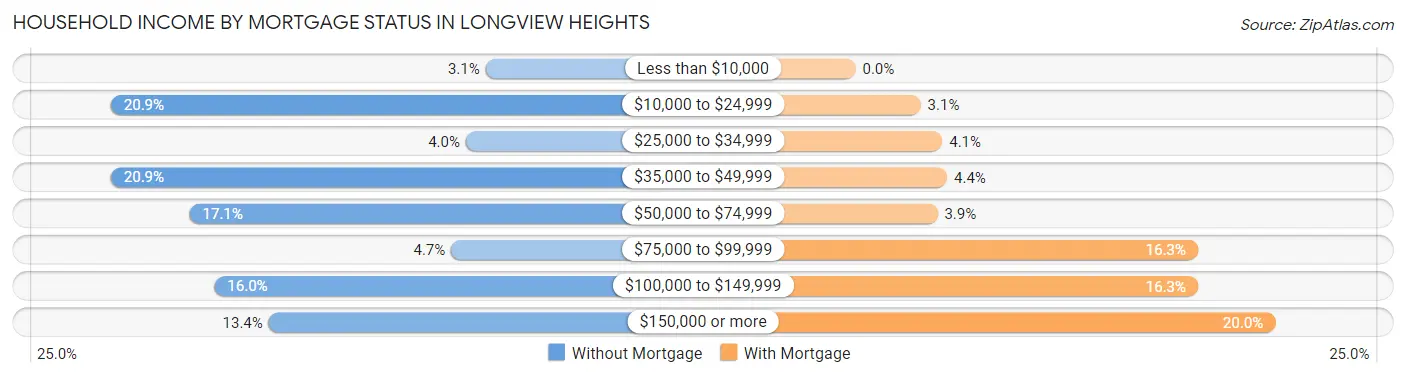
| Household Income | Without Mortgage | With Mortgage |
| Less than $10,000 | 13 (3.0%) | 0 (0.0%) |
| $10,000 to $24,999 | 89 (20.9%) | 27 (3.1%) |
| $25,000 to $34,999 | 17 (4.0%) | 36 (4.1%) |
| $35,000 to $49,999 | 89 (20.9%) | 38 (4.4%) |
| $50,000 to $74,999 | 73 (17.1%) | 34 (3.9%) |
| $75,000 to $99,999 | 20 (4.7%) | 142 (16.3%) |
| $100,000 to $149,999 | 68 (16.0%) | 142 (16.3%) |
| $150,000 or more | 57 (13.4%) | 174 (20.0%) |
| Total | 426 (100.0%) | 871 (100.0%) |
Property Value to Household Income Ratio in Longview Heights
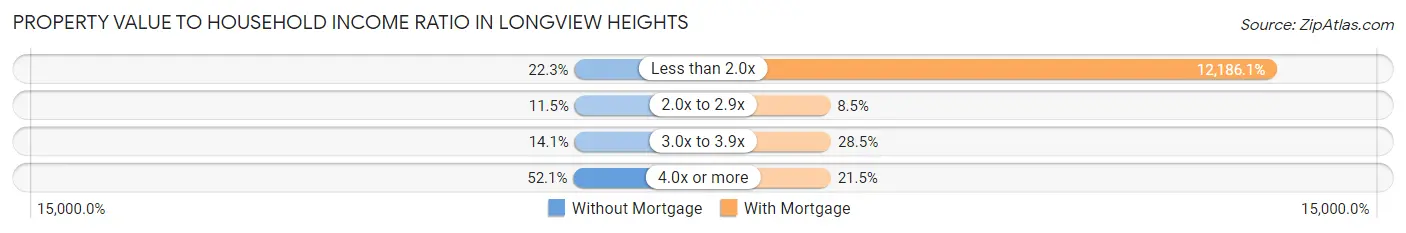
| Value-to-Income Ratio | Without Mortgage | With Mortgage |
| Less than 2.0x | 95 (22.3%) | 106,141 (12,186.1%) |
| 2.0x to 2.9x | 49 (11.5%) | 74 (8.5%) |
| 3.0x to 3.9x | 60 (14.1%) | 248 (28.5%) |
| 4.0x or more | 222 (52.1%) | 187 (21.5%) |
| Total | 426 (100.0%) | 871 (100.0%) |
Real Estate Taxes by Mortgage Status in Longview Heights
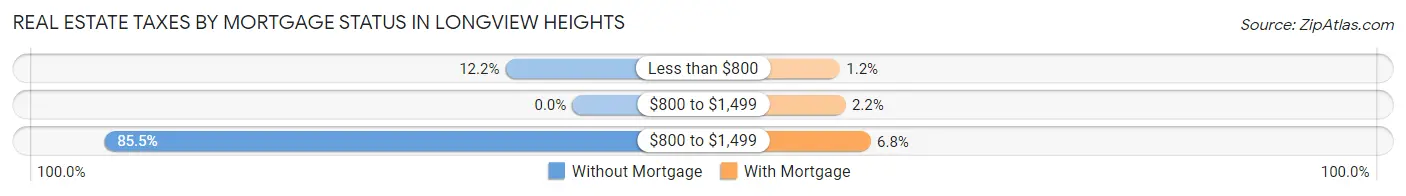
| Property Taxes | Without Mortgage | With Mortgage |
| Less than $800 | 52 (12.2%) | 10 (1.1%) |
| $800 to $1,499 | 0 (0.0%) | 19 (2.2%) |
| $800 to $1,499 | 364 (85.5%) | 59 (6.8%) |
| Total | 426 (100.0%) | 871 (100.0%) |
Health & Disability in Longview Heights
Health Insurance Coverage by Age in Longview Heights
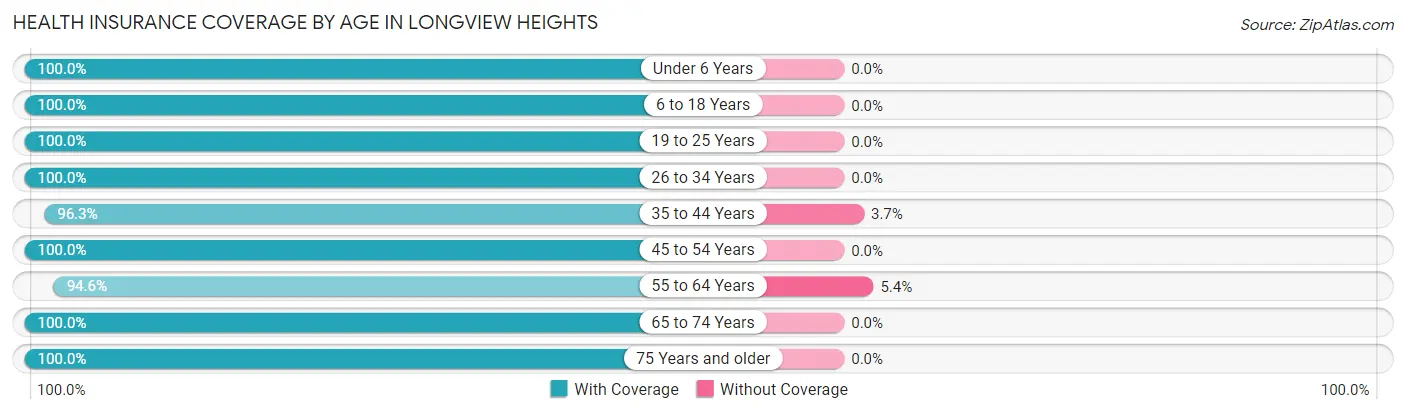
| Age Bracket | With Coverage | Without Coverage |
| Under 6 Years | 185 (100.0%) | 0 (0.0%) |
| 6 to 18 Years | 869 (100.0%) | 0 (0.0%) |
| 19 to 25 Years | 516 (100.0%) | 0 (0.0%) |
| 26 to 34 Years | 250 (100.0%) | 0 (0.0%) |
| 35 to 44 Years | 498 (96.3%) | 19 (3.7%) |
| 45 to 54 Years | 596 (100.0%) | 0 (0.0%) |
| 55 to 64 Years | 556 (94.6%) | 32 (5.4%) |
| 65 to 74 Years | 550 (100.0%) | 0 (0.0%) |
| 75 Years and older | 128 (100.0%) | 0 (0.0%) |
| Total | 4,148 (98.8%) | 51 (1.2%) |
Health Insurance Coverage by Citizenship Status in Longview Heights
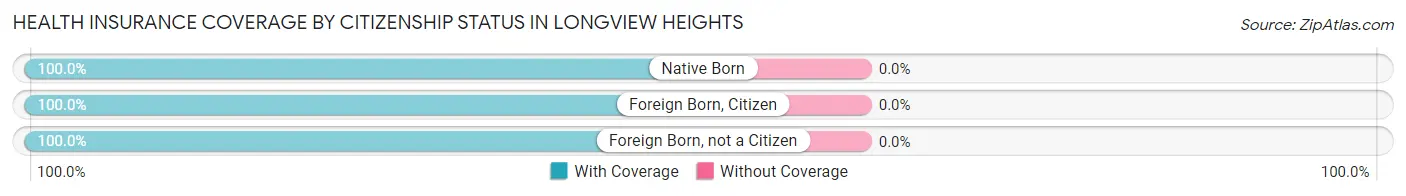
| Citizenship Status | With Coverage | Without Coverage |
| Native Born | 185 (100.0%) | 0 (0.0%) |
| Foreign Born, Citizen | 869 (100.0%) | 0 (0.0%) |
| Foreign Born, not a Citizen | 516 (100.0%) | 0 (0.0%) |
Health Insurance Coverage by Household Income in Longview Heights
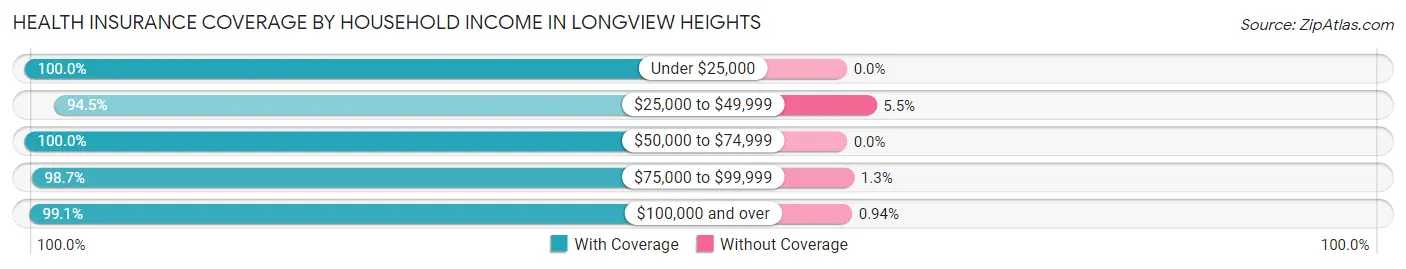
| Household Income | With Coverage | Without Coverage |
| Under $25,000 | 609 (100.0%) | 0 (0.0%) |
| $25,000 to $49,999 | 393 (94.5%) | 23 (5.5%) |
| $50,000 to $74,999 | 470 (100.0%) | 0 (0.0%) |
| $75,000 to $99,999 | 667 (98.7%) | 9 (1.3%) |
| $100,000 and over | 2,009 (99.1%) | 19 (0.9%) |
Public vs Private Health Insurance Coverage by Age in Longview Heights
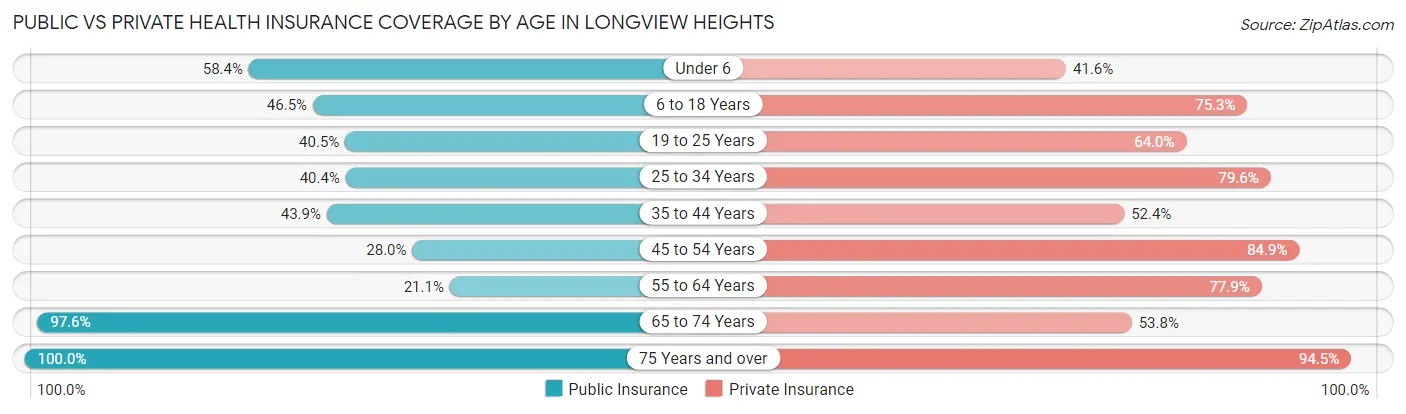
| Age Bracket | Public Insurance | Private Insurance |
| Under 6 | 108 (58.4%) | 77 (41.6%) |
| 6 to 18 Years | 404 (46.5%) | 654 (75.3%) |
| 19 to 25 Years | 209 (40.5%) | 330 (63.9%) |
| 25 to 34 Years | 101 (40.4%) | 199 (79.6%) |
| 35 to 44 Years | 227 (43.9%) | 271 (52.4%) |
| 45 to 54 Years | 167 (28.0%) | 506 (84.9%) |
| 55 to 64 Years | 124 (21.1%) | 458 (77.9%) |
| 65 to 74 Years | 537 (97.6%) | 296 (53.8%) |
| 75 Years and over | 128 (100.0%) | 121 (94.5%) |
| Total | 2,005 (47.7%) | 2,912 (69.4%) |
Disability Status by Sex by Age in Longview Heights
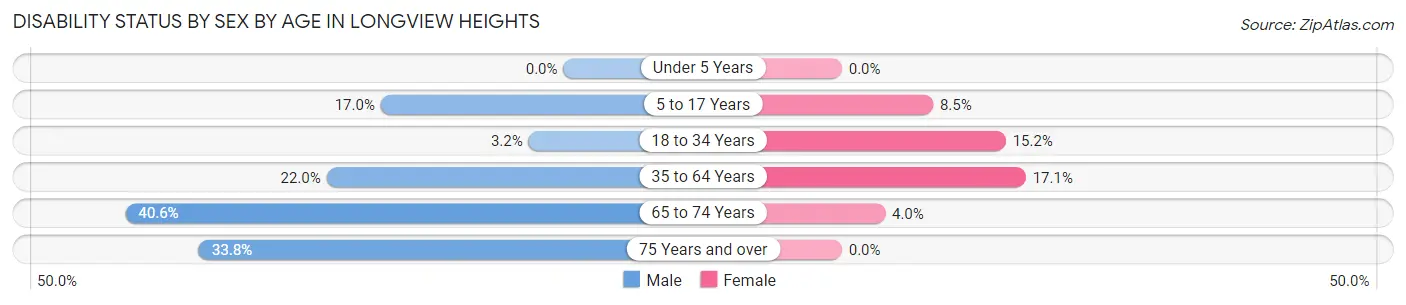
| Age Bracket | Male | Female |
| Under 5 Years | 0 (0.0%) | 0 (0.0%) |
| 5 to 17 Years | 80 (17.0%) | 33 (8.5%) |
| 18 to 34 Years | 16 (3.2%) | 47 (15.2%) |
| 35 to 64 Years | 191 (22.0%) | 142 (17.1%) |
| 65 to 74 Years | 102 (40.6%) | 12 (4.0%) |
| 75 Years and over | 23 (33.8%) | 0 (0.0%) |
Disability Class by Sex by Age in Longview Heights
Disability Class: Hearing Difficulty
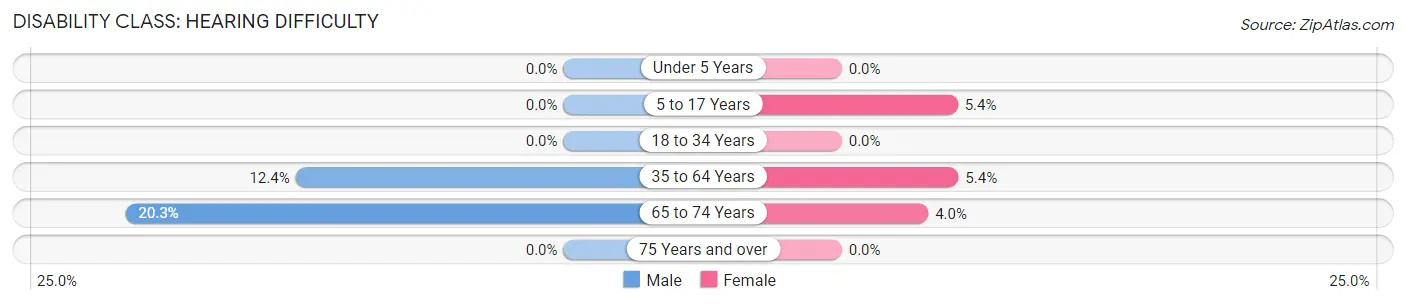
| Age Bracket | Male | Female |
| Under 5 Years | 0 (0.0%) | 0 (0.0%) |
| 5 to 17 Years | 0 (0.0%) | 21 (5.4%) |
| 18 to 34 Years | 0 (0.0%) | 0 (0.0%) |
| 35 to 64 Years | 108 (12.4%) | 45 (5.4%) |
| 65 to 74 Years | 51 (20.3%) | 12 (4.0%) |
| 75 Years and over | 0 (0.0%) | 0 (0.0%) |
Disability Class: Vision Difficulty
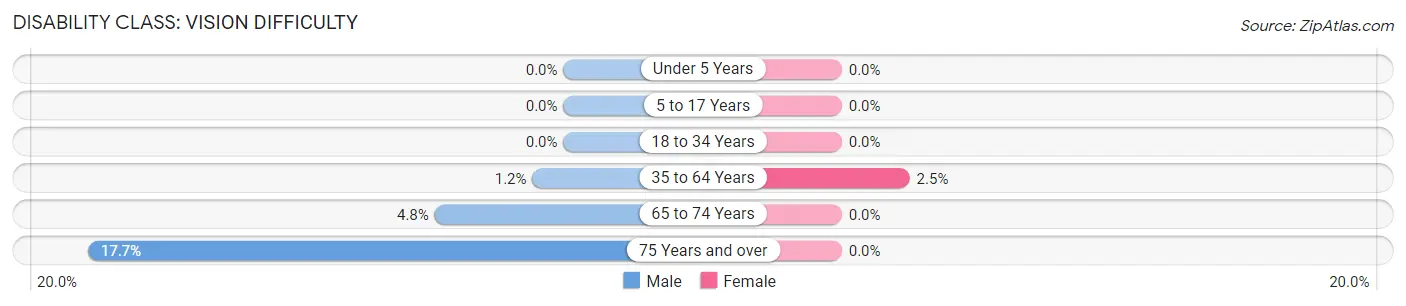
| Age Bracket | Male | Female |
| Under 5 Years | 0 (0.0%) | 0 (0.0%) |
| 5 to 17 Years | 0 (0.0%) | 0 (0.0%) |
| 18 to 34 Years | 0 (0.0%) | 0 (0.0%) |
| 35 to 64 Years | 10 (1.1%) | 21 (2.5%) |
| 65 to 74 Years | 12 (4.8%) | 0 (0.0%) |
| 75 Years and over | 12 (17.6%) | 0 (0.0%) |
Disability Class: Cognitive Difficulty
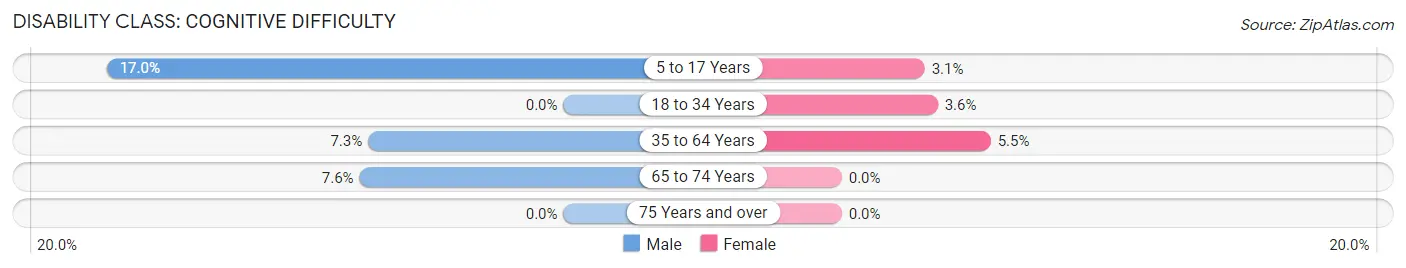
| Age Bracket | Male | Female |
| 5 to 17 Years | 80 (17.0%) | 12 (3.1%) |
| 18 to 34 Years | 0 (0.0%) | 11 (3.6%) |
| 35 to 64 Years | 63 (7.2%) | 46 (5.5%) |
| 65 to 74 Years | 19 (7.6%) | 0 (0.0%) |
| 75 Years and over | 0 (0.0%) | 0 (0.0%) |
Disability Class: Ambulatory Difficulty
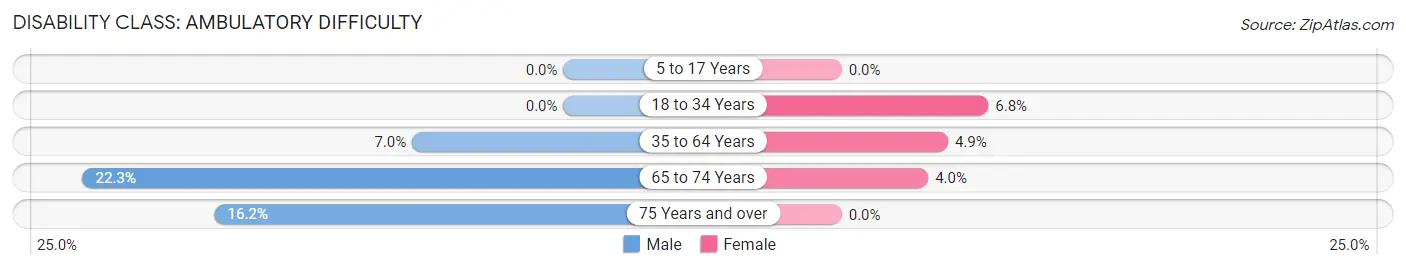
| Age Bracket | Male | Female |
| 5 to 17 Years | 0 (0.0%) | 0 (0.0%) |
| 18 to 34 Years | 0 (0.0%) | 21 (6.8%) |
| 35 to 64 Years | 61 (7.0%) | 41 (4.9%) |
| 65 to 74 Years | 56 (22.3%) | 12 (4.0%) |
| 75 Years and over | 11 (16.2%) | 0 (0.0%) |
Disability Class: Self-Care Difficulty
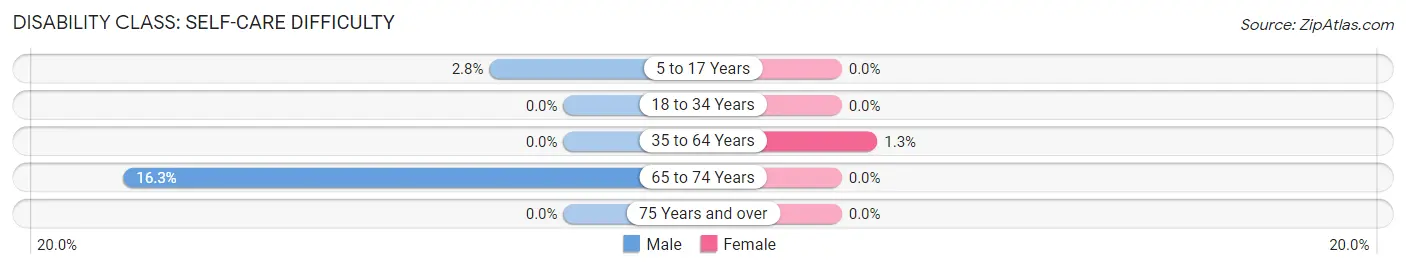
| Age Bracket | Male | Female |
| 5 to 17 Years | 13 (2.8%) | 0 (0.0%) |
| 18 to 34 Years | 0 (0.0%) | 0 (0.0%) |
| 35 to 64 Years | 0 (0.0%) | 11 (1.3%) |
| 65 to 74 Years | 41 (16.3%) | 0 (0.0%) |
| 75 Years and over | 0 (0.0%) | 0 (0.0%) |
Technology Access in Longview Heights
Computing Device Access in Longview Heights
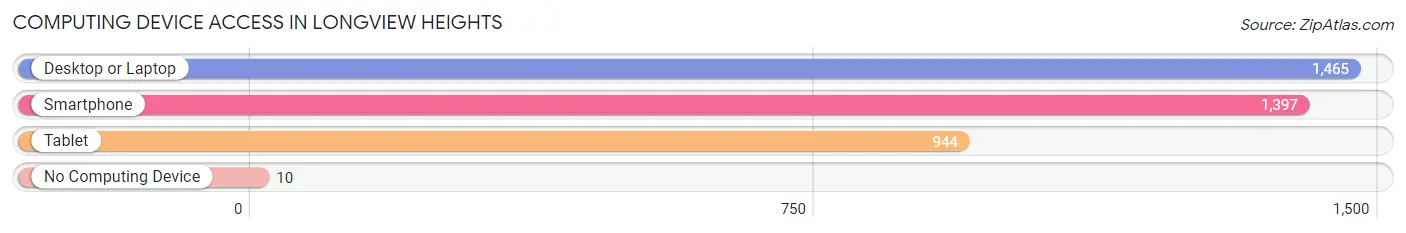
| Device Type | # Households | % Households |
| Desktop or Laptop | 1,465 | 93.8% |
| Smartphone | 1,397 | 89.4% |
| Tablet | 944 | 60.4% |
| No Computing Device | 10 | 0.6% |
| Total | 1,562 | 100.0% |
Internet Access in Longview Heights
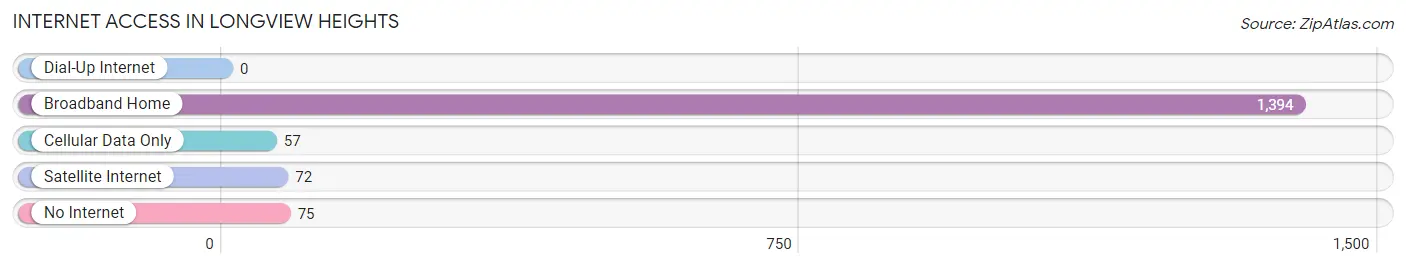
| Internet Type | # Households | % Households |
| Dial-Up Internet | 0 | 0.0% |
| Broadband Home | 1,394 | 89.2% |
| Cellular Data Only | 57 | 3.6% |
| Satellite Internet | 72 | 4.6% |
| No Internet | 75 | 4.8% |
| Total | 1,562 | 100.0% |
Longview Heights Summary
Longview Heights is a small, unincorporated community located in Cowlitz County, Washington. It is situated on the north side of the Columbia River, just east of the city of Longview. The community is home to approximately 1,000 people and is part of the Longview Metropolitan Statistical Area.
History
Longview Heights was first settled in the late 1800s by a group of settlers from the Midwest. The settlers were attracted to the area due to its proximity to the Columbia River and the abundance of timber in the area. The settlers established a small logging camp and began harvesting the timber for use in the local lumber industry.
In the early 1900s, the area began to grow and develop as more settlers moved into the area. The community was officially incorporated in 1912 and was named after the nearby city of Longview.
Geography
Longview Heights is located in Cowlitz County, Washington. It is situated on the north side of the Columbia River, just east of the city of Longview. The community is located at an elevation of approximately 500 feet above sea level.
The area is characterized by rolling hills and lush forests. The climate is mild and temperate, with average temperatures ranging from the mid-30s in the winter to the mid-70s in the summer.
Economy
The economy of Longview Heights is largely based on the timber industry. The area is home to several lumber mills and sawmills, which provide employment for many of the local residents. In addition, the area is home to several small businesses, including restaurants, retail stores, and service providers.
Demographics
As of the 2010 census, the population of Longview Heights was 1,000. The racial makeup of the community was 94.2% White, 0.7% African American, 0.3% Native American, 0.7% Asian, 0.1% Pacific Islander, and 3.1% from other races. The median household income was $45,000, and the median family income was $50,000.
Conclusion
Longview Heights is a small, unincorporated community located in Cowlitz County, Washington. It is situated on the north side of the Columbia River, just east of the city of Longview. The community is home to approximately 1,000 people and is part of the Longview Metropolitan Statistical Area. The economy of Longview Heights is largely based on the timber industry, and the area is characterized by rolling hills and lush forests. The population of Longview Heights is predominantly White, with a median household income of $45,000 and a median family income of $50,000.
Common Questions
What is Per Capita Income in Longview Heights?
Per Capita income in Longview Heights is $35,644.
What is the Median Family Income in Longview Heights?
Median Family Income in Longview Heights is $103,333.
What is the Median Household income in Longview Heights?
Median Household Income in Longview Heights is $83,833.
What is Income or Wage Gap in Longview Heights?
Income or Wage Gap in Longview Heights is 8.9%.
Women in Longview Heights earn 91.1 cents for every dollar earned by a man.
What is Inequality or Gini Index in Longview Heights?
Inequality or Gini Index in Longview Heights is 0.42.
What is the Total Population of Longview Heights?
Total Population of Longview Heights is 4,199.
What is the Total Male Population of Longview Heights?
Total Male Population of Longview Heights is 2,187.
What is the Total Female Population of Longview Heights?
Total Female Population of Longview Heights is 2,012.
What is the Ratio of Males per 100 Females in Longview Heights?
There are 108.70 Males per 100 Females in Longview Heights.
What is the Ratio of Females per 100 Males in Longview Heights?
There are 92.00 Females per 100 Males in Longview Heights.
What is the Median Population Age in Longview Heights?
Median Population Age in Longview Heights is 40.3 Years.
What is the Average Family Size in Longview Heights
Average Family Size in Longview Heights is 3.1 People.
What is the Average Household Size in Longview Heights
Average Household Size in Longview Heights is 2.7 People.
How Large is the Labor Force in Longview Heights?
There are 1,764 People in the Labor Forcein in Longview Heights.
What is the Percentage of People in the Labor Force in Longview Heights?
54.5% of People are in the Labor Force in Longview Heights.
What is the Unemployment Rate in Longview Heights?
Unemployment Rate in Longview Heights is 6.9%.