Cities with the Highest Percentage of Ethiopian Population in Washington
RELATED REPORTS & OPTIONS
Ethiopian
Washington
Compare Cities
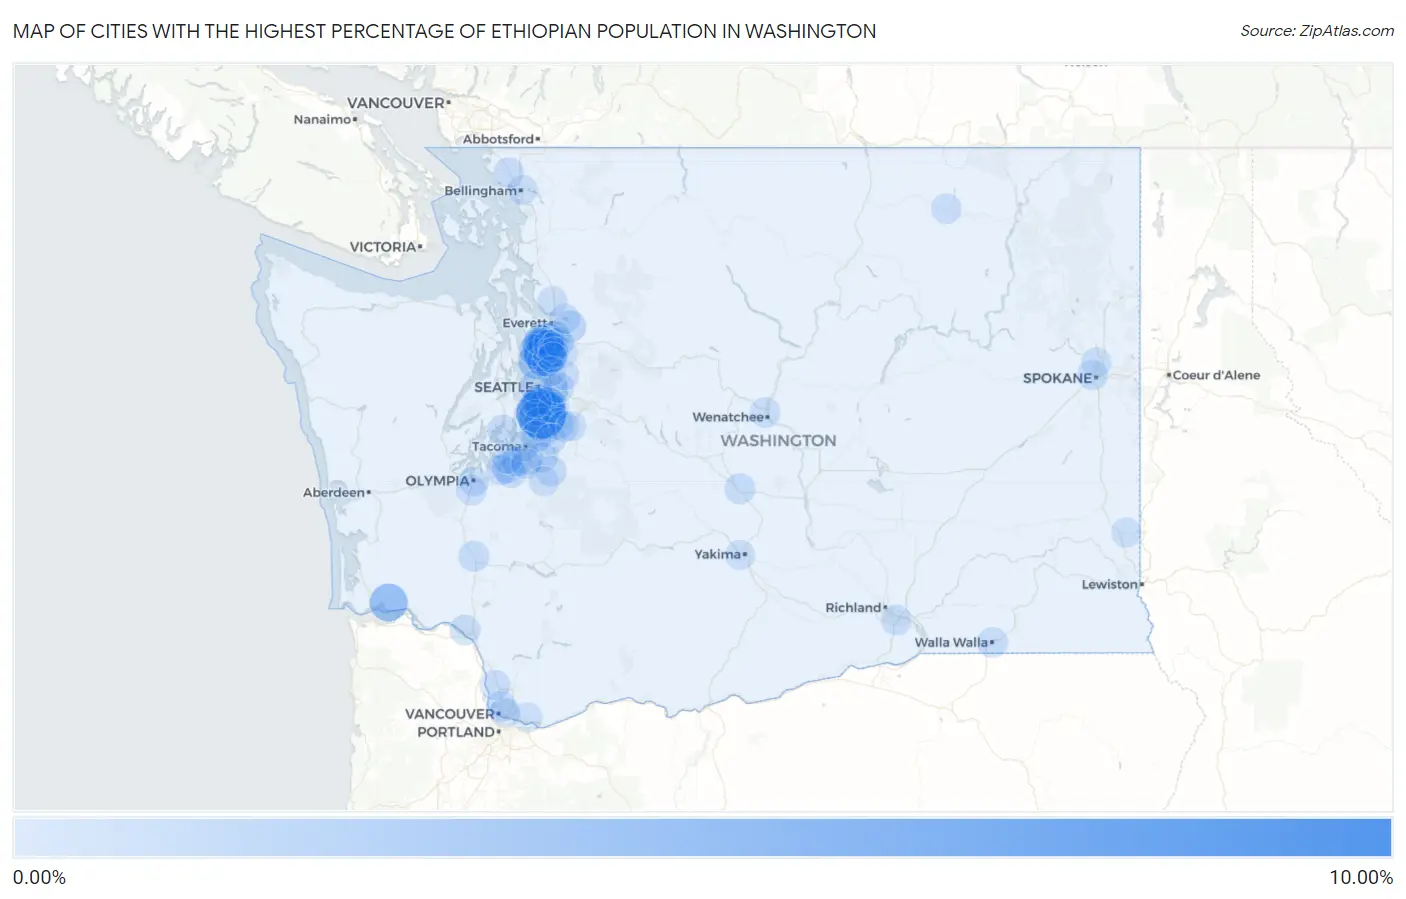
Map of Cities with the Highest Percentage of Ethiopian Population in Washington
0.00%
10.00%
Cities with the Highest Percentage of Ethiopian Population in Washington
| City | Ethiopian | vs State | vs National | |
| 1. | Seatac | 8.40% | 0.33%(+8.07)#1 | 0.11%(+8.29)#9 |
| 2. | Alderwood Manor | 5.13% | 0.33%(+4.80)#2 | 0.11%(+5.02)#25 |
| 3. | Brier | 5.00% | 0.33%(+4.67)#3 | 0.11%(+4.89)#27 |
| 4. | Lynnwood | 3.30% | 0.33%(+2.97)#4 | 0.11%(+3.20)#54 |
| 5. | Rosburg | 3.26% | 0.33%(+2.93)#5 | 0.11%(+3.16)#57 |
| 6. | Tukwila | 3.02% | 0.33%(+2.69)#6 | 0.11%(+2.91)#66 |
| 7. | Lake Stickney | 2.74% | 0.33%(+2.41)#7 | 0.11%(+2.63)#77 |
| 8. | Shoreline | 2.49% | 0.33%(+2.16)#8 | 0.11%(+2.39)#85 |
| 9. | Bryn Mawr Skyway | 2.36% | 0.33%(+2.03)#9 | 0.11%(+2.26)#91 |
| 10. | Larch Way | 2.09% | 0.33%(+1.76)#10 | 0.11%(+1.98)#104 |
| 11. | Burien | 1.61% | 0.33%(+1.27)#11 | 0.11%(+1.50)#135 |
| 12. | North Lynnwood | 1.58% | 0.33%(+1.25)#12 | 0.11%(+1.48)#140 |
| 13. | Boulevard Park | 1.43% | 0.33%(+1.10)#13 | 0.11%(+1.32)#159 |
| 14. | Des Moines | 1.27% | 0.33%(+0.941)#14 | 0.11%(+1.17)#190 |
| 15. | Seattle | 1.17% | 0.33%(+0.834)#15 | 0.11%(+1.06)#206 |
| 16. | Mountlake Terrace | 1.16% | 0.33%(+0.829)#16 | 0.11%(+1.05)#208 |
| 17. | Normandy Park | 1.06% | 0.33%(+0.728)#17 | 0.11%(+0.953)#227 |
| 18. | Meadowdale | 0.93% | 0.33%(+0.602)#18 | 0.11%(+0.828)#255 |
| 19. | Fairwood Cdp King County | 0.90% | 0.33%(+0.570)#19 | 0.11%(+0.795)#263 |
| 20. | Everett | 0.86% | 0.33%(+0.525)#20 | 0.11%(+0.751)#277 |
| 21. | Edmonds | 0.77% | 0.33%(+0.433)#21 | 0.11%(+0.658)#296 |
| 22. | Midland | 0.69% | 0.33%(+0.361)#22 | 0.11%(+0.586)#322 |
| 23. | Kent | 0.58% | 0.33%(+0.247)#23 | 0.11%(+0.473)#361 |
| 24. | Lakeland North | 0.57% | 0.33%(+0.236)#24 | 0.11%(+0.461)#373 |
| 25. | North Fort Lewis | 0.55% | 0.33%(+0.215)#25 | 0.11%(+0.441)#383 |
| 26. | Renton | 0.52% | 0.33%(+0.188)#26 | 0.11%(+0.413)#399 |
| 27. | Federal Way | 0.46% | 0.33%(+0.128)#27 | 0.11%(+0.354)#423 |
| 28. | Beaux Arts Village | 0.39% | 0.33%(+0.055)#28 | 0.11%(+0.280)#474 |
| 29. | Eastmont | 0.36% | 0.33%(+0.030)#29 | 0.11%(+0.255)#498 |
| 30. | Napavine | 0.35% | 0.33%(+0.020)#30 | 0.11%(+0.246)#512 |
| 31. | Covington | 0.34% | 0.33%(+0.008)#31 | 0.11%(+0.234)#527 |
| 32. | Lake Forest Park | 0.33% | 0.33%(+0.002)#32 | 0.11%(+0.227)#531 |
| 33. | Fort Lewis | 0.30% | 0.33%(-0.035)#33 | 0.11%(+0.190)#572 |
| 34. | Longview | 0.29% | 0.33%(-0.044)#34 | 0.11%(+0.182)#586 |
| 35. | Ellensburg | 0.28% | 0.33%(-0.048)#35 | 0.11%(+0.177)#592 |
| 36. | Picnic Point | 0.28% | 0.33%(-0.051)#36 | 0.11%(+0.174)#594 |
| 37. | Rosedale | 0.28% | 0.33%(-0.052)#37 | 0.11%(+0.174)#596 |
| 38. | Walla Walla | 0.28% | 0.33%(-0.055)#38 | 0.11%(+0.170)#605 |
| 39. | Kenmore | 0.25% | 0.33%(-0.079)#39 | 0.11%(+0.147)#631 |
| 40. | Maltby | 0.25% | 0.33%(-0.086)#40 | 0.11%(+0.139)#637 |
| 41. | Bellevue | 0.24% | 0.33%(-0.094)#41 | 0.11%(+0.132)#653 |
| 42. | Orting | 0.24% | 0.33%(-0.097)#42 | 0.11%(+0.129)#661 |
| 43. | Bothell West | 0.22% | 0.33%(-0.113)#43 | 0.11%(+0.112)#693 |
| 44. | White Center | 0.21% | 0.33%(-0.126)#44 | 0.11%(+0.099)#720 |
| 45. | Hazel Dell | 0.19% | 0.33%(-0.143)#45 | 0.11%(+0.082)#758 |
| 46. | Kennewick | 0.18% | 0.33%(-0.149)#46 | 0.11%(+0.076)#766 |
| 47. | Martha Lake | 0.18% | 0.33%(-0.156)#47 | 0.11%(+0.069)#777 |
| 48. | Vancouver | 0.17% | 0.33%(-0.159)#48 | 0.11%(+0.066)#786 |
| 49. | Tumwater | 0.16% | 0.33%(-0.173)#49 | 0.11%(+0.053)#818 |
| 50. | Auburn | 0.15% | 0.33%(-0.180)#50 | 0.11%(+0.046)#834 |
| 51. | Spokane | 0.15% | 0.33%(-0.182)#51 | 0.11%(+0.043)#838 |
| 52. | Mill Creek East | 0.15% | 0.33%(-0.182)#52 | 0.11%(+0.043)#839 |
| 53. | Dupont | 0.14% | 0.33%(-0.192)#53 | 0.11%(+0.033)#869 |
| 54. | Redmond | 0.14% | 0.33%(-0.194)#54 | 0.11%(+0.031)#877 |
| 55. | Lakewood | 0.13% | 0.33%(-0.200)#55 | 0.11%(+0.026)#889 |
| 56. | Wenatchee | 0.13% | 0.33%(-0.203)#56 | 0.11%(+0.023)#900 |
| 57. | Ridgefield | 0.12% | 0.33%(-0.211)#57 | 0.11%(+0.015)#929 |
| 58. | Silver Firs | 0.12% | 0.33%(-0.216)#58 | 0.11%(+0.010)#944 |
| 59. | Puyallup | 0.10% | 0.33%(-0.229)#59 | 0.11%(-0.004)#988 |
| 60. | Republic | 0.089% | 0.33%(-0.243)#60 | 0.11%(-0.018)#1,039 |
| 61. | Ferndale | 0.086% | 0.33%(-0.247)#61 | 0.11%(-0.021)#1,055 |
| 62. | Bothell East | 0.079% | 0.33%(-0.254)#62 | 0.11%(-0.028)#1,089 |
| 63. | Tacoma | 0.078% | 0.33%(-0.254)#63 | 0.11%(-0.029)#1,091 |
| 64. | Steilacoom | 0.075% | 0.33%(-0.258)#64 | 0.11%(-0.032)#1,101 |
| 65. | Lake Stevens | 0.067% | 0.33%(-0.266)#65 | 0.11%(-0.040)#1,132 |
| 66. | Country Homes | 0.064% | 0.33%(-0.269)#66 | 0.11%(-0.043)#1,138 |
| 67. | Camas | 0.053% | 0.33%(-0.280)#67 | 0.11%(-0.054)#1,203 |
| 68. | Maple Valley | 0.047% | 0.33%(-0.286)#68 | 0.11%(-0.061)#1,248 |
| 69. | Parkland | 0.046% | 0.33%(-0.287)#69 | 0.11%(-0.062)#1,255 |
| 70. | Bellingham | 0.036% | 0.33%(-0.297)#70 | 0.11%(-0.071)#1,312 |
| 71. | Pullman | 0.034% | 0.33%(-0.298)#71 | 0.11%(-0.073)#1,327 |
| 72. | Olympia | 0.029% | 0.33%(-0.304)#72 | 0.11%(-0.078)#1,374 |
| 73. | Kirkland | 0.026% | 0.33%(-0.307)#73 | 0.11%(-0.081)#1,400 |
| 74. | Graham | 0.026% | 0.33%(-0.307)#74 | 0.11%(-0.081)#1,401 |
| 75. | Marysville | 0.011% | 0.33%(-0.321)#75 | 0.11%(-0.096)#1,545 |
| 76. | Yakima | 0.0072% | 0.33%(-0.325)#76 | 0.11%(-0.100)#1,583 |
| 77. | Bothell | 0.0042% | 0.33%(-0.328)#77 | 0.11%(-0.103)#1,608 |
Common Questions
What are the Top 10 Cities with the Highest Percentage of Ethiopian Population in Washington?
Top 10 Cities with the Highest Percentage of Ethiopian Population in Washington are:
#1
8.40%
#2
5.13%
#3
5.00%
#4
3.30%
#5
3.26%
#6
3.02%
#7
2.74%
#8
2.49%
#9
2.36%
#10
2.09%
What city has the Highest Percentage of Ethiopian Population in Washington?
SeaTac has the Highest Percentage of Ethiopian Population in Washington with 8.40%.
What is the Percentage of Ethiopian Population in the State of Washington?
Percentage of Ethiopian Population in Washington is 0.33%.
What is the Percentage of Ethiopian Population in the United States?
Percentage of Ethiopian Population in the United States is 0.11%.