Cities with the Highest Male Poverty Level in Washington
RELATED REPORTS & OPTIONS
Highest Poverty | Male
Washington
Compare Cities
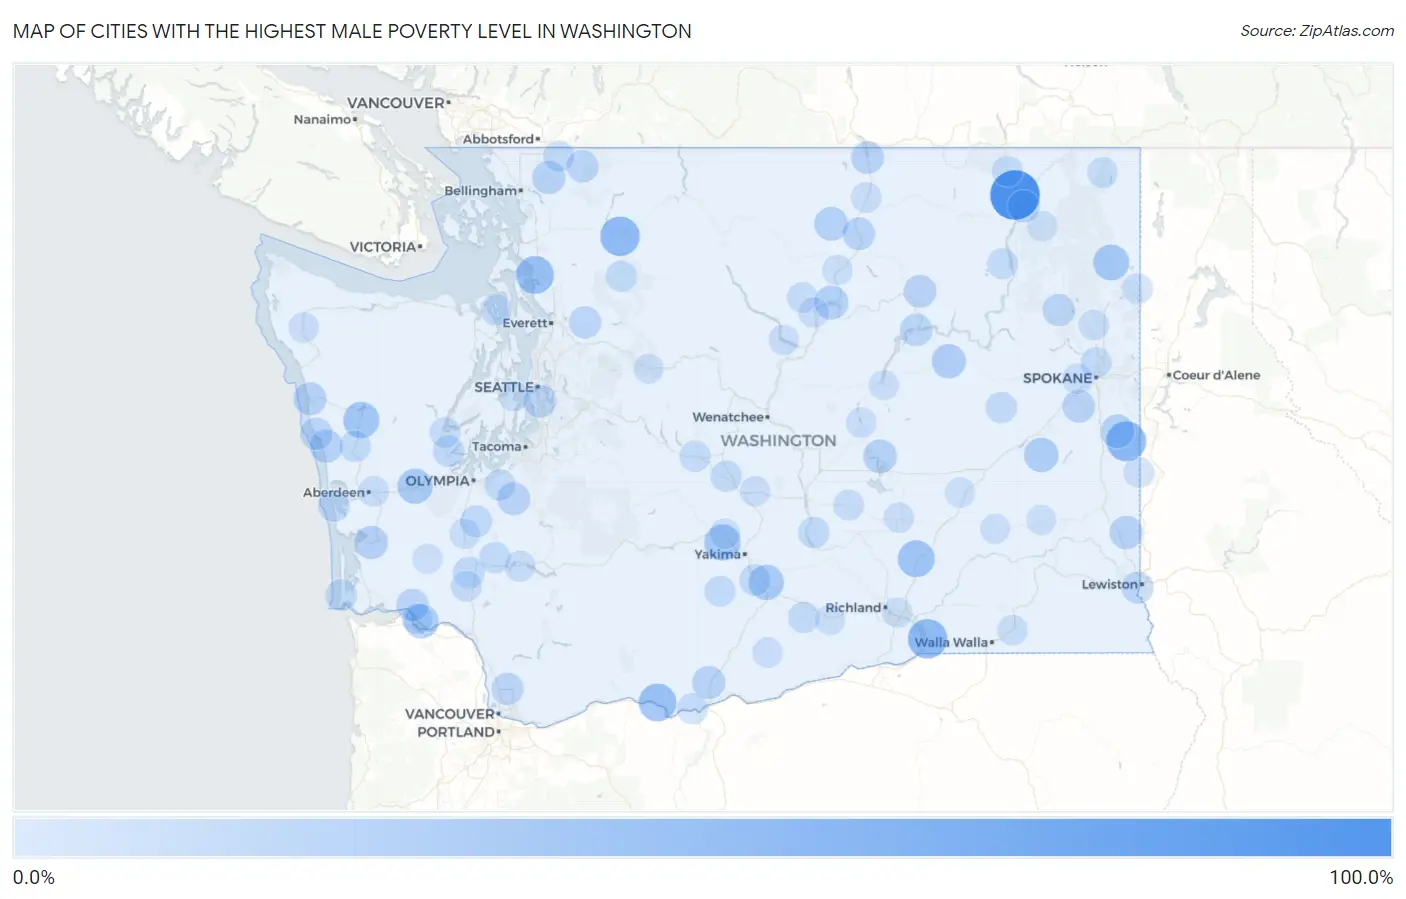
Map of Cities with the Highest Male Poverty Level in Washington
0.0%
100.0%
Cities with the Highest Male Poverty Level in Washington
| City | Male Poverty | vs State | vs National | |
| 1. | Boyds | 100.0% | 9.0%(+91.0)#1 | 11.3%(+88.7)#77 |
| 2. | Latah | 58.3% | 9.0%(+49.4)#2 | 11.3%(+47.0)#556 |
| 3. | Rockport | 56.5% | 9.0%(+47.6)#3 | 11.3%(+45.2)#606 |
| 4. | Wallula | 56.5% | 9.0%(+47.5)#4 | 11.3%(+45.1)#609 |
| 5. | Northwest Stanwood | 50.0% | 9.0%(+41.0)#5 | 11.3%(+38.7)#877 |
| 6. | Lyle | 49.6% | 9.0%(+40.6)#6 | 11.3%(+38.2)#904 |
| 7. | Mesa | 45.7% | 9.0%(+36.7)#7 | 11.3%(+34.4)#1,123 |
| 8. | Neilton | 43.4% | 9.0%(+34.4)#8 | 11.3%(+32.0)#1,264 |
| 9. | Cowiche | 43.3% | 9.0%(+34.3)#9 | 11.3%(+31.9)#1,273 |
| 10. | Cusick | 41.8% | 9.0%(+32.8)#10 | 11.3%(+30.4)#1,393 |
| 11. | Buena | 39.1% | 9.0%(+30.2)#11 | 11.3%(+27.8)#1,654 |
| 12. | Elma | 38.5% | 9.0%(+29.6)#12 | 11.3%(+27.2)#1,736 |
| 13. | East Cathlamet | 36.4% | 9.0%(+27.5)#13 | 11.3%(+25.1)#1,970 |
| 14. | Lamont | 35.7% | 9.0%(+26.8)#14 | 11.3%(+24.4)#2,061 |
| 15. | Wilbur | 35.3% | 9.0%(+26.3)#15 | 11.3%(+23.9)#2,116 |
| 16. | Brewster | 34.2% | 9.0%(+25.3)#16 | 11.3%(+22.9)#2,257 |
| 17. | Conconully | 33.3% | 9.0%(+24.4)#17 | 11.3%(+22.0)#2,378 |
| 18. | Waverly | 33.3% | 9.0%(+24.4)#18 | 11.3%(+22.0)#2,380 |
| 19. | Moses Lake North | 32.8% | 9.0%(+23.8)#19 | 11.3%(+21.4)#2,482 |
| 20. | South Bend | 31.5% | 9.0%(+22.6)#20 | 11.3%(+20.2)#2,697 |
| 21. | Pullman | 31.5% | 9.0%(+22.5)#21 | 11.3%(+20.1)#2,703 |
| 22. | Deming | 31.0% | 9.0%(+22.0)#22 | 11.3%(+19.6)#2,795 |
| 23. | Beverly | 30.5% | 9.0%(+21.6)#23 | 11.3%(+19.2)#2,867 |
| 24. | Goldendale | 30.5% | 9.0%(+21.5)#24 | 11.3%(+19.1)#2,878 |
| 25. | Queets | 30.4% | 9.0%(+21.5)#25 | 11.3%(+19.1)#2,885 |
| 26. | Qui Nai Elt Village | 30.3% | 9.0%(+21.4)#26 | 11.3%(+19.0)#2,914 |
| 27. | Mckenna | 30.1% | 9.0%(+21.2)#27 | 11.3%(+18.8)#2,955 |
| 28. | Oroville | 29.5% | 9.0%(+20.5)#28 | 11.3%(+18.1)#3,092 |
| 29. | Nespelem | 29.4% | 9.0%(+20.5)#29 | 11.3%(+18.1)#3,109 |
| 30. | Cheney | 28.9% | 9.0%(+19.9)#30 | 11.3%(+17.6)#3,233 |
| 31. | Riverside | 28.8% | 9.0%(+19.9)#31 | 11.3%(+17.5)#3,241 |
| 32. | Skamokawa Valley | 28.7% | 9.0%(+19.8)#32 | 11.3%(+17.4)#3,258 |
| 33. | Boulevard Park | 28.6% | 9.0%(+19.6)#33 | 11.3%(+17.2)#3,298 |
| 34. | Grand Coulee | 28.3% | 9.0%(+19.3)#34 | 11.3%(+17.0)#3,379 |
| 35. | Taholah | 28.1% | 9.0%(+19.1)#35 | 11.3%(+16.7)#3,425 |
| 36. | Lake Roesiger | 28.1% | 9.0%(+19.1)#36 | 11.3%(+16.7)#3,432 |
| 37. | Marcus | 27.2% | 9.0%(+18.2)#37 | 11.3%(+15.8)#3,657 |
| 38. | Springdale | 27.1% | 9.0%(+18.2)#38 | 11.3%(+15.8)#3,672 |
| 39. | Dollars Corner | 26.9% | 9.0%(+18.0)#39 | 11.3%(+15.6)#3,727 |
| 40. | West Clarkston Highland | 26.2% | 9.0%(+17.3)#40 | 11.3%(+14.9)#3,924 |
| 41. | Glacier | 26.2% | 9.0%(+17.2)#41 | 11.3%(+14.8)#3,936 |
| 42. | Bucoda | 25.4% | 9.0%(+16.4)#42 | 11.3%(+14.0)#4,181 |
| 43. | Shelton | 25.0% | 9.0%(+16.0)#43 | 11.3%(+13.7)#4,303 |
| 44. | Winlock | 24.7% | 9.0%(+15.7)#44 | 11.3%(+13.3)#4,461 |
| 45. | Marrowstone | 24.5% | 9.0%(+15.6)#45 | 11.3%(+13.2)#4,511 |
| 46. | Long Beach | 24.2% | 9.0%(+15.3)#46 | 11.3%(+12.9)#4,604 |
| 47. | Humptulips | 24.1% | 9.0%(+15.1)#47 | 11.3%(+12.7)#4,669 |
| 48. | Wapato | 24.0% | 9.0%(+15.0)#48 | 11.3%(+12.6)#4,704 |
| 49. | Crescent Bar | 23.8% | 9.0%(+14.9)#49 | 11.3%(+12.5)#4,750 |
| 50. | Mattawa | 23.8% | 9.0%(+14.9)#50 | 11.3%(+12.5)#4,780 |
| 51. | Nisqually Indian Community | 23.8% | 9.0%(+14.8)#51 | 11.3%(+12.4)#4,789 |
| 52. | Harrington | 23.7% | 9.0%(+14.7)#52 | 11.3%(+12.3)#4,830 |
| 53. | Thorp | 23.6% | 9.0%(+14.7)#53 | 11.3%(+12.3)#4,840 |
| 54. | Mabton | 23.6% | 9.0%(+14.7)#54 | 11.3%(+12.3)#4,854 |
| 55. | Peaceful Valley | 23.6% | 9.0%(+14.6)#55 | 11.3%(+12.2)#4,874 |
| 56. | Onalaska | 23.4% | 9.0%(+14.5)#56 | 11.3%(+12.1)#4,928 |
| 57. | Westport | 23.3% | 9.0%(+14.3)#57 | 11.3%(+12.0)#4,977 |
| 58. | South Cle Elum | 22.8% | 9.0%(+13.9)#58 | 11.3%(+11.5)#5,147 |
| 59. | White Swan | 22.7% | 9.0%(+13.8)#59 | 11.3%(+11.4)#5,205 |
| 60. | Clear Lake Cdp Skagit County | 22.7% | 9.0%(+13.7)#60 | 11.3%(+11.3)#5,240 |
| 61. | Inchelium | 22.3% | 9.0%(+13.4)#61 | 11.3%(+11.0)#5,382 |
| 62. | Darrington | 22.3% | 9.0%(+13.4)#62 | 11.3%(+11.0)#5,391 |
| 63. | Wishram | 22.3% | 9.0%(+13.4)#63 | 11.3%(+11.0)#5,394 |
| 64. | Orient | 22.2% | 9.0%(+13.3)#64 | 11.3%(+10.9)#5,449 |
| 65. | Country Homes | 22.1% | 9.0%(+13.1)#65 | 11.3%(+10.7)#5,517 |
| 66. | Vader | 21.9% | 9.0%(+12.9)#66 | 11.3%(+10.6)#5,598 |
| 67. | Skokomish | 21.8% | 9.0%(+12.9)#67 | 11.3%(+10.5)#5,625 |
| 68. | Mossyrock | 21.6% | 9.0%(+12.7)#68 | 11.3%(+10.3)#5,735 |
| 69. | Cathlamet | 21.6% | 9.0%(+12.6)#69 | 11.3%(+10.2)#5,774 |
| 70. | Newport | 21.3% | 9.0%(+12.3)#70 | 11.3%(+9.93)#5,899 |
| 71. | Royal City | 21.0% | 9.0%(+12.0)#71 | 11.3%(+9.63)#6,037 |
| 72. | Methow | 20.8% | 9.0%(+11.9)#72 | 11.3%(+9.49)#6,113 |
| 73. | Metaline Falls | 20.8% | 9.0%(+11.8)#73 | 11.3%(+9.41)#6,143 |
| 74. | Deer Park | 20.7% | 9.0%(+11.7)#74 | 11.3%(+9.35)#6,168 |
| 75. | Forks | 20.6% | 9.0%(+11.6)#75 | 11.3%(+9.24)#6,236 |
| 76. | Naches | 20.5% | 9.0%(+11.6)#76 | 11.3%(+9.16)#6,262 |
| 77. | Tonasket | 20.5% | 9.0%(+11.5)#77 | 11.3%(+9.14)#6,272 |
| 78. | Farmington | 20.5% | 9.0%(+11.5)#78 | 11.3%(+9.11)#6,287 |
| 79. | Pateros | 20.4% | 9.0%(+11.4)#79 | 11.3%(+9.03)#6,339 |
| 80. | Airway Heights | 20.3% | 9.0%(+11.4)#80 | 11.3%(+9.01)#6,352 |
| 81. | Aberdeen | 20.3% | 9.0%(+11.4)#81 | 11.3%(+8.98)#6,364 |
| 82. | Othello | 20.3% | 9.0%(+11.4)#82 | 11.3%(+8.97)#6,367 |
| 83. | Dixie | 20.2% | 9.0%(+11.3)#83 | 11.3%(+8.90)#6,403 |
| 84. | Manson | 19.9% | 9.0%(+11.0)#84 | 11.3%(+8.60)#6,560 |
| 85. | Centralia | 19.9% | 9.0%(+11.0)#85 | 11.3%(+8.59)#6,564 |
| 86. | Kittitas | 19.7% | 9.0%(+10.7)#86 | 11.3%(+8.33)#6,691 |
| 87. | Soap Lake | 19.5% | 9.0%(+10.5)#87 | 11.3%(+8.12)#6,816 |
| 88. | Bickleton | 19.4% | 9.0%(+10.5)#88 | 11.3%(+8.10)#6,837 |
| 89. | Malott | 19.4% | 9.0%(+10.5)#89 | 11.3%(+8.09)#6,845 |
| 90. | Lind | 19.3% | 9.0%(+10.3)#90 | 11.3%(+7.95)#6,909 |
| 91. | Prosser | 19.3% | 9.0%(+10.3)#91 | 11.3%(+7.94)#6,917 |
| 92. | Beacon Hill | 19.3% | 9.0%(+10.3)#92 | 11.3%(+7.93)#6,923 |
| 93. | Coulee City | 19.2% | 9.0%(+10.3)#93 | 11.3%(+7.89)#6,953 |
| 94. | Pe Ell | 18.9% | 9.0%(+10.00)#94 | 11.3%(+7.61)#7,109 |
| 95. | Lacrosse | 18.9% | 9.0%(+9.97)#95 | 11.3%(+7.58)#7,129 |
| 96. | Skykomish | 18.9% | 9.0%(+9.97)#96 | 11.3%(+7.58)#7,135 |
| 97. | Colville | 18.9% | 9.0%(+9.90)#97 | 11.3%(+7.51)#7,178 |
| 98. | Washtucna | 18.8% | 9.0%(+9.87)#98 | 11.3%(+7.48)#7,195 |
| 99. | Manchester | 18.8% | 9.0%(+9.83)#99 | 11.3%(+7.44)#7,221 |
| 100. | West Pasco | 18.6% | 9.0%(+9.66)#100 | 11.3%(+7.27)#7,340 |
Common Questions
What are the Top 10 Cities with the Highest Male Poverty Level in Washington?
Top 10 Cities with the Highest Male Poverty Level in Washington are:
What city has the Highest Male Poverty Level in Washington?
Boyds has the Highest Male Poverty Level in Washington with 100.0%.
What is the Poverty Level Among Males in the State of Washington?
Poverty Level Among Males in Washington is 9.0%.
What is the Poverty Level Among Males in the United States?
Poverty Level Among Males in the United States is 11.3%.