Zip Codes with the Highest Percentage of Population Employed in Food Preparation & Serving in Port Orchard, WA
RELATED REPORTS & OPTIONS
Food Preparation & Serving
Port Orchard
Compare Zip Codes
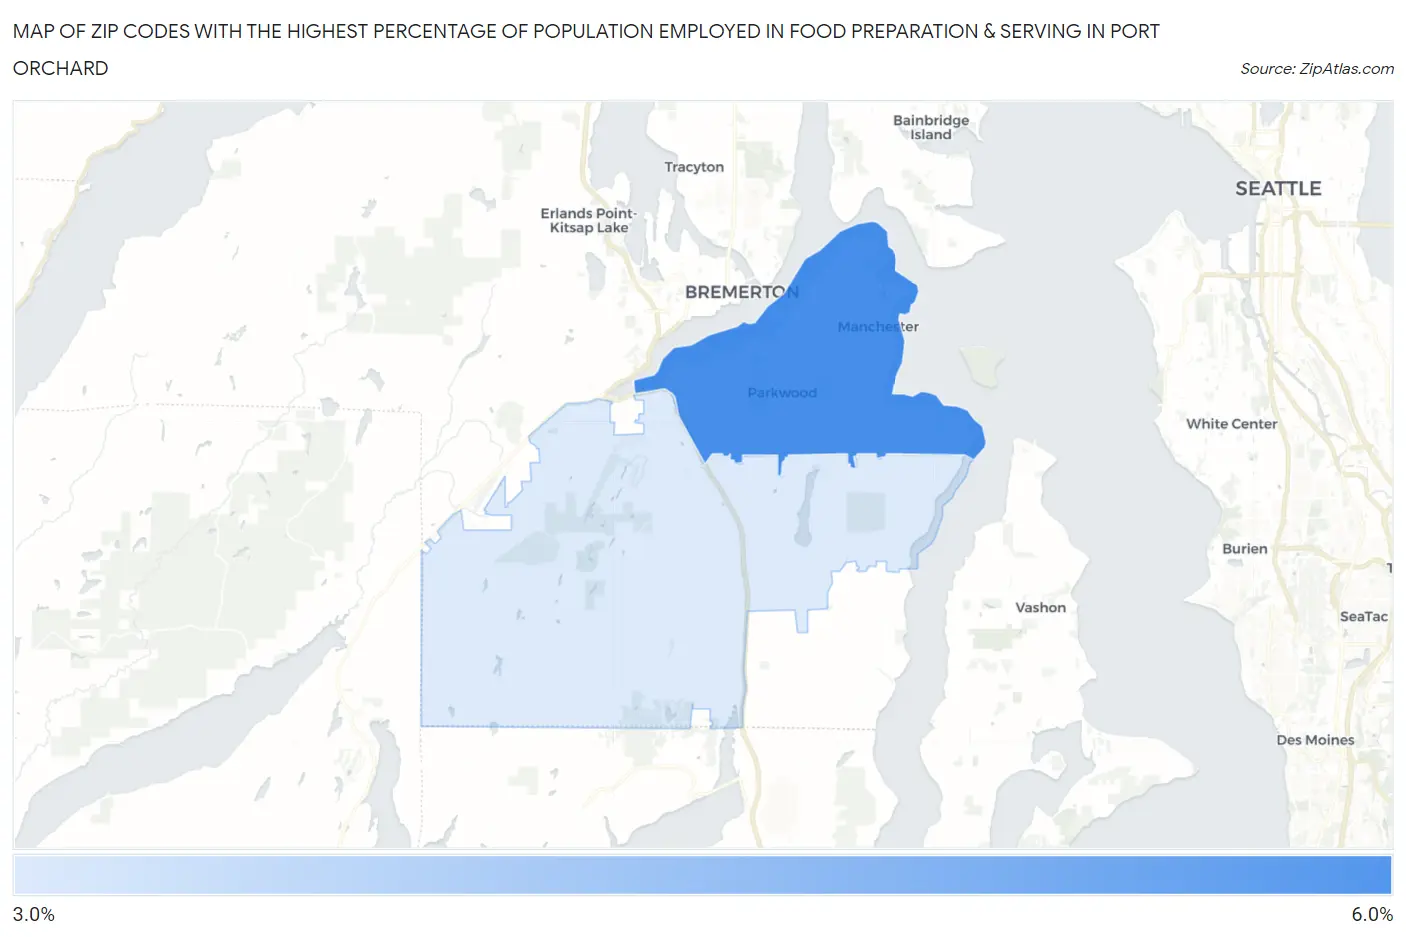
Map of Zip Codes with the Highest Percentage of Population Employed in Food Preparation & Serving in Port Orchard
4.0%
5.9%
Zip Codes with the Highest Percentage of Population Employed in Food Preparation & Serving in Port Orchard, WA
| Zip Code | % Employed | vs State | vs National | |
| 1. | 98366 | 5.9% | 5.1%(+0.707)#172 | 5.3%(+0.564)#9,865 |
| 2. | 98367 | 4.0% | 5.1%(-1.16)#319 | 5.3%(-1.30)#17,192 |
1
Common Questions
What are the Top Zip Codes with the Highest Percentage of Population Employed in Food Preparation & Serving in Port Orchard, WA?
Top Zip Codes with the Highest Percentage of Population Employed in Food Preparation & Serving in Port Orchard, WA are:
What zip code has the Highest Percentage of Population Employed in Food Preparation & Serving in Port Orchard, WA?
98366 has the Highest Percentage of Population Employed in Food Preparation & Serving in Port Orchard, WA with 5.9%.
What is the Percentage of Population Employed in Food Preparation & Serving in Port Orchard, WA?
Percentage of Population Employed in Food Preparation & Serving in Port Orchard is 6.7%.
What is the Percentage of Population Employed in Food Preparation & Serving in Washington?
Percentage of Population Employed in Food Preparation & Serving in Washington is 5.1%.
What is the Percentage of Population Employed in Food Preparation & Serving in the United States?
Percentage of Population Employed in Food Preparation & Serving in the United States is 5.3%.