Cities with the Highest Percentage of Population with a Degree in Science and Engineering in Washington
RELATED REPORTS & OPTIONS
Science and Engineering
Washington
Compare Cities
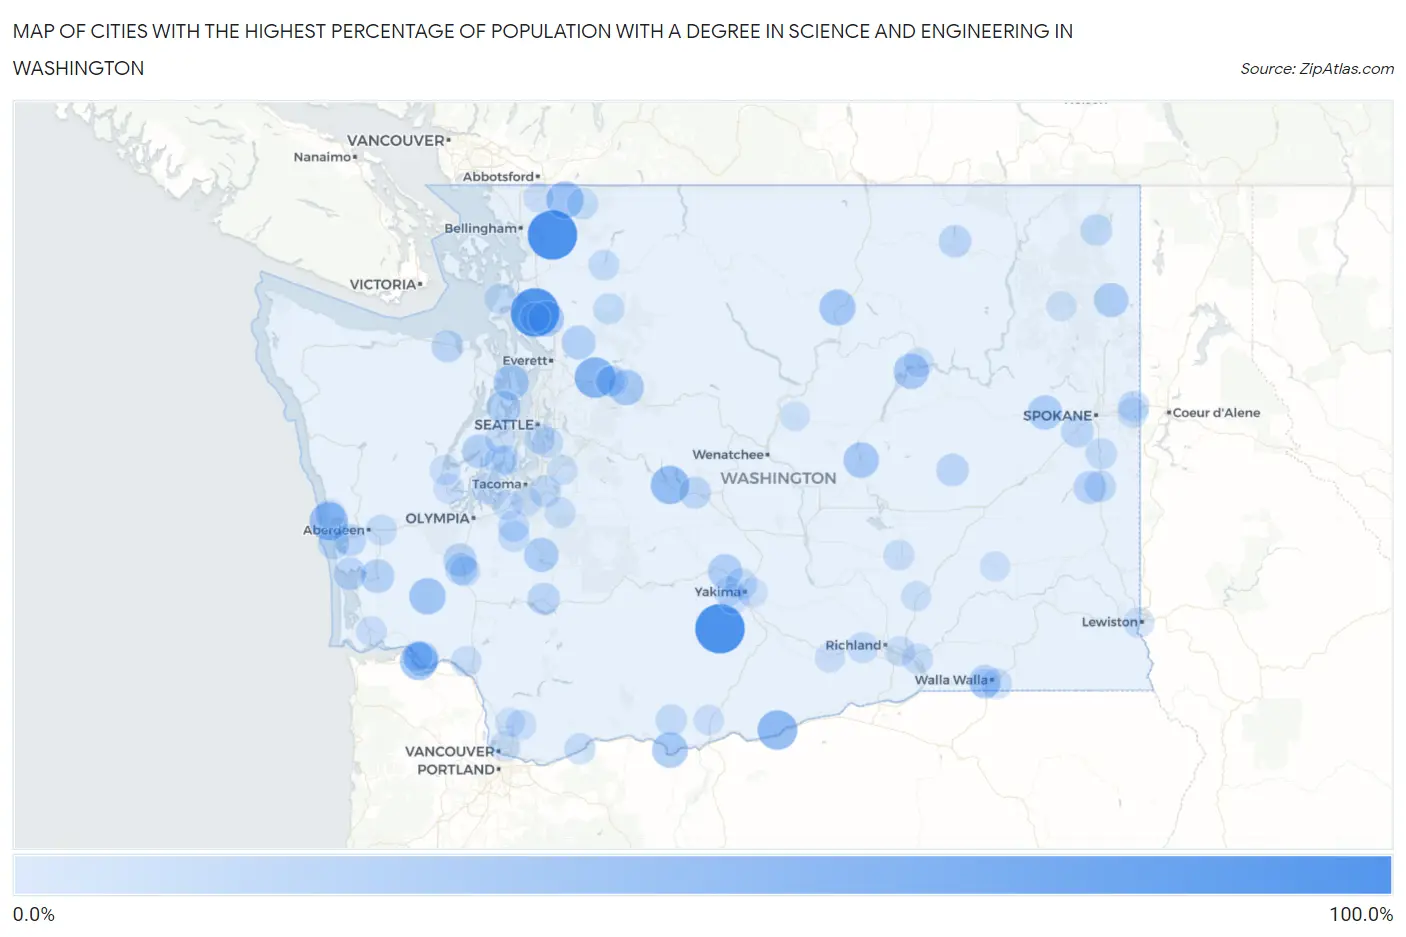
Map of Cities with the Highest Percentage of Population with a Degree in Science and Engineering in Washington
0.0%
100.0%
Cities with the Highest Percentage of Population with a Degree in Science and Engineering in Washington
| City | % Graduates | vs State | vs National | |
| 1. | White Swan | 100.0% | 8.7%(+91.3)#1 | 9.8%(+90.2)#26 |
| 2. | Acme | 100.0% | 8.7%(+91.3)#2 | 9.8%(+90.2)#125 |
| 3. | Northwest Stanwood | 95.5% | 8.7%(+86.7)#3 | 9.8%(+85.7)#213 |
| 4. | North Sultan | 60.0% | 8.7%(+51.3)#4 | 9.8%(+50.2)#402 |
| 5. | Roosevelt | 55.6% | 8.7%(+46.8)#5 | 9.8%(+45.8)#470 |
| 6. | Pataha | 55.6% | 8.7%(+46.8)#6 | 9.8%(+45.8)#472 |
| 7. | Easton | 50.0% | 8.7%(+41.3)#7 | 9.8%(+40.2)#557 |
| 8. | Oyehut | 50.0% | 8.7%(+41.3)#8 | 9.8%(+40.2)#621 |
| 9. | Puget Island | 46.3% | 8.7%(+37.6)#9 | 9.8%(+36.5)#718 |
| 10. | Maple Falls | 45.0% | 8.7%(+36.3)#10 | 9.8%(+35.2)#745 |
| 11. | Pe Ell | 41.2% | 8.7%(+32.4)#11 | 9.8%(+31.4)#905 |
| 12. | Malott | 40.7% | 8.7%(+32.0)#12 | 9.8%(+31.0)#918 |
| 13. | Dallesport | 38.6% | 8.7%(+29.9)#13 | 9.8%(+28.8)#1,036 |
| 14. | Sunday Lake | 37.8% | 8.7%(+29.0)#14 | 9.8%(+28.0)#1,077 |
| 15. | Soap Lake | 37.7% | 8.7%(+29.0)#15 | 9.8%(+28.0)#1,078 |
| 16. | Index | 37.5% | 8.7%(+28.8)#16 | 9.8%(+27.7)#1,107 |
| 17. | Electric City | 37.1% | 8.7%(+28.4)#17 | 9.8%(+27.3)#1,121 |
| 18. | Port Gamble Tribal Community | 36.7% | 8.7%(+28.0)#18 | 9.8%(+26.9)#1,134 |
| 19. | East Cathlamet | 34.8% | 8.7%(+26.0)#19 | 9.8%(+25.0)#1,250 |
| 20. | La Grande | 33.3% | 8.7%(+24.6)#20 | 9.8%(+23.6)#1,350 |
| 21. | Cusick | 33.3% | 8.7%(+24.6)#21 | 9.8%(+23.6)#1,355 |
| 22. | Reardan | 32.9% | 8.7%(+24.1)#22 | 9.8%(+23.1)#1,426 |
| 23. | Naches | 32.5% | 8.7%(+23.8)#23 | 9.8%(+22.7)#1,445 |
| 24. | Granite Falls | 30.8% | 8.7%(+22.1)#24 | 9.8%(+21.1)#1,587 |
| 25. | Keyport | 30.5% | 8.7%(+21.7)#25 | 9.8%(+20.7)#1,622 |
| 26. | Belfair | 29.6% | 8.7%(+20.9)#26 | 9.8%(+19.8)#1,727 |
| 27. | Raymond | 29.4% | 8.7%(+20.7)#27 | 9.8%(+19.6)#1,746 |
| 28. | Grand Mound | 28.5% | 8.7%(+19.8)#28 | 9.8%(+18.7)#1,904 |
| 29. | Malden | 26.3% | 8.7%(+17.6)#29 | 9.8%(+16.5)#2,193 |
| 30. | Garrett | 26.0% | 8.7%(+17.3)#30 | 9.8%(+16.3)#2,228 |
| 31. | Four Lakes | 25.5% | 8.7%(+16.8)#31 | 9.8%(+15.7)#2,320 |
| 32. | Odessa | 25.3% | 8.7%(+16.6)#32 | 9.8%(+15.5)#2,350 |
| 33. | Torboy | 25.0% | 8.7%(+16.3)#33 | 9.8%(+15.2)#2,433 |
| 34. | Markham | 25.0% | 8.7%(+16.3)#34 | 9.8%(+15.2)#2,458 |
| 35. | Tokeland | 25.0% | 8.7%(+16.3)#35 | 9.8%(+15.2)#2,470 |
| 36. | Morton | 24.4% | 8.7%(+15.7)#36 | 9.8%(+14.6)#2,569 |
| 37. | Fords Prairie | 23.6% | 8.7%(+14.9)#37 | 9.8%(+13.8)#2,730 |
| 38. | River Road | 23.1% | 8.7%(+14.4)#38 | 9.8%(+13.3)#2,857 |
| 39. | Cle Elum | 23.1% | 8.7%(+14.4)#39 | 9.8%(+13.3)#2,862 |
| 40. | North Puyallup | 22.6% | 8.7%(+13.9)#40 | 9.8%(+12.9)#2,990 |
| 41. | Rosalia | 22.5% | 8.7%(+13.8)#41 | 9.8%(+12.8)#3,026 |
| 42. | Ocosta | 22.2% | 8.7%(+13.5)#42 | 9.8%(+12.4)#3,130 |
| 43. | May Creek | 21.6% | 8.7%(+12.8)#43 | 9.8%(+11.8)#3,301 |
| 44. | Ione | 21.5% | 8.7%(+12.8)#44 | 9.8%(+11.7)#3,323 |
| 45. | Westport | 21.2% | 8.7%(+12.5)#45 | 9.8%(+11.4)#3,422 |
| 46. | Selah | 21.0% | 8.7%(+12.2)#46 | 9.8%(+11.2)#3,488 |
| 47. | Mckenna | 20.8% | 8.7%(+12.1)#47 | 9.8%(+11.1)#3,529 |
| 48. | Klickitat | 20.8% | 8.7%(+12.1)#48 | 9.8%(+11.1)#3,535 |
| 49. | Wauna | 20.5% | 8.7%(+11.7)#49 | 9.8%(+10.7)#3,667 |
| 50. | Clear Lake Cdp Pierce County | 20.4% | 8.7%(+11.6)#50 | 9.8%(+10.6)#3,689 |
| 51. | Spangle | 20.3% | 8.7%(+11.6)#51 | 9.8%(+10.6)#3,696 |
| 52. | Lexington | 20.2% | 8.7%(+11.4)#52 | 9.8%(+10.4)#3,747 |
| 53. | North Bonneville | 20.0% | 8.7%(+11.3)#53 | 9.8%(+10.2)#3,791 |
| 54. | Roy | 19.8% | 8.7%(+11.1)#54 | 9.8%(+10.0)#3,934 |
| 55. | Glacier | 19.8% | 8.7%(+11.0)#55 | 9.8%(+9.97)#3,956 |
| 56. | Swede Heaven | 19.6% | 8.7%(+10.8)#56 | 9.8%(+9.77)#4,015 |
| 57. | Otis Orchards East Farms | 19.2% | 8.7%(+10.4)#57 | 9.8%(+9.39)#4,161 |
| 58. | Benton City | 19.1% | 8.7%(+10.3)#58 | 9.8%(+9.29)#4,188 |
| 59. | Central Park | 19.1% | 8.7%(+10.3)#59 | 9.8%(+9.27)#4,193 |
| 60. | Walla Walla East | 19.0% | 8.7%(+10.2)#60 | 9.8%(+9.17)#4,241 |
| 61. | Whidbey Island Station | 18.9% | 8.7%(+10.1)#61 | 9.8%(+9.11)#4,275 |
| 62. | Concrete | 18.9% | 8.7%(+10.1)#62 | 9.8%(+9.09)#4,285 |
| 63. | Bryn Mawr Skyway | 18.5% | 8.7%(+9.78)#63 | 9.8%(+8.74)#4,452 |
| 64. | Crocker | 18.1% | 8.7%(+9.40)#64 | 9.8%(+8.36)#4,653 |
| 65. | Liberty Lake | 18.0% | 8.7%(+9.27)#65 | 9.8%(+8.23)#4,693 |
| 66. | Longbranch | 17.9% | 8.7%(+9.18)#66 | 9.8%(+8.14)#4,740 |
| 67. | Longview Heights | 17.5% | 8.7%(+8.72)#67 | 9.8%(+7.68)#4,972 |
| 68. | Burbank | 17.2% | 8.7%(+8.48)#68 | 9.8%(+7.44)#5,093 |
| 69. | Clarkston | 17.1% | 8.7%(+8.37)#69 | 9.8%(+7.32)#5,150 |
| 70. | Centralia | 17.0% | 8.7%(+8.30)#70 | 9.8%(+7.25)#5,203 |
| 71. | Othello | 17.0% | 8.7%(+8.28)#71 | 9.8%(+7.24)#5,215 |
| 72. | Minnehaha | 17.0% | 8.7%(+8.25)#72 | 9.8%(+7.21)#5,226 |
| 73. | Nooksack | 17.0% | 8.7%(+8.23)#73 | 9.8%(+7.19)#5,237 |
| 74. | Ahtanum | 16.9% | 8.7%(+8.20)#74 | 9.8%(+7.15)#5,252 |
| 75. | Boulevard Park | 16.9% | 8.7%(+8.15)#75 | 9.8%(+7.11)#5,276 |
| 76. | Naselle | 16.9% | 8.7%(+8.14)#76 | 9.8%(+7.10)#5,280 |
| 77. | Shelton | 16.7% | 8.7%(+7.96)#77 | 9.8%(+6.92)#5,353 |
| 78. | Skokomish | 16.7% | 8.7%(+7.93)#78 | 9.8%(+6.89)#5,386 |
| 79. | North Fort Lewis | 16.5% | 8.7%(+7.76)#79 | 9.8%(+6.72)#5,557 |
| 80. | Cathlamet | 16.4% | 8.7%(+7.62)#80 | 9.8%(+6.58)#5,629 |
| 81. | Parkland | 16.3% | 8.7%(+7.60)#81 | 9.8%(+6.56)#5,643 |
| 82. | Prosser | 16.2% | 8.7%(+7.46)#82 | 9.8%(+6.42)#5,729 |
| 83. | Pasco | 16.1% | 8.7%(+7.39)#83 | 9.8%(+6.34)#5,782 |
| 84. | College Place | 16.1% | 8.7%(+7.36)#84 | 9.8%(+6.32)#5,796 |
| 85. | Port Orchard | 15.9% | 8.7%(+7.20)#85 | 9.8%(+6.16)#5,889 |
| 86. | Mesa | 15.8% | 8.7%(+7.05)#86 | 9.8%(+6.01)#5,996 |
| 87. | Goldendale | 15.7% | 8.7%(+6.99)#87 | 9.8%(+5.95)#6,044 |
| 88. | Summitview | 15.7% | 8.7%(+6.96)#88 | 9.8%(+5.92)#6,063 |
| 89. | Venersborg | 15.6% | 8.7%(+6.86)#89 | 9.8%(+5.82)#6,127 |
| 90. | Coulee Dam | 15.5% | 8.7%(+6.72)#90 | 9.8%(+5.68)#6,224 |
| 91. | Washtucna | 15.4% | 8.7%(+6.64)#91 | 9.8%(+5.60)#6,309 |
| 92. | Ocean City | 15.4% | 8.7%(+6.64)#92 | 9.8%(+5.60)#6,319 |
| 93. | Purdy | 15.3% | 8.7%(+6.54)#93 | 9.8%(+5.50)#6,379 |
| 94. | Cherry Grove | 15.2% | 8.7%(+6.41)#94 | 9.8%(+5.37)#6,482 |
| 95. | Terrace Heights | 15.1% | 8.7%(+6.35)#95 | 9.8%(+5.31)#6,528 |
| 96. | Chewelah | 15.0% | 8.7%(+6.27)#96 | 9.8%(+5.23)#6,580 |
| 97. | Stanwood | 15.0% | 8.7%(+6.25)#97 | 9.8%(+5.21)#6,620 |
| 98. | Lake Morton Berrydale | 14.9% | 8.7%(+6.21)#98 | 9.8%(+5.17)#6,650 |
| 99. | Gold Bar | 14.9% | 8.7%(+6.19)#99 | 9.8%(+5.15)#6,662 |
| 100. | Waterville | 14.9% | 8.7%(+6.12)#100 | 9.8%(+5.08)#6,708 |
Common Questions
What are the Top 10 Cities with the Highest Percentage of Population with a Degree in Science and Engineering in Washington?
Top 10 Cities with the Highest Percentage of Population with a Degree in Science and Engineering in Washington are:
#1
100.0%
#2
100.0%
#3
95.5%
#4
60.0%
#5
55.6%
#6
50.0%
#7
50.0%
#8
46.3%
#9
45.0%
#10
41.2%
What city has the Highest Percentage of Population with a Degree in Science and Engineering in Washington?
White Swan has the Highest Percentage of Population with a Degree in Science and Engineering in Washington with 100.0%.
What is the Percentage of Population with a Degree in Science and Engineering in the State of Washington?
Percentage of Population with a Degree in Science and Engineering in Washington is 8.7%.
What is the Percentage of Population with a Degree in Science and Engineering in the United States?
Percentage of Population with a Degree in Science and Engineering in the United States is 9.8%.