Cities with the Most Immigrants from Poland in Washington
RELATED REPORTS & OPTIONS
Poland
Washington
Compare Cities
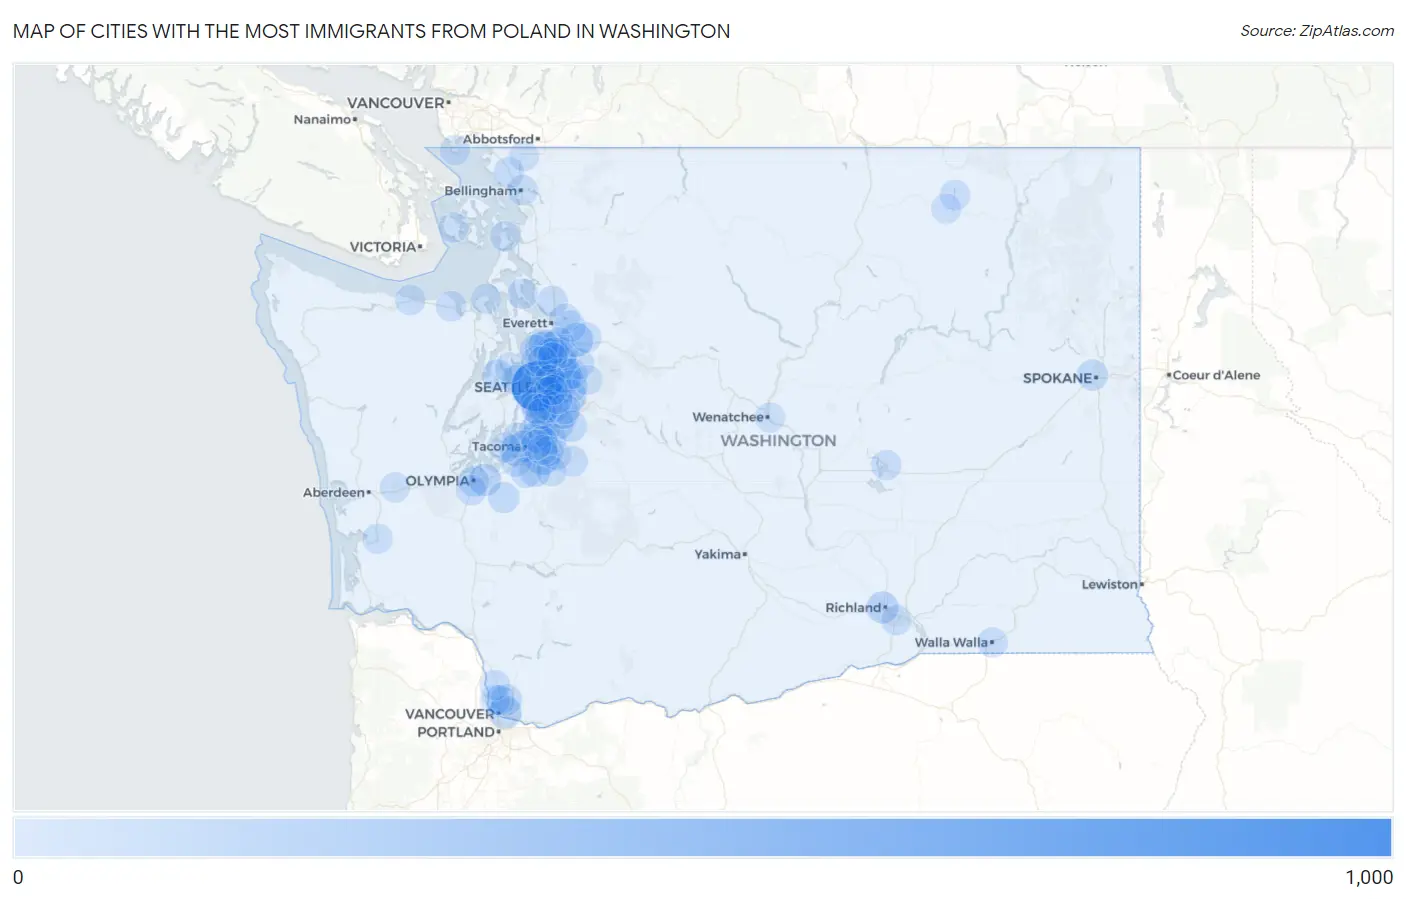
Map of Cities with the Most Immigrants from Poland in Washington
0
1,000
Cities with the Most Immigrants from Poland in Washington
| City | Poland | vs State | vs National | |
| 1. | Seattle | 865 | 4,963(17.43%)#1 | 408,899(0.21%)#56 |
| 2. | Woodinville | 227 | 4,963(4.57%)#2 | 408,899(0.06%)#221 |
| 3. | Redmond | 220 | 4,963(4.43%)#3 | 408,899(0.05%)#230 |
| 4. | Puyallup | 199 | 4,963(4.01%)#4 | 408,899(0.05%)#256 |
| 5. | Monroe North | 154 | 4,963(3.10%)#5 | 408,899(0.04%)#323 |
| 6. | Bellevue | 149 | 4,963(3.00%)#6 | 408,899(0.04%)#331 |
| 7. | Issaquah | 130 | 4,963(2.62%)#7 | 408,899(0.03%)#399 |
| 8. | Vancouver | 126 | 4,963(2.54%)#8 | 408,899(0.03%)#415 |
| 9. | Des Moines | 116 | 4,963(2.34%)#9 | 408,899(0.03%)#454 |
| 10. | Lynnwood | 107 | 4,963(2.16%)#10 | 408,899(0.03%)#495 |
| 11. | Kent | 104 | 4,963(2.10%)#11 | 408,899(0.03%)#504 |
| 12. | Fircrest | 101 | 4,963(2.04%)#12 | 408,899(0.02%)#533 |
| 13. | Kirkland | 97 | 4,963(1.95%)#13 | 408,899(0.02%)#549 |
| 14. | Lacey | 90 | 4,963(1.81%)#14 | 408,899(0.02%)#592 |
| 15. | White Center | 90 | 4,963(1.81%)#15 | 408,899(0.02%)#596 |
| 16. | Richland | 87 | 4,963(1.75%)#16 | 408,899(0.02%)#609 |
| 17. | Federal Way | 84 | 4,963(1.69%)#17 | 408,899(0.02%)#638 |
| 18. | Mill Creek East | 80 | 4,963(1.61%)#18 | 408,899(0.02%)#662 |
| 19. | Sammamish | 75 | 4,963(1.51%)#19 | 408,899(0.02%)#705 |
| 20. | Mercer Island | 60 | 4,963(1.21%)#20 | 408,899(0.01%)#836 |
| 21. | Maple Valley | 55 | 4,963(1.11%)#21 | 408,899(0.01%)#894 |
| 22. | Martha Lake | 55 | 4,963(1.11%)#22 | 408,899(0.01%)#896 |
| 23. | Frederickson | 53 | 4,963(1.07%)#23 | 408,899(0.01%)#920 |
| 24. | Silverdale | 53 | 4,963(1.07%)#24 | 408,899(0.01%)#921 |
| 25. | Barberton | 53 | 4,963(1.07%)#25 | 408,899(0.01%)#931 |
| 26. | Spokane | 48 | 4,963(0.97%)#26 | 408,899(0.01%)#998 |
| 27. | Tacoma | 48 | 4,963(0.97%)#27 | 408,899(0.01%)#999 |
| 28. | Everett | 48 | 4,963(0.97%)#28 | 408,899(0.01%)#1,000 |
| 29. | Lakeland North | 46 | 4,963(0.93%)#29 | 408,899(0.01%)#1,040 |
| 30. | Yelm | 45 | 4,963(0.91%)#30 | 408,899(0.01%)#1,056 |
| 31. | Duvall | 41 | 4,963(0.83%)#31 | 408,899(0.01%)#1,142 |
| 32. | Olympia | 37 | 4,963(0.75%)#32 | 408,899(0.01%)#1,224 |
| 33. | Auburn | 36 | 4,963(0.73%)#33 | 408,899(0.01%)#1,235 |
| 34. | Buckley | 32 | 4,963(0.64%)#34 | 408,899(0.01%)#1,360 |
| 35. | Lakewood | 31 | 4,963(0.62%)#35 | 408,899(0.01%)#1,366 |
| 36. | Bothell West | 30 | 4,963(0.60%)#36 | 408,899(0.01%)#1,412 |
| 37. | Marysville | 29 | 4,963(0.58%)#37 | 408,899(0.01%)#1,424 |
| 38. | Maltby | 28 | 4,963(0.56%)#38 | 408,899(0.01%)#1,473 |
| 39. | Renton | 26 | 4,963(0.52%)#39 | 408,899(0.01%)#1,522 |
| 40. | Ferndale | 26 | 4,963(0.52%)#40 | 408,899(0.01%)#1,540 |
| 41. | Maple Heights Lake Desire | 26 | 4,963(0.52%)#41 | 408,899(0.01%)#1,554 |
| 42. | Bryn Mawr Skyway | 25 | 4,963(0.50%)#42 | 408,899(0.01%)#1,580 |
| 43. | Edmonds | 23 | 4,963(0.46%)#43 | 408,899(0.01%)#1,649 |
| 44. | Kennewick | 21 | 4,963(0.42%)#44 | 408,899(0.01%)#1,743 |
| 45. | Lake Stevens | 21 | 4,963(0.42%)#45 | 408,899(0.01%)#1,752 |
| 46. | Tukwila | 20 | 4,963(0.40%)#46 | 408,899(0.00%)#1,809 |
| 47. | Bellingham | 18 | 4,963(0.36%)#47 | 408,899(0.00%)#1,894 |
| 48. | Seatac | 18 | 4,963(0.36%)#48 | 408,899(0.00%)#1,902 |
| 49. | Silver Firs | 18 | 4,963(0.36%)#49 | 408,899(0.00%)#1,909 |
| 50. | Spanaway | 17 | 4,963(0.34%)#50 | 408,899(0.00%)#1,954 |
| 51. | Port Angeles | 17 | 4,963(0.34%)#51 | 408,899(0.00%)#1,966 |
| 52. | Camano | 17 | 4,963(0.34%)#52 | 408,899(0.00%)#1,969 |
| 53. | East Renton Highlands | 17 | 4,963(0.34%)#53 | 408,899(0.00%)#1,980 |
| 54. | Bothell East | 16 | 4,963(0.32%)#54 | 408,899(0.00%)#2,030 |
| 55. | Lakeland South | 16 | 4,963(0.32%)#55 | 408,899(0.00%)#2,034 |
| 56. | Tumwater | 15 | 4,963(0.30%)#56 | 408,899(0.00%)#2,096 |
| 57. | Moses Lake | 15 | 4,963(0.30%)#57 | 408,899(0.00%)#2,097 |
| 58. | Union Hill Novelty Hill | 15 | 4,963(0.30%)#58 | 408,899(0.00%)#2,100 |
| 59. | Bonney Lake | 15 | 4,963(0.30%)#59 | 408,899(0.00%)#2,102 |
| 60. | Shoreline | 14 | 4,963(0.28%)#60 | 408,899(0.00%)#2,145 |
| 61. | Bainbridge Island | 14 | 4,963(0.28%)#61 | 408,899(0.00%)#2,157 |
| 62. | North Lynnwood | 14 | 4,963(0.28%)#62 | 408,899(0.00%)#2,158 |
| 63. | Newcastle | 14 | 4,963(0.28%)#63 | 408,899(0.00%)#2,166 |
| 64. | Sequim | 13 | 4,963(0.26%)#64 | 408,899(0.00%)#2,248 |
| 65. | Felida | 11 | 4,963(0.22%)#65 | 408,899(0.00%)#2,367 |
| 66. | Woods Creek | 11 | 4,963(0.22%)#66 | 408,899(0.00%)#2,380 |
| 67. | Raymond | 11 | 4,963(0.22%)#67 | 408,899(0.00%)#2,399 |
| 68. | Sumner | 10 | 4,963(0.20%)#68 | 408,899(0.00%)#2,465 |
| 69. | Curlew Lake | 10 | 4,963(0.20%)#69 | 408,899(0.00%)#2,510 |
| 70. | Ridgefield | 9 | 4,963(0.18%)#70 | 408,899(0.00%)#2,552 |
| 71. | Orting | 9 | 4,963(0.18%)#71 | 408,899(0.00%)#2,565 |
| 72. | Walla Walla | 8 | 4,963(0.16%)#72 | 408,899(0.00%)#2,632 |
| 73. | Ruston | 8 | 4,963(0.16%)#73 | 408,899(0.00%)#2,704 |
| 74. | Burien | 7 | 4,963(0.14%)#74 | 408,899(0.00%)#2,720 |
| 75. | Fox Island | 7 | 4,963(0.14%)#75 | 408,899(0.00%)#2,761 |
| 76. | Montesano | 6 | 4,963(0.12%)#76 | 408,899(0.00%)#2,832 |
| 77. | Salmon Creek | 5 | 4,963(0.10%)#77 | 408,899(0.00%)#2,896 |
| 78. | Lynden | 5 | 4,963(0.10%)#78 | 408,899(0.00%)#2,902 |
| 79. | East Wenatchee | 5 | 4,963(0.10%)#79 | 408,899(0.00%)#2,905 |
| 80. | Lake Forest Park | 5 | 4,963(0.10%)#80 | 408,899(0.00%)#2,907 |
| 81. | Point Roberts | 5 | 4,963(0.10%)#81 | 408,899(0.00%)#2,966 |
| 82. | Republic | 5 | 4,963(0.10%)#82 | 408,899(0.00%)#2,971 |
| 83. | Bothell | 4 | 4,963(0.08%)#83 | 408,899(0.00%)#2,990 |
| 84. | Edgewood | 4 | 4,963(0.08%)#84 | 408,899(0.00%)#3,000 |
| 85. | Carnation | 4 | 4,963(0.08%)#85 | 408,899(0.00%)#3,020 |
| 86. | Fife Heights | 4 | 4,963(0.08%)#86 | 408,899(0.00%)#3,035 |
| 87. | Anacortes | 3 | 4,963(0.06%)#87 | 408,899(0.00%)#3,076 |
| 88. | Port Townsend | 3 | 4,963(0.06%)#88 | 408,899(0.00%)#3,086 |
| 89. | Suquamish | 2 | 4,963(0.04%)#89 | 408,899(0.00%)#3,156 |
| 90. | Friday Harbor | 2 | 4,963(0.04%)#90 | 408,899(0.00%)#3,163 |
| 91. | Yarrow Point | 1 | 4,963(0.02%)#91 | 408,899(0.00%)#3,269 |
| 92. | Beaux Arts Village | 1 | 4,963(0.02%)#92 | 408,899(0.00%)#3,293 |
Common Questions
What are the Top 10 Cities with the Most Immigrants from Poland in Washington?
Top 10 Cities with the Most Immigrants from Poland in Washington are:
#1
865
#2
227
#3
220
#4
199
#5
154
#6
149
#7
130
#8
126
#9
116
#10
107
What city has the Most Immigrants from Poland in Washington?
Seattle has the Most Immigrants from Poland in Washington with 865.
What is the Total Immigrants from Poland in the State of Washington?
Total Immigrants from Poland in Washington is 4,963.
What is the Total Immigrants from Poland in the United States?
Total Immigrants from Poland in the United States is 408,899.