Cities with the Highest Percentage of Palestinian Population in Washington

RELATED REPORTS & OPTIONS

Palestinian
Population
Families and Households
Female Fertility
Female Fertility (Unmarried)
Race (Community Size)
Race (Percentage)
Ancestry (Community Size)
AfghanAfricanAlaska NativeAlaskan AthabascanAlbanianAleutAlsatianAmericanApacheArabArapahoArgentineanArmenianAssyrian / Chaldean / SyriacAustralianAustrianBahamianBangladeshiBarbadianBasqueBelgianBelizeanBermudanBhutaneseBlackfeetBolivianBrazilianBritishBritish West IndianBulgarianBurmeseCajunCambodianCanadianCape VerdeanCarpatho RusynCelticCentral AmericanCentral American IndianCherokeeCheyenneChickasawChileanChineseChippewaChoctawColombianColvilleComancheCosta RicanCreeCreekCroatianCrowCubanCypriotCzechCzechoslovakianDanishDelawareDominicanDutchDutch West IndianEastern EuropeanEcuadorianEgyptianEnglishEstonianEthiopianEuropeanFijianFilipinoFinnishFrenchFrench American IndianFrench CanadianGermanGerman RussianGhanaianGreekGuamanian / ChamorroGuatemalanGuyaneseHaitianHmongHonduranHopiHoumaHungarianIcelanderIndian (Asian)IndonesianInupiatIranianIraqiIrishIroquoisIsraeliItalianJamaicanJapaneseJordanianKenyanKiowaKoreanLaotianLatvianLebaneseLiberianLithuanianLumbeeLuxembourgerMacedonianMalaysianMalteseMarshalleseMenomineeMexicanMexican American IndianMongolianMoroccanNative HawaiianNavajoNepaleseNew ZealanderNicaraguanNigerianNorthern EuropeanNorwegianOkinawanOsageOttawaPaiutePakistaniPalestinianPanamanianParaguayanPennsylvania GermanPeruvianPimaPolishPortuguesePotawatomiPuebloPuerto RicanPuget Sound SalishRomanianRussianSalvadoranSamoanScandinavianScotch-IrishScottishSeminoleSenegaleseSerbianShoshoneSierra LeoneanSiouxSlavicSlovakSloveneSomaliSouth AfricanSouth AmericanSouth American IndianSoviet UnionSpaniardSpanishSpanish AmericanSpanish American IndianSri LankanSubsaharan AfricanSudaneseSwedishSwissSyrianTaiwaneseThaiTlingit-HaidaTohono O'OdhamTonganTrinidadian and TobagonianTsimshianTurkishU.S. Virgin IslanderUgandanUkrainianUruguayanUteVenezuelanVietnameseWelshWest IndianYakamaYaquiYugoslavianYumanYup'ikZimbabwean
Ancestry (Percentage)
AfghanAfricanAlaska NativeAlaskan AthabascanAlbanianAleutAlsatianAmericanApacheArabArapahoArgentineanArmenianAssyrian / Chaldean / SyriacAustralianAustrianBahamianBangladeshiBarbadianBasqueBelgianBelizeanBermudanBhutaneseBlackfeetBolivianBrazilianBritishBritish West IndianBulgarianBurmeseCajunCambodianCanadianCape VerdeanCarpatho RusynCelticCentral AmericanCentral American IndianCherokeeCheyenneChickasawChileanChineseChippewaChoctawColombianColvilleComancheCosta RicanCreeCreekCroatianCrowCubanCypriotCzechCzechoslovakianDanishDelawareDominicanDutchDutch West IndianEastern EuropeanEcuadorianEgyptianEnglishEstonianEthiopianEuropeanFijianFilipinoFinnishFrenchFrench American IndianFrench CanadianGermanGerman RussianGhanaianGreekGuamanian / ChamorroGuatemalanGuyaneseHaitianHmongHonduranHopiHoumaHungarianIcelanderIndian (Asian)IndonesianInupiatIranianIraqiIrishIroquoisIsraeliItalianJamaicanJapaneseJordanianKenyanKiowaKoreanLaotianLatvianLebaneseLiberianLithuanianLumbeeLuxembourgerMacedonianMalaysianMalteseMarshalleseMenomineeMexicanMexican American IndianMongolianMoroccanNative HawaiianNavajoNepaleseNew ZealanderNicaraguanNigerianNorthern EuropeanNorwegianOkinawanOsageOttawaPaiutePakistaniPalestinianPanamanianParaguayanPennsylvania GermanPeruvianPimaPolishPortuguesePotawatomiPuebloPuerto RicanPuget Sound SalishRomanianRussianSalvadoranSamoanScandinavianScotch-IrishScottishSeminoleSenegaleseSerbianShoshoneSierra LeoneanSiouxSlavicSlovakSloveneSomaliSouth AfricanSouth AmericanSouth American IndianSoviet UnionSpaniardSpanishSpanish AmericanSpanish American IndianSri LankanSubsaharan AfricanSudaneseSwedishSwissSyrianTaiwaneseThaiTlingit-HaidaTohono O'OdhamTonganTrinidadian and TobagonianTsimshianTurkishU.S. Virgin IslanderUgandanUkrainianUruguayanUteVenezuelanVietnameseWelshWest IndianYakamaYaquiYugoslavianYumanYup'ikZimbabwean
Immigrant Origin (Total)
AfghanistanAfricaAlbaniaArgentinaArmeniaAsiaAustraliaAustriaAzoresBahamasBangladeshBarbadosBelarusBelgiumBelizeBoliviaBosnia and HerzegovinaBrazilBulgariaBurma / MyanmarCabo VerdeCambodiaCameroonCanadaCaribbeanCentral AmericaChileChinaColombiaCongoCosta RicaCroatiaCubaCzechoslovakiaDenmarkDominicaDominican RepublicEastern AfricaEastern AsiaEastern EuropeEcuadorEgyptEl SalvadorEnglandEritreaEthiopiaEuropeFijiFranceGermanyGhanaGreeceGrenadaGuatemalaGuyanaHaitiHondurasHong KongHungaryIndiaIndonesiaIranIraqIrelandIsraelItalyJamaicaJapanJordanKazakhstanKenyaKoreaKuwaitLaosLatin AmericaLatviaLebanonLiberiaLithuaniaMalaysiaMexicoMicronesiaMiddle AfricaMoldovaMoroccoNepalNetherlandsNicaraguaNigeriaNorth MacedoniaNorthern AfricaNorthern EuropeNorwayOceaniaPakistanPanamaPeruPhilippinesPolandPortugalRomaniaRussiaSaudi ArabiaScotlandSenegalSerbiaSierra LeoneSingaporeSomaliaSouth AfricaSouth AmericaSouth Central AsiaSouth Eastern AsiaSouthern EuropeSpainSri LankaSt. Vincent and the GrenadinesSudanSwedenSwitzerlandSyriaTaiwanThailandTrinidad and TobagoTurkeyUgandaUkraineUruguayUzbekistanVenezuelaVietnamWest IndiesWestern AfricaWestern AsiaWestern EuropeYemenZaireZimbabwe
Immigrant Origin (Percentage)
AfghanistanAfricaAlbaniaArgentinaArmeniaAsiaAustraliaAustriaAzoresBahamasBangladeshBarbadosBelarusBelgiumBelizeBoliviaBosnia and HerzegovinaBrazilBulgariaBurma / MyanmarCabo VerdeCambodiaCameroonCanadaCaribbeanCentral AmericaChileChinaColombiaCongoCosta RicaCroatiaCubaCzechoslovakiaDenmarkDominicaDominican RepublicEastern AfricaEastern AsiaEastern EuropeEcuadorEgyptEl SalvadorEnglandEritreaEthiopiaEuropeFijiFranceGermanyGhanaGreeceGrenadaGuatemalaGuyanaHaitiHondurasHong KongHungaryIndiaIndonesiaIranIraqIrelandIsraelItalyJamaicaJapanJordanKazakhstanKenyaKoreaKuwaitLaosLatin AmericaLatviaLebanonLiberiaLithuaniaMalaysiaMexicoMicronesiaMiddle AfricaMoldovaMoroccoNepalNetherlandsNicaraguaNigeriaNorth MacedoniaNorthern AfricaNorthern EuropeNorwayOceaniaPakistanPanamaPeruPhilippinesPolandPortugalRomaniaRussiaSaudi ArabiaScotlandSenegalSerbiaSierra LeoneSingaporeSomaliaSouth AfricaSouth AmericaSouth Central AsiaSouth Eastern AsiaSouthern EuropeSpainSri LankaSt. Vincent and the GrenadinesSudanSwedenSwitzerlandSyriaTaiwanThailandTrinidad and TobagoTurkeyUgandaUkraineUruguayUzbekistanVenezuelaVietnamWest IndiesWestern AfricaWestern AsiaWestern EuropeYemenZaireZimbabwe
Income
Income (Families)
Income (Households)
Poverty
Poverty (Families)
Unemployment
Employment Occupations
Employment Industries
Employer Class
Commute Time
Commute Means
School Enrollment
Education by Degree Field
Occupancy
Finances
Physical Characteristics
Washington
Compare Cities
Comparison Subject

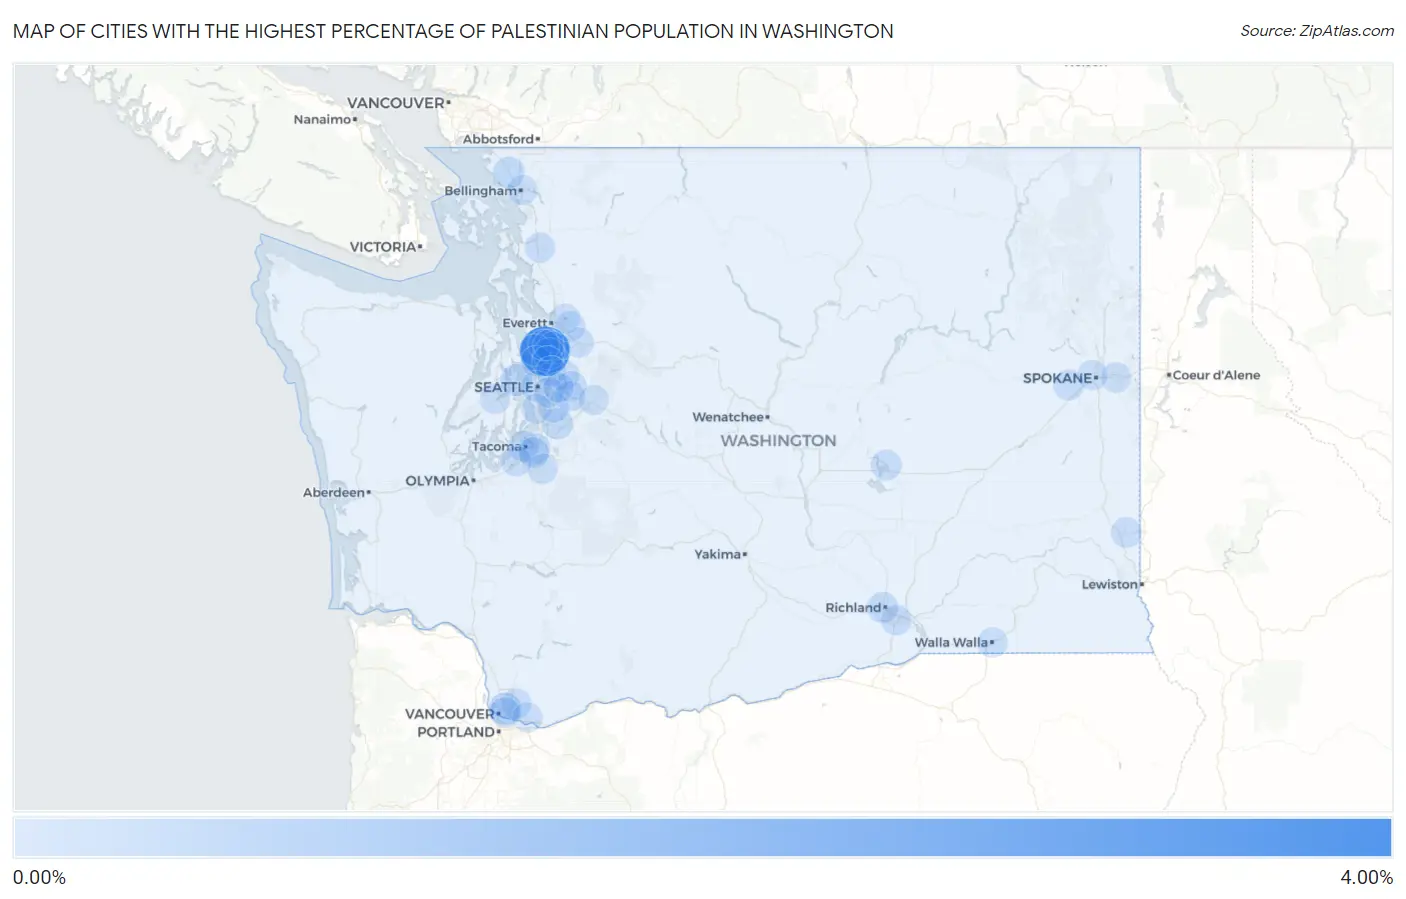
Map of Cities with the Highest Percentage of Palestinian Population in Washington

0.00%
4.00%
Cities with the Highest Percentage of Palestinian Population in Washington Map

Cities with the Highest Percentage of Palestinian Population in Washington

City Palestinian vs State vs National
1.Alderwood Manor3.18%0.033%(+3.15)#10.046%(+3.14)#25
2.Minnehaha0.33%0.033%(+0.295)#20.046%(+0.282)#318
3.Mill Creek East0.29%0.033%(+0.255)#30.046%(+0.242)#364
4.Bainbridge Island0.25%0.033%(+0.218)#40.046%(+0.205)#418
5.Edmonds0.24%0.033%(+0.210)#50.046%(+0.197)#435
6.Ferndale0.21%0.033%(+0.178)#60.046%(+0.165)#481
7.Bothell West0.18%0.033%(+0.147)#70.046%(+0.134)#535
8.Kent0.15%0.033%(+0.117)#80.046%(+0.104)#598
9.Fife0.15%0.033%(+0.113)#90.046%(+0.101)#607
10.Richland0.14%0.033%(+0.105)#100.046%(+0.092)#629
11.Tacoma0.13%0.033%(+0.098)#110.046%(+0.086)#655
12.Redmond0.13%0.033%(+0.094)#120.046%(+0.081)#669
13.Fairchild Afb0.13%0.033%(+0.092)#130.046%(+0.080)#677
14.Moses Lake0.095%0.033%(+0.062)#140.046%(+0.049)#776
15.Waller0.088%0.033%(+0.054)#150.046%(+0.042)#811
16.Kennewick0.082%0.033%(+0.049)#160.046%(+0.036)#837
17.Pullman0.072%0.033%(+0.038)#170.046%(+0.026)#898
18.Shoreline0.070%0.033%(+0.036)#180.046%(+0.024)#912
19.North Lynnwood0.066%0.033%(+0.033)#190.046%(+0.020)#934
20.Martha Lake0.064%0.033%(+0.031)#200.046%(+0.018)#945
21.Seattle0.059%0.033%(+0.025)#210.046%(+0.013)#985
22.Sammamish0.057%0.033%(+0.024)#220.046%(+0.011)#1,002
23.Orchards0.051%0.033%(+0.018)#230.046%(+0.005)#1,042
24.Bremerton0.050%0.033%(+0.017)#240.046%(+0.004)#1,053
25.Mount Vernon0.048%0.033%(+0.015)#250.046%(+0.002)#1,068
26.Lakewood0.048%0.033%(+0.014)#260.046%(+0.001)#1,073
27.Renton0.047%0.033%(+0.013)#270.046%(+0.000)#1,084
28.Issaquah0.043%0.033%(+0.010)#280.046%(-0.003)#1,118
29.Vancouver0.040%0.033%(+0.006)#290.046%(-0.006)#1,150
30.Everett0.037%0.033%(+0.004)#300.046%(-0.009)#1,171
31.Kenmore0.034%0.033%(+0.000)#310.046%(-0.012)#1,202
32.Lake Stevens0.033%0.033%(+0.000)#320.046%(-0.013)#1,209
33.Kirkland0.033%0.033%(-0.001)#330.046%(-0.013)#1,218
34.Mercer Island0.027%0.033%(-0.006)#340.046%(-0.019)#1,272
35.Walla Walla0.027%0.033%(-0.007)#350.046%(-0.019)#1,279
36.Camas0.027%0.033%(-0.007)#360.046%(-0.020)#1,281
37.Monroe0.025%0.033%(-0.008)#370.046%(-0.021)#1,294
38.Burien0.025%0.033%(-0.008)#380.046%(-0.021)#1,295
39.Spokane Valley0.021%0.033%(-0.012)#390.046%(-0.025)#1,331
40.Snoqualmie0.015%0.033%(-0.019)#400.046%(-0.032)#1,401
41.South Hill0.012%0.033%(-0.022)#410.046%(-0.034)#1,432
42.Spokane0.011%0.033%(-0.022)#420.046%(-0.035)#1,441
43.Bellevue0.0093%0.033%(-0.024)#430.046%(-0.037)#1,463
44.Bellingham0.0088%0.033%(-0.025)#440.046%(-0.037)#1,466

Common Questions

What are the Top 10 Cities with the Highest Percentage of Palestinian Population in Washington?
Top 10 Cities with the Highest Percentage of Palestinian Population in Washington are:
#1
3.18%
#2
0.33%
#3
0.29%
#4
0.25%
#5
0.24%
#6
0.21%
#7
0.18%
#8
0.15%
#9
0.15%
#10
0.14%
What city has the Highest Percentage of Palestinian Population in Washington?
Alderwood Manor has the Highest Percentage of Palestinian Population in Washington with 3.18%.
What is the Percentage of Palestinian Population in the State of Washington?
Percentage of Palestinian Population in Washington is 0.033%.
What is the Percentage of Palestinian Population in the United States?
Percentage of Palestinian Population in the United States is 0.046%.