Cities with the Highest Percentage of Immigrants from France in Washington
RELATED REPORTS & OPTIONS
France
Washington
Compare Cities
Map of Cities with the Highest Percentage of Immigrants from France in Washington
0.00%
2.00%
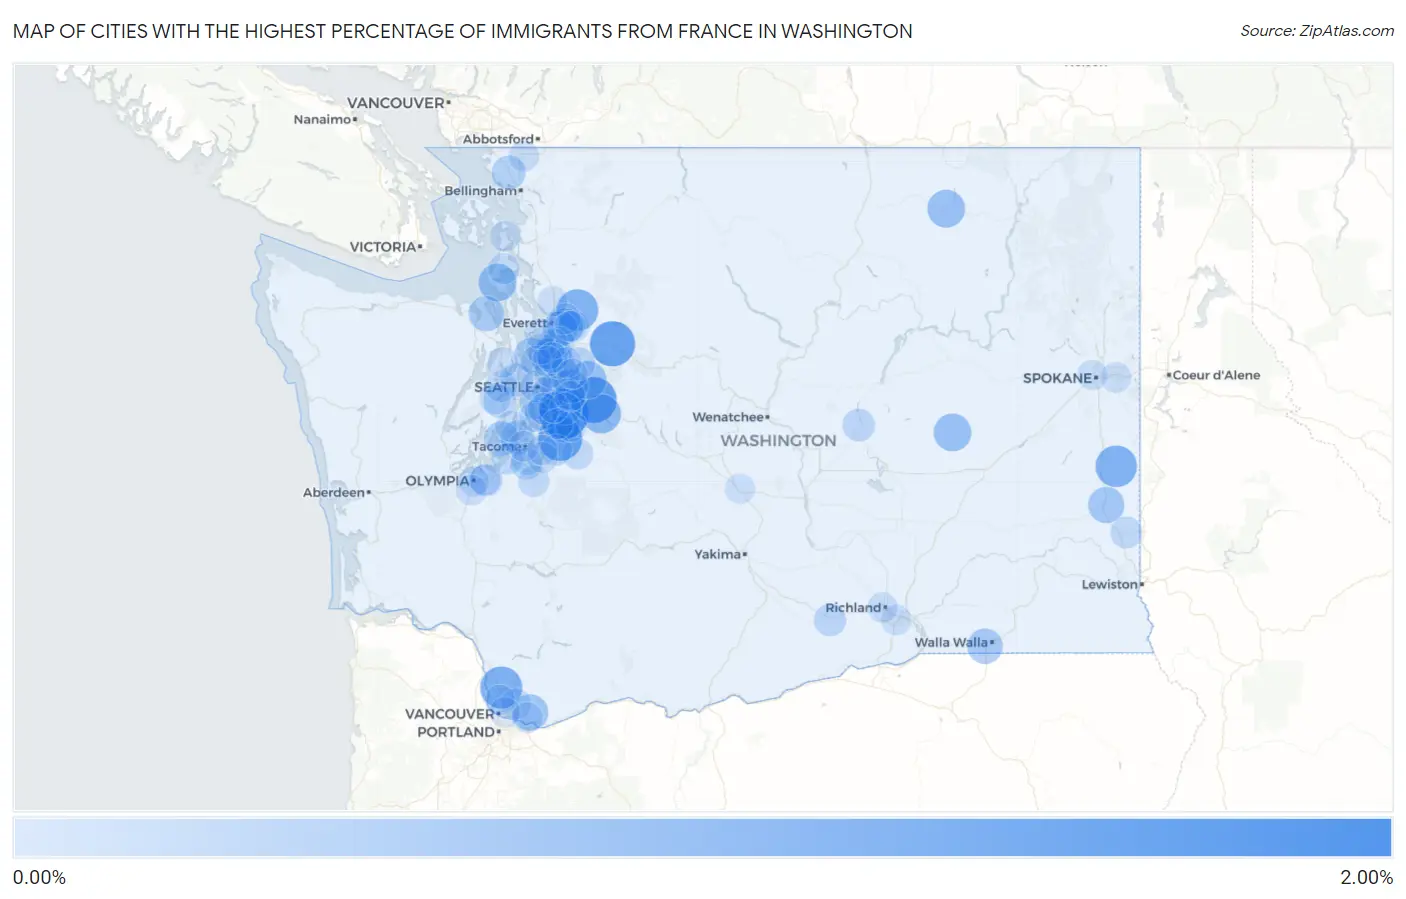
Cities with the Highest Percentage of Immigrants from France in Washington
| City | France | vs State | vs National | |
| 1. | Maple Heights Lake Desire | 1.63% | 0.064%(+1.57)#1 | 0.056%(+1.57)#60 |
| 2. | Snoqualmie | 1.32% | 0.064%(+1.25)#2 | 0.056%(+1.26)#95 |
| 3. | May Creek | 1.26% | 0.064%(+1.20)#3 | 0.056%(+1.20)#102 |
| 4. | Lake Holm | 1.18% | 0.064%(+1.11)#4 | 0.056%(+1.12)#113 |
| 5. | Duluth | 0.99% | 0.064%(+0.921)#5 | 0.056%(+0.930)#151 |
| 6. | Lake Bosworth | 0.94% | 0.064%(+0.880)#6 | 0.056%(+0.888)#158 |
| 7. | Oakesdale | 0.94% | 0.064%(+0.872)#7 | 0.056%(+0.881)#160 |
| 8. | Wilderness Rim | 0.75% | 0.064%(+0.683)#8 | 0.056%(+0.692)#222 |
| 9. | Coupeville | 0.64% | 0.064%(+0.573)#9 | 0.056%(+0.581)#279 |
| 10. | Carnation | 0.64% | 0.064%(+0.572)#10 | 0.056%(+0.580)#280 |
| 11. | Odessa | 0.63% | 0.064%(+0.562)#11 | 0.056%(+0.571)#284 |
| 12. | Republic | 0.63% | 0.064%(+0.561)#12 | 0.056%(+0.569)#286 |
| 13. | Fern Prairie | 0.51% | 0.064%(+0.449)#13 | 0.056%(+0.458)#361 |
| 14. | Colfax | 0.50% | 0.064%(+0.436)#14 | 0.056%(+0.444)#373 |
| 15. | Bunk Foss | 0.47% | 0.064%(+0.403)#15 | 0.056%(+0.411)#413 |
| 16. | Bothell East | 0.45% | 0.064%(+0.387)#16 | 0.056%(+0.396)#428 |
| 17. | Bellevue | 0.45% | 0.064%(+0.384)#17 | 0.056%(+0.392)#433 |
| 18. | College Place | 0.43% | 0.064%(+0.364)#18 | 0.056%(+0.373)#459 |
| 19. | Port Hadlock Irondale | 0.42% | 0.064%(+0.357)#19 | 0.056%(+0.365)#469 |
| 20. | Fobes Hill | 0.41% | 0.064%(+0.341)#20 | 0.056%(+0.350)#491 |
| 21. | Artondale | 0.36% | 0.064%(+0.296)#21 | 0.056%(+0.305)#562 |
| 22. | Woodway | 0.36% | 0.064%(+0.293)#22 | 0.056%(+0.302)#569 |
| 23. | Ruston | 0.31% | 0.064%(+0.251)#23 | 0.056%(+0.259)#633 |
| 24. | Ferndale | 0.30% | 0.064%(+0.240)#24 | 0.056%(+0.248)#659 |
| 25. | Sammamish | 0.29% | 0.064%(+0.227)#25 | 0.056%(+0.235)#687 |
| 26. | White Center | 0.28% | 0.064%(+0.213)#26 | 0.056%(+0.222)#716 |
| 27. | Mercer Island | 0.24% | 0.064%(+0.179)#27 | 0.056%(+0.188)#815 |
| 28. | Seatac | 0.24% | 0.064%(+0.172)#28 | 0.056%(+0.180)#833 |
| 29. | Bainbridge Island | 0.23% | 0.064%(+0.171)#29 | 0.056%(+0.179)#839 |
| 30. | Brier | 0.23% | 0.064%(+0.165)#30 | 0.056%(+0.174)#863 |
| 31. | Duvall | 0.22% | 0.064%(+0.157)#31 | 0.056%(+0.166)#886 |
| 32. | Port Orchard | 0.22% | 0.064%(+0.157)#32 | 0.056%(+0.165)#888 |
| 33. | Tanglewilde | 0.22% | 0.064%(+0.154)#33 | 0.056%(+0.163)#896 |
| 34. | Kirkland | 0.22% | 0.064%(+0.151)#34 | 0.056%(+0.159)#914 |
| 35. | Lakeview | 0.19% | 0.064%(+0.130)#35 | 0.056%(+0.139)#982 |
| 36. | Redmond | 0.19% | 0.064%(+0.125)#36 | 0.056%(+0.134)#1,006 |
| 37. | Prosser | 0.18% | 0.064%(+0.115)#37 | 0.056%(+0.123)#1,048 |
| 38. | Covington | 0.18% | 0.064%(+0.113)#38 | 0.056%(+0.122)#1,055 |
| 39. | Woodinville | 0.17% | 0.064%(+0.109)#39 | 0.056%(+0.117)#1,078 |
| 40. | East Renton Highlands | 0.15% | 0.064%(+0.085)#40 | 0.056%(+0.093)#1,183 |
| 41. | Seattle | 0.15% | 0.064%(+0.083)#41 | 0.056%(+0.091)#1,194 |
| 42. | Tracyton | 0.14% | 0.064%(+0.078)#42 | 0.056%(+0.087)#1,225 |
| 43. | Midland | 0.13% | 0.064%(+0.068)#43 | 0.056%(+0.076)#1,277 |
| 44. | Pullman | 0.13% | 0.064%(+0.067)#44 | 0.056%(+0.075)#1,283 |
| 45. | Steilacoom | 0.12% | 0.064%(+0.055)#45 | 0.056%(+0.064)#1,358 |
| 46. | Normandy Park | 0.12% | 0.064%(+0.055)#46 | 0.056%(+0.064)#1,363 |
| 47. | Parkland | 0.12% | 0.064%(+0.055)#47 | 0.056%(+0.063)#1,365 |
| 48. | Tukwila | 0.11% | 0.064%(+0.047)#48 | 0.056%(+0.055)#1,406 |
| 49. | Enumclaw | 0.11% | 0.064%(+0.046)#49 | 0.056%(+0.055)#1,411 |
| 50. | Snohomish | 0.11% | 0.064%(+0.044)#50 | 0.056%(+0.053)#1,429 |
| 51. | Silver Firs | 0.11% | 0.064%(+0.044)#51 | 0.056%(+0.052)#1,432 |
| 52. | Elk Plain | 0.098% | 0.064%(+0.034)#52 | 0.056%(+0.043)#1,498 |
| 53. | Bremerton | 0.091% | 0.064%(+0.027)#53 | 0.056%(+0.035)#1,552 |
| 54. | Maplewood | 0.091% | 0.064%(+0.026)#54 | 0.056%(+0.035)#1,555 |
| 55. | Lake Tapps | 0.090% | 0.064%(+0.026)#55 | 0.056%(+0.034)#1,558 |
| 56. | Oak Harbor | 0.082% | 0.064%(+0.017)#56 | 0.056%(+0.026)#1,626 |
| 57. | Bothell West | 0.078% | 0.064%(+0.014)#57 | 0.056%(+0.022)#1,652 |
| 58. | Maple Valley | 0.075% | 0.064%(+0.011)#58 | 0.056%(+0.019)#1,679 |
| 59. | Lake Stevens | 0.067% | 0.064%(+0.003)#59 | 0.056%(+0.011)#1,770 |
| 60. | Mill Creek | 0.063% | 0.064%(-0.002)#60 | 0.056%(+0.007)#1,830 |
| 61. | Lynden | 0.057% | 0.064%(-0.007)#61 | 0.056%(+0.001)#1,901 |
| 62. | Shoreline | 0.055% | 0.064%(-0.010)#62 | 0.056%(-0.001)#1,931 |
| 63. | Lynnwood | 0.053% | 0.064%(-0.012)#63 | 0.056%(-0.003)#1,952 |
| 64. | Mukilteo | 0.051% | 0.064%(-0.013)#64 | 0.056%(-0.004)#1,964 |
| 65. | Orchards | 0.051% | 0.064%(-0.013)#65 | 0.056%(-0.005)#1,965 |
| 66. | Kent | 0.050% | 0.064%(-0.014)#66 | 0.056%(-0.006)#1,979 |
| 67. | Lacey | 0.050% | 0.064%(-0.015)#67 | 0.056%(-0.006)#1,984 |
| 68. | Puyallup | 0.047% | 0.064%(-0.017)#68 | 0.056%(-0.009)#2,022 |
| 69. | Cottage Lake | 0.043% | 0.064%(-0.021)#69 | 0.056%(-0.013)#2,064 |
| 70. | Olympia | 0.040% | 0.064%(-0.025)#70 | 0.056%(-0.016)#2,102 |
| 71. | Tumwater | 0.039% | 0.064%(-0.025)#71 | 0.056%(-0.017)#2,112 |
| 72. | Renton | 0.038% | 0.064%(-0.026)#72 | 0.056%(-0.018)#2,126 |
| 73. | Camas | 0.034% | 0.064%(-0.030)#73 | 0.056%(-0.022)#2,183 |
| 74. | Kenmore | 0.034% | 0.064%(-0.031)#74 | 0.056%(-0.022)#2,186 |
| 75. | Poulsbo | 0.034% | 0.064%(-0.031)#75 | 0.056%(-0.022)#2,187 |
| 76. | Kennewick | 0.030% | 0.064%(-0.035)#76 | 0.056%(-0.026)#2,251 |
| 77. | Tacoma | 0.030% | 0.064%(-0.035)#77 | 0.056%(-0.026)#2,255 |
| 78. | Spokane Valley | 0.029% | 0.064%(-0.035)#78 | 0.056%(-0.027)#2,264 |
| 79. | Anacortes | 0.028% | 0.064%(-0.036)#79 | 0.056%(-0.028)#2,277 |
| 80. | Everett | 0.028% | 0.064%(-0.036)#80 | 0.056%(-0.028)#2,284 |
| 81. | Issaquah | 0.025% | 0.064%(-0.039)#81 | 0.056%(-0.030)#2,326 |
| 82. | Vancouver | 0.025% | 0.064%(-0.039)#82 | 0.056%(-0.031)#2,333 |
| 83. | Richland | 0.025% | 0.064%(-0.040)#83 | 0.056%(-0.031)#2,343 |
| 84. | Bothell | 0.021% | 0.064%(-0.044)#84 | 0.056%(-0.035)#2,422 |
| 85. | Salmon Creek | 0.020% | 0.064%(-0.045)#85 | 0.056%(-0.036)#2,438 |
| 86. | Edgewood | 0.016% | 0.064%(-0.048)#86 | 0.056%(-0.040)#2,495 |
| 87. | Spokane | 0.015% | 0.064%(-0.049)#87 | 0.056%(-0.041)#2,508 |
| 88. | Union Hill Novelty Hill | 0.013% | 0.064%(-0.051)#88 | 0.056%(-0.043)#2,548 |
| 89. | Ellensburg | 0.011% | 0.064%(-0.054)#89 | 0.056%(-0.045)#2,585 |
| 90. | Marysville | 0.0071% | 0.064%(-0.057)#90 | 0.056%(-0.049)#2,618 |
Common Questions
What are the Top 10 Cities with the Highest Percentage of Immigrants from France in Washington?
Top 10 Cities with the Highest Percentage of Immigrants from France in Washington are:
#1
1.63%
#2
1.32%
#3
1.26%
#4
1.18%
#5
0.99%
#6
0.94%
#7
0.94%
#8
0.75%
#9
0.64%
#10
0.64%
What city has the Highest Percentage of Immigrants from France in Washington?
Maple Heights Lake Desire has the Highest Percentage of Immigrants from France in Washington with 1.63%.
What is the Percentage of Immigrants from France in the State of Washington?
Percentage of Immigrants from France in Washington is 0.064%.
What is the Percentage of Immigrants from France in the United States?
Percentage of Immigrants from France in the United States is 0.056%.