Cities with the Largest Mexican Community in Washington
RELATED REPORTS & OPTIONS
Mexican
Washington
Compare Cities
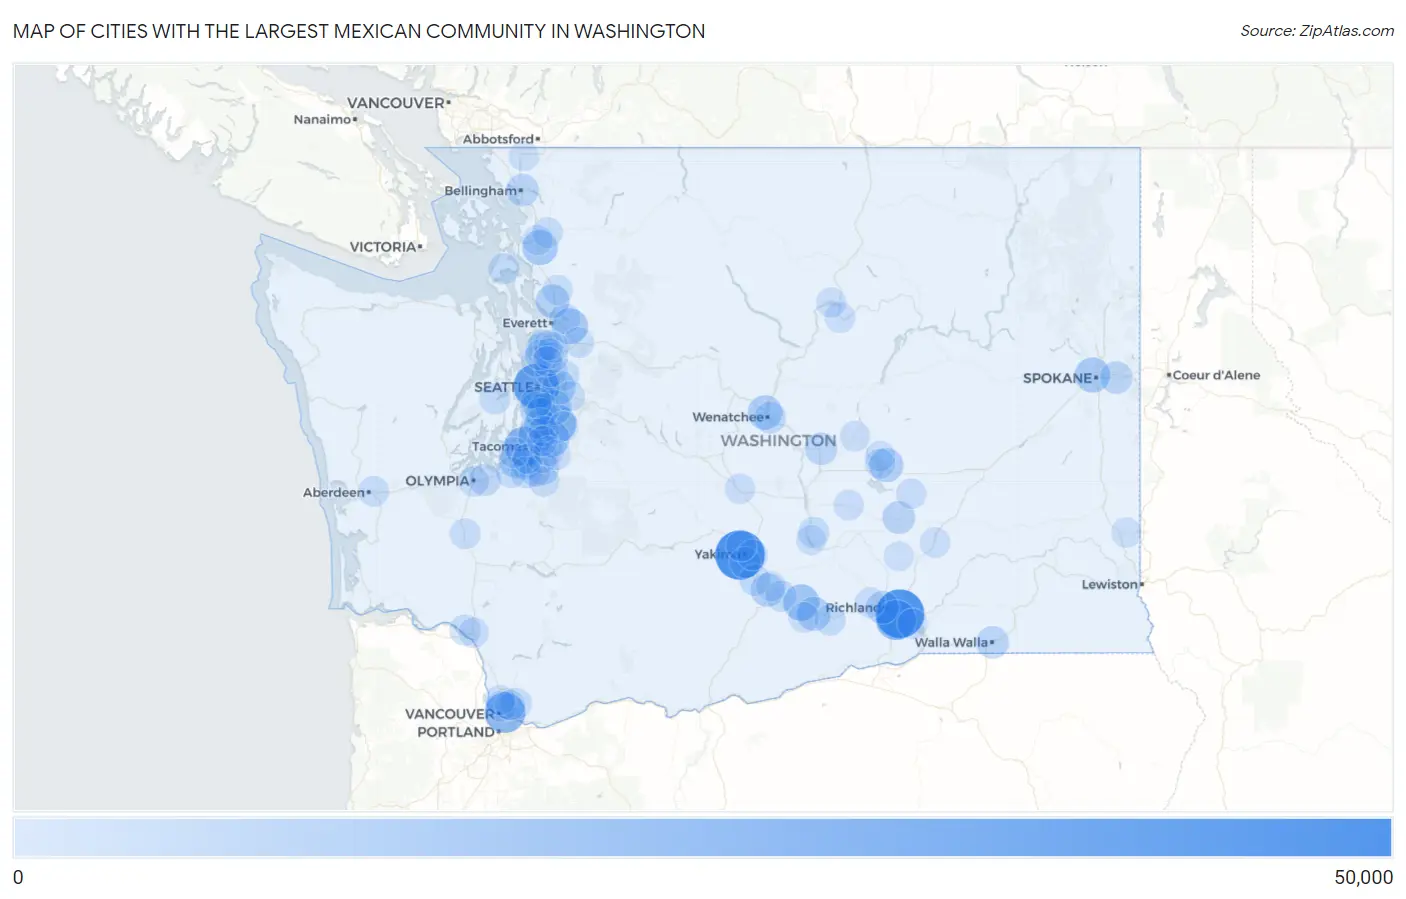
Map of Cities with the Largest Mexican Community in Washington
0
50,000
Cities with the Largest Mexican Community in Washington
| City | Mexican | vs State | vs National | |
| 1. | Yakima | 40,802 | 793,289(5.14%)#1 | 37,145,956(0.11%)#120 |
| 2. | Pasco | 38,859 | 793,289(4.90%)#2 | 37,145,956(0.10%)#131 |
| 3. | Seattle | 31,775 | 793,289(4.01%)#3 | 37,145,956(0.09%)#165 |
| 4. | Vancouver | 22,500 | 793,289(2.84%)#4 | 37,145,956(0.06%)#245 |
| 5. | Kennewick | 21,349 | 793,289(2.69%)#5 | 37,145,956(0.06%)#262 |
| 6. | Tacoma | 18,267 | 793,289(2.30%)#6 | 37,145,956(0.05%)#296 |
| 7. | Kent | 16,192 | 793,289(2.04%)#7 | 37,145,956(0.04%)#332 |
| 8. | Sunnyside | 13,545 | 793,289(1.71%)#8 | 37,145,956(0.04%)#396 |
| 9. | Auburn | 13,391 | 793,289(1.69%)#9 | 37,145,956(0.04%)#400 |
| 10. | Federal Way | 13,178 | 793,289(1.66%)#10 | 37,145,956(0.04%)#408 |
| 11. | Everett | 12,463 | 793,289(1.57%)#11 | 37,145,956(0.03%)#433 |
| 12. | Spokane | 11,396 | 793,289(1.44%)#12 | 37,145,956(0.03%)#467 |
| 13. | Mount Vernon | 11,304 | 793,289(1.42%)#13 | 37,145,956(0.03%)#471 |
| 14. | Renton | 10,962 | 793,289(1.38%)#14 | 37,145,956(0.03%)#486 |
| 15. | Wenatchee | 9,987 | 793,289(1.26%)#15 | 37,145,956(0.03%)#523 |
| 16. | Moses Lake | 9,017 | 793,289(1.14%)#16 | 37,145,956(0.02%)#565 |
| 17. | Grandview | 8,990 | 793,289(1.13%)#17 | 37,145,956(0.02%)#566 |
| 18. | Bellevue | 8,454 | 793,289(1.07%)#18 | 37,145,956(0.02%)#604 |
| 19. | Lakewood | 8,368 | 793,289(1.05%)#19 | 37,145,956(0.02%)#609 |
| 20. | Marysville | 8,264 | 793,289(1.04%)#20 | 37,145,956(0.02%)#618 |
| 21. | Toppenish | 7,873 | 793,289(0.99%)#21 | 37,145,956(0.02%)#650 |
| 22. | Burien | 7,226 | 793,289(0.91%)#22 | 37,145,956(0.02%)#702 |
| 23. | Richland | 6,559 | 793,289(0.83%)#23 | 37,145,956(0.02%)#753 |
| 24. | South Hill | 6,352 | 793,289(0.80%)#24 | 37,145,956(0.02%)#770 |
| 25. | Othello | 6,295 | 793,289(0.79%)#25 | 37,145,956(0.02%)#773 |
| 26. | Walla Walla | 6,204 | 793,289(0.78%)#26 | 37,145,956(0.02%)#779 |
| 27. | Bellingham | 5,896 | 793,289(0.74%)#27 | 37,145,956(0.02%)#807 |
| 28. | Spokane Valley | 5,890 | 793,289(0.74%)#28 | 37,145,956(0.02%)#809 |
| 29. | Quincy | 5,757 | 793,289(0.73%)#29 | 37,145,956(0.02%)#831 |
| 30. | Kirkland | 4,701 | 793,289(0.59%)#30 | 37,145,956(0.01%)#973 |
| 31. | Lacey | 4,675 | 793,289(0.59%)#31 | 37,145,956(0.01%)#977 |
| 32. | East Wenatchee | 4,616 | 793,289(0.58%)#32 | 37,145,956(0.01%)#987 |
| 33. | Parkland | 4,291 | 793,289(0.54%)#33 | 37,145,956(0.01%)#1,037 |
| 34. | Lynnwood | 4,215 | 793,289(0.53%)#34 | 37,145,956(0.01%)#1,044 |
| 35. | Seatac | 3,987 | 793,289(0.50%)#35 | 37,145,956(0.01%)#1,088 |
| 36. | Spanaway | 3,953 | 793,289(0.50%)#36 | 37,145,956(0.01%)#1,094 |
| 37. | Wapato | 3,903 | 793,289(0.49%)#37 | 37,145,956(0.01%)#1,110 |
| 38. | Tukwila | 3,809 | 793,289(0.48%)#38 | 37,145,956(0.01%)#1,136 |
| 39. | Des Moines | 3,637 | 793,289(0.46%)#39 | 37,145,956(0.01%)#1,168 |
| 40. | Redmond | 3,517 | 793,289(0.44%)#40 | 37,145,956(0.01%)#1,204 |
| 41. | Orchards | 3,496 | 793,289(0.44%)#41 | 37,145,956(0.01%)#1,212 |
| 42. | North Lynnwood | 3,357 | 793,289(0.42%)#42 | 37,145,956(0.01%)#1,253 |
| 43. | Granger | 3,349 | 793,289(0.42%)#43 | 37,145,956(0.01%)#1,257 |
| 44. | Bremerton | 3,274 | 793,289(0.41%)#44 | 37,145,956(0.01%)#1,282 |
| 45. | Longview | 3,267 | 793,289(0.41%)#45 | 37,145,956(0.01%)#1,286 |
| 46. | Mattawa | 3,251 | 793,289(0.41%)#46 | 37,145,956(0.01%)#1,291 |
| 47. | White Center | 3,232 | 793,289(0.41%)#47 | 37,145,956(0.01%)#1,300 |
| 48. | Union Gap | 3,161 | 793,289(0.40%)#48 | 37,145,956(0.01%)#1,319 |
| 49. | Oak Harbor | 3,153 | 793,289(0.40%)#49 | 37,145,956(0.01%)#1,323 |
| 50. | Prosser | 3,098 | 793,289(0.39%)#50 | 37,145,956(0.01%)#1,337 |
| 51. | Bothell | 2,863 | 793,289(0.36%)#51 | 37,145,956(0.01%)#1,391 |
| 52. | Olympia | 2,627 | 793,289(0.33%)#52 | 37,145,956(0.01%)#1,477 |
| 53. | Lake Stevens | 2,612 | 793,289(0.33%)#53 | 37,145,956(0.01%)#1,485 |
| 54. | Frederickson | 2,612 | 793,289(0.33%)#54 | 37,145,956(0.01%)#1,486 |
| 55. | Centralia | 2,537 | 793,289(0.32%)#55 | 37,145,956(0.01%)#1,513 |
| 56. | Shoreline | 2,519 | 793,289(0.32%)#56 | 37,145,956(0.01%)#1,522 |
| 57. | Monroe | 2,513 | 793,289(0.32%)#57 | 37,145,956(0.01%)#1,527 |
| 58. | Sedro Woolley | 2,444 | 793,289(0.31%)#58 | 37,145,956(0.01%)#1,565 |
| 59. | Terrace Heights | 2,436 | 793,289(0.31%)#59 | 37,145,956(0.01%)#1,569 |
| 60. | Aberdeen | 2,400 | 793,289(0.30%)#60 | 37,145,956(0.01%)#1,579 |
| 61. | Hazel Dell | 2,391 | 793,289(0.30%)#61 | 37,145,956(0.01%)#1,582 |
| 62. | Puyallup | 2,372 | 793,289(0.30%)#62 | 37,145,956(0.01%)#1,590 |
| 63. | Fort Lewis | 2,347 | 793,289(0.30%)#63 | 37,145,956(0.01%)#1,605 |
| 64. | Graham | 2,271 | 793,289(0.29%)#64 | 37,145,956(0.01%)#1,659 |
| 65. | University Place | 2,240 | 793,289(0.28%)#65 | 37,145,956(0.01%)#1,677 |
| 66. | Bridgeport | 2,184 | 793,289(0.28%)#66 | 37,145,956(0.01%)#1,710 |
| 67. | Mabton | 2,167 | 793,289(0.27%)#67 | 37,145,956(0.01%)#1,718 |
| 68. | Connell | 2,148 | 793,289(0.27%)#68 | 37,145,956(0.01%)#1,729 |
| 69. | West Richland | 2,128 | 793,289(0.27%)#69 | 37,145,956(0.01%)#1,745 |
| 70. | Ephrata | 2,058 | 793,289(0.26%)#70 | 37,145,956(0.01%)#1,782 |
| 71. | Selah | 2,036 | 793,289(0.26%)#71 | 37,145,956(0.01%)#1,795 |
| 72. | Moses Lake North | 2,009 | 793,289(0.25%)#72 | 37,145,956(0.01%)#1,808 |
| 73. | Arlington | 1,994 | 793,289(0.25%)#73 | 37,145,956(0.01%)#1,823 |
| 74. | Mountlake Terrace | 1,958 | 793,289(0.25%)#74 | 37,145,956(0.01%)#1,849 |
| 75. | Burlington | 1,898 | 793,289(0.24%)#75 | 37,145,956(0.01%)#1,888 |
| 76. | Royal City | 1,886 | 793,289(0.24%)#76 | 37,145,956(0.01%)#1,892 |
| 77. | Bothell West | 1,840 | 793,289(0.23%)#77 | 37,145,956(0.00%)#1,912 |
| 78. | Brewster | 1,799 | 793,289(0.23%)#78 | 37,145,956(0.00%)#1,944 |
| 79. | Kelso | 1,733 | 793,289(0.22%)#79 | 37,145,956(0.00%)#1,989 |
| 80. | Issaquah | 1,722 | 793,289(0.22%)#80 | 37,145,956(0.00%)#1,995 |
| 81. | Warden | 1,706 | 793,289(0.22%)#81 | 37,145,956(0.00%)#2,002 |
| 82. | Ellensburg | 1,699 | 793,289(0.21%)#82 | 37,145,956(0.00%)#2,010 |
| 83. | Finley | 1,688 | 793,289(0.21%)#83 | 37,145,956(0.00%)#2,023 |
| 84. | Salmon Creek | 1,637 | 793,289(0.21%)#84 | 37,145,956(0.00%)#2,060 |
| 85. | Lakeland North | 1,627 | 793,289(0.21%)#85 | 37,145,956(0.00%)#2,068 |
| 86. | Desert Aire | 1,627 | 793,289(0.21%)#86 | 37,145,956(0.00%)#2,069 |
| 87. | Pullman | 1,598 | 793,289(0.20%)#87 | 37,145,956(0.00%)#2,091 |
| 88. | Midland | 1,572 | 793,289(0.20%)#88 | 37,145,956(0.00%)#2,115 |
| 89. | Mill Creek East | 1,564 | 793,289(0.20%)#89 | 37,145,956(0.00%)#2,120 |
| 90. | Lynden | 1,514 | 793,289(0.19%)#90 | 37,145,956(0.00%)#2,182 |
| 91. | Five Corners | 1,480 | 793,289(0.19%)#91 | 37,145,956(0.00%)#2,209 |
| 92. | Basin City | 1,460 | 793,289(0.18%)#92 | 37,145,956(0.00%)#2,223 |
| 93. | Zillah | 1,458 | 793,289(0.18%)#93 | 37,145,956(0.00%)#2,225 |
| 94. | Martha Lake | 1,407 | 793,289(0.18%)#94 | 37,145,956(0.00%)#2,278 |
| 95. | Sumner | 1,404 | 793,289(0.18%)#95 | 37,145,956(0.00%)#2,281 |
| 96. | Covington | 1,381 | 793,289(0.17%)#96 | 37,145,956(0.00%)#2,306 |
| 97. | Cascade Valley | 1,328 | 793,289(0.17%)#97 | 37,145,956(0.00%)#2,358 |
| 98. | Bonney Lake | 1,321 | 793,289(0.17%)#98 | 37,145,956(0.00%)#2,367 |
| 99. | Kenmore | 1,287 | 793,289(0.16%)#99 | 37,145,956(0.00%)#2,401 |
| 100. | Lakeland South | 1,284 | 793,289(0.16%)#100 | 37,145,956(0.00%)#2,406 |
Common Questions
What are the Top 10 Cities with the Largest Mexican Community in Washington?
Top 10 Cities with the Largest Mexican Community in Washington are:
What city has the Largest Mexican Community in Washington?
Yakima has the Largest Mexican Community in Washington with 40,802.
What is the Total Mexican Population in the State of Washington?
Total Mexican Population in Washington is 793,289.
What is the Total Mexican Population in the United States?
Total Mexican Population in the United States is 37,145,956.