Cities with the Highest Percentage of Native / Alaskan Population in Washington
RELATED REPORTS & OPTIONS
Native / Alaskan
Washington
Compare Cities
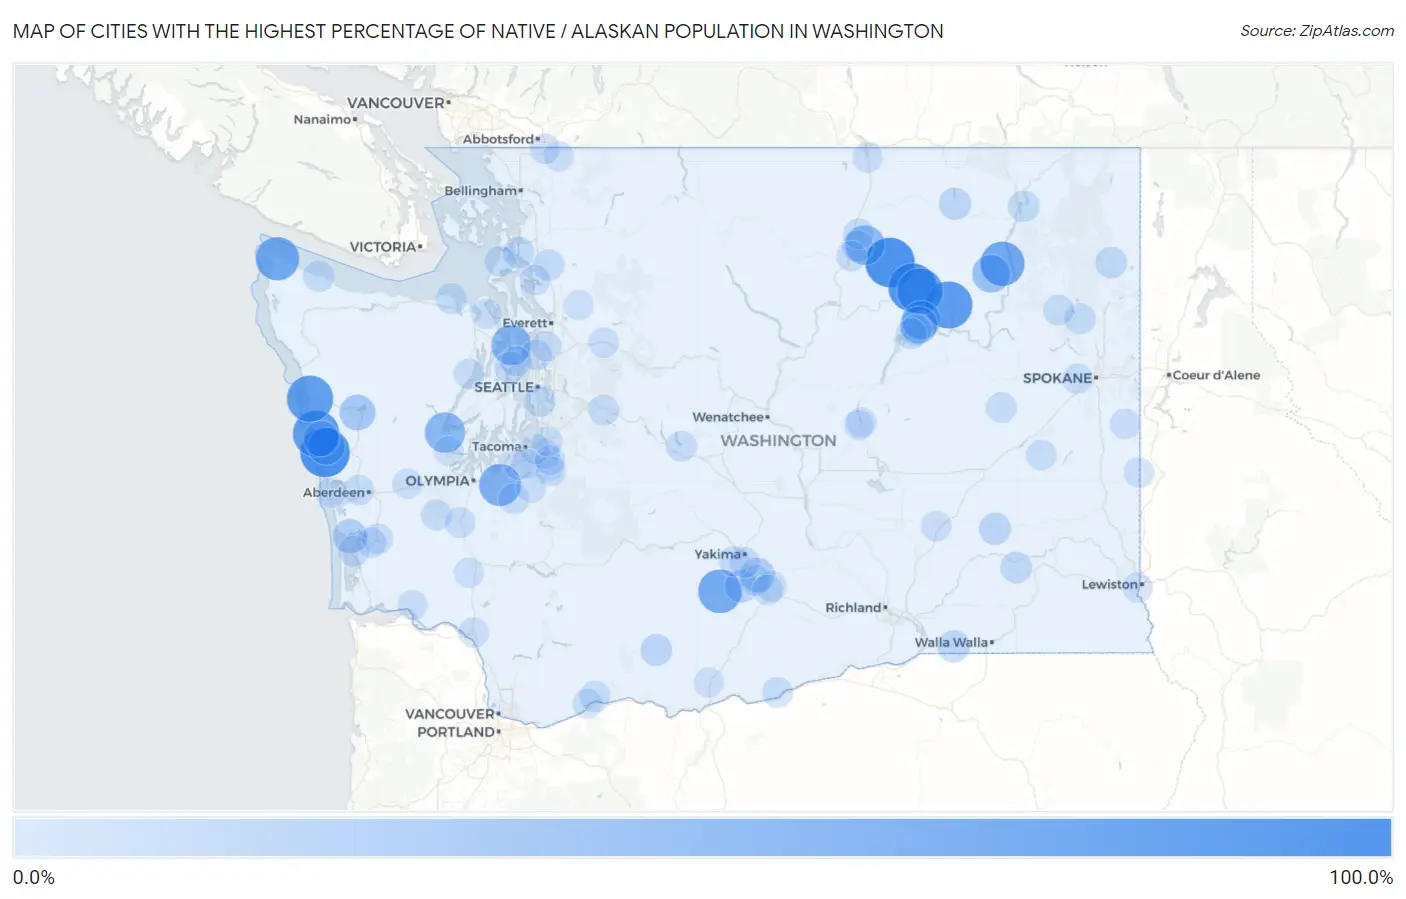
Map of Cities with the Highest Percentage of Native / Alaskan Population in Washington
0.0%
100.0%
Cities with the Highest Percentage of Native / Alaskan Population in Washington
| City | Native / Alaskan | vs State | vs National | |
| 1. | Pacific Beach | 100.0% | 1.2%(+98.8)#1 | 0.84%(+99.2)#71 |
| 2. | Disautel | 100.0% | 1.2%(+98.8)#2 | 0.84%(+99.2)#103 |
| 3. | Nespelem Community | 93.5% | 1.2%(+92.3)#3 | 0.84%(+92.7)#257 |
| 4. | Keller | 88.3% | 1.2%(+87.1)#4 | 0.84%(+87.4)#352 |
| 5. | Taholah | 85.1% | 1.2%(+83.9)#5 | 0.84%(+84.2)#389 |
| 6. | Queets | 83.3% | 1.2%(+82.1)#6 | 0.84%(+82.5)#403 |
| 7. | Nespelem | 81.3% | 1.2%(+80.1)#7 | 0.84%(+80.4)#423 |
| 8. | Inchelium | 72.8% | 1.2%(+71.6)#8 | 0.84%(+71.9)#495 |
| 9. | White Swan | 69.9% | 1.2%(+68.7)#9 | 0.84%(+69.0)#511 |
| 10. | Neah Bay | 68.7% | 1.2%(+67.5)#10 | 0.84%(+67.9)#517 |
| 11. | Nisqually Indian Community | 60.7% | 1.2%(+59.5)#11 | 0.84%(+59.9)#560 |
| 12. | Wheeler | 53.4% | 1.2%(+52.2)#12 | 0.84%(+52.5)#595 |
| 13. | Skokomish | 53.0% | 1.2%(+51.8)#13 | 0.84%(+52.1)#597 |
| 14. | Port Gamble Tribal Community | 50.8% | 1.2%(+49.6)#14 | 0.84%(+50.0)#613 |
| 15. | North Omak | 49.1% | 1.2%(+47.9)#15 | 0.84%(+48.3)#627 |
| 16. | Elmer City | 43.1% | 1.2%(+41.9)#16 | 0.84%(+42.3)#671 |
| 17. | Twin Lakes | 40.5% | 1.2%(+39.3)#17 | 0.84%(+39.7)#684 |
| 18. | Coulee Dam | 37.3% | 1.2%(+36.1)#18 | 0.84%(+36.5)#708 |
| 19. | Qui Nai Elt Village | 36.7% | 1.2%(+35.5)#19 | 0.84%(+35.9)#715 |
| 20. | Amanda Park | 29.6% | 1.2%(+28.4)#20 | 0.84%(+28.7)#806 |
| 21. | Santiago | 29.3% | 1.2%(+28.1)#21 | 0.84%(+28.5)#809 |
| 22. | Donald | 23.8% | 1.2%(+22.6)#22 | 0.84%(+23.0)#895 |
| 23. | Tokeland | 22.5% | 1.2%(+21.4)#23 | 0.84%(+21.7)#916 |
| 24. | Beverly | 21.4% | 1.2%(+20.2)#24 | 0.84%(+20.6)#937 |
| 25. | Harrah | 15.0% | 1.2%(+13.8)#25 | 0.84%(+14.2)#1,132 |
| 26. | Touchet | 12.6% | 1.2%(+11.4)#26 | 0.84%(+11.7)#1,234 |
| 27. | Torboy | 11.9% | 1.2%(+10.7)#27 | 0.84%(+11.1)#1,273 |
| 28. | Glenwood | 11.4% | 1.2%(+10.2)#28 | 0.84%(+10.5)#1,301 |
| 29. | Washtucna | 11.4% | 1.2%(+10.2)#29 | 0.84%(+10.5)#1,302 |
| 30. | Cusick | 10.3% | 1.2%(+9.08)#30 | 0.84%(+9.43)#1,373 |
| 31. | Starbuck | 10.0% | 1.2%(+8.81)#31 | 0.84%(+9.16)#1,390 |
| 32. | Marcus | 9.3% | 1.2%(+8.15)#32 | 0.84%(+8.50)#1,436 |
| 33. | Suquamish | 9.1% | 1.2%(+7.89)#33 | 0.84%(+8.24)#1,449 |
| 34. | La Conner | 8.8% | 1.2%(+7.61)#34 | 0.84%(+7.96)#1,468 |
| 35. | Lake Mcmurray | 8.2% | 1.2%(+7.05)#35 | 0.84%(+7.40)#1,519 |
| 36. | Boulevard Park | 8.2% | 1.2%(+7.01)#36 | 0.84%(+7.37)#1,522 |
| 37. | Omak | 8.0% | 1.2%(+6.78)#37 | 0.84%(+7.13)#1,551 |
| 38. | Clallam Bay | 7.9% | 1.2%(+6.71)#38 | 0.84%(+7.06)#1,560 |
| 39. | Jamestown | 7.4% | 1.2%(+6.17)#39 | 0.84%(+6.52)#1,612 |
| 40. | Wapato | 7.1% | 1.2%(+5.89)#40 | 0.84%(+6.25)#1,647 |
| 41. | Clayton | 7.1% | 1.2%(+5.89)#41 | 0.84%(+6.25)#1,649 |
| 42. | Carson | 6.9% | 1.2%(+5.75)#42 | 0.84%(+6.10)#1,664 |
| 43. | Whidbey Island Station | 6.8% | 1.2%(+5.66)#43 | 0.84%(+6.01)#1,678 |
| 44. | Grand Coulee | 6.6% | 1.2%(+5.38)#44 | 0.84%(+5.73)#1,713 |
| 45. | Oakville | 6.4% | 1.2%(+5.21)#45 | 0.84%(+5.56)#1,736 |
| 46. | Electric City | 6.3% | 1.2%(+5.09)#46 | 0.84%(+5.44)#1,755 |
| 47. | Riverside | 6.1% | 1.2%(+4.94)#47 | 0.84%(+5.29)#1,773 |
| 48. | Bay Center | 6.1% | 1.2%(+4.92)#48 | 0.84%(+5.27)#1,778 |
| 49. | Harrington | 6.0% | 1.2%(+4.81)#49 | 0.84%(+5.16)#1,798 |
| 50. | Roosevelt | 5.7% | 1.2%(+4.54)#50 | 0.84%(+4.89)#1,840 |
| 51. | Zillah | 5.7% | 1.2%(+4.48)#51 | 0.84%(+4.84)#1,849 |
| 52. | Springdale | 5.7% | 1.2%(+4.46)#52 | 0.84%(+4.81)#1,853 |
| 53. | Union Gap | 5.6% | 1.2%(+4.37)#53 | 0.84%(+4.72)#1,875 |
| 54. | Roslyn | 5.3% | 1.2%(+4.13)#54 | 0.84%(+4.48)#1,922 |
| 55. | Esperance | 5.2% | 1.2%(+4.03)#55 | 0.84%(+4.38)#1,935 |
| 56. | Grand Mound | 5.2% | 1.2%(+3.98)#56 | 0.84%(+4.33)#1,949 |
| 57. | Riverbend | 5.1% | 1.2%(+3.95)#57 | 0.84%(+4.30)#1,956 |
| 58. | Lamont | 5.0% | 1.2%(+3.84)#58 | 0.84%(+4.19)#1,982 |
| 59. | Raymond | 5.0% | 1.2%(+3.82)#59 | 0.84%(+4.17)#1,988 |
| 60. | Hoquiam | 5.0% | 1.2%(+3.78)#60 | 0.84%(+4.13)#2,000 |
| 61. | Mckenna | 4.9% | 1.2%(+3.68)#61 | 0.84%(+4.03)#2,018 |
| 62. | Startup | 4.8% | 1.2%(+3.57)#62 | 0.84%(+3.92)#2,040 |
| 63. | Toppenish | 4.7% | 1.2%(+3.50)#63 | 0.84%(+3.85)#2,052 |
| 64. | Airway Heights | 4.7% | 1.2%(+3.50)#64 | 0.84%(+3.85)#2,053 |
| 65. | Kitsap Lake | 4.7% | 1.2%(+3.48)#65 | 0.84%(+3.83)#2,060 |
| 66. | Brinnon | 4.5% | 1.2%(+3.27)#66 | 0.84%(+3.62)#2,105 |
| 67. | Larch Way | 4.5% | 1.2%(+3.26)#67 | 0.84%(+3.61)#2,108 |
| 68. | Ahtanum | 4.4% | 1.2%(+3.25)#68 | 0.84%(+3.60)#2,115 |
| 69. | Hatton | 4.3% | 1.2%(+3.08)#69 | 0.84%(+3.43)#2,177 |
| 70. | Peaceful Valley | 4.2% | 1.2%(+2.97)#70 | 0.84%(+3.32)#2,211 |
| 71. | Ocean Shores | 3.8% | 1.2%(+2.60)#71 | 0.84%(+2.95)#2,343 |
| 72. | Fairfield | 3.7% | 1.2%(+2.55)#72 | 0.84%(+2.90)#2,354 |
| 73. | Okanogan | 3.7% | 1.2%(+2.48)#73 | 0.84%(+2.83)#2,377 |
| 74. | West Clarkston Highland | 3.7% | 1.2%(+2.48)#74 | 0.84%(+2.83)#2,380 |
| 75. | Sumas | 3.5% | 1.2%(+2.31)#75 | 0.84%(+2.67)#2,431 |
| 76. | Farmington | 3.5% | 1.2%(+2.28)#76 | 0.84%(+2.63)#2,450 |
| 77. | Oroville | 3.3% | 1.2%(+2.06)#77 | 0.84%(+2.41)#2,539 |
| 78. | South Bend | 3.2% | 1.2%(+2.03)#78 | 0.84%(+2.39)#2,551 |
| 79. | Stanwood | 3.2% | 1.2%(+2.02)#79 | 0.84%(+2.38)#2,557 |
| 80. | Soap Lake | 3.2% | 1.2%(+2.00)#80 | 0.84%(+2.35)#2,570 |
| 81. | Kelso | 3.2% | 1.2%(+1.98)#81 | 0.84%(+2.33)#2,577 |
| 82. | Mcmillin | 3.0% | 1.2%(+1.82)#82 | 0.84%(+2.17)#2,658 |
| 83. | North Puyallup | 3.0% | 1.2%(+1.79)#83 | 0.84%(+2.14)#2,672 |
| 84. | Port Hadlock Irondale | 3.0% | 1.2%(+1.78)#84 | 0.84%(+2.13)#2,673 |
| 85. | Granite Falls | 2.9% | 1.2%(+1.74)#85 | 0.84%(+2.09)#2,688 |
| 86. | Orting | 2.9% | 1.2%(+1.72)#86 | 0.84%(+2.07)#2,701 |
| 87. | Goldendale | 2.9% | 1.2%(+1.68)#87 | 0.84%(+2.03)#2,724 |
| 88. | Winlock | 2.8% | 1.2%(+1.62)#88 | 0.84%(+1.97)#2,760 |
| 89. | South Creek | 2.7% | 1.2%(+1.54)#89 | 0.84%(+1.89)#2,805 |
| 90. | Lakeview | 2.7% | 1.2%(+1.47)#90 | 0.84%(+1.82)#2,838 |
| 91. | Shelton | 2.6% | 1.2%(+1.41)#91 | 0.84%(+1.76)#2,869 |
| 92. | Fife | 2.6% | 1.2%(+1.40)#92 | 0.84%(+1.75)#2,873 |
| 93. | Indianola | 2.6% | 1.2%(+1.40)#93 | 0.84%(+1.75)#2,875 |
| 94. | Parkland | 2.6% | 1.2%(+1.39)#94 | 0.84%(+1.74)#2,882 |
| 95. | Alderton | 2.6% | 1.2%(+1.38)#95 | 0.84%(+1.73)#2,885 |
| 96. | Satsop | 2.5% | 1.2%(+1.28)#96 | 0.84%(+1.63)#2,949 |
| 97. | Skamokawa Valley | 2.4% | 1.2%(+1.24)#97 | 0.84%(+1.59)#2,989 |
| 98. | Mcchord Afb | 2.4% | 1.2%(+1.22)#98 | 0.84%(+1.57)#3,003 |
| 99. | Algona | 2.4% | 1.2%(+1.17)#99 | 0.84%(+1.52)#3,052 |
| 100. | Stevenson | 2.4% | 1.2%(+1.16)#100 | 0.84%(+1.52)#3,056 |
Common Questions
What are the Top 10 Cities with the Highest Percentage of Native / Alaskan Population in Washington?
Top 10 Cities with the Highest Percentage of Native / Alaskan Population in Washington are:
#1
100.0%
#2
100.0%
#3
93.5%
#4
88.3%
#5
85.1%
#6
83.3%
#7
81.3%
#8
72.8%
#9
69.9%
#10
68.7%
What city has the Highest Percentage of Native / Alaskan Population in Washington?
Pacific Beach has the Highest Percentage of Native / Alaskan Population in Washington with 100.0%.
What is the Percentage of Native / Alaskan Population in the State of Washington?
Percentage of Native / Alaskan Population in Washington is 1.2%.
What is the Percentage of Native / Alaskan Population in the United States?
Percentage of Native / Alaskan Population in the United States is 0.84%.