Cities with the Highest Unemployment Rate Among Males in Washington
RELATED REPORTS & OPTIONS
Highest Unemployment | Male
Washington
Compare Cities
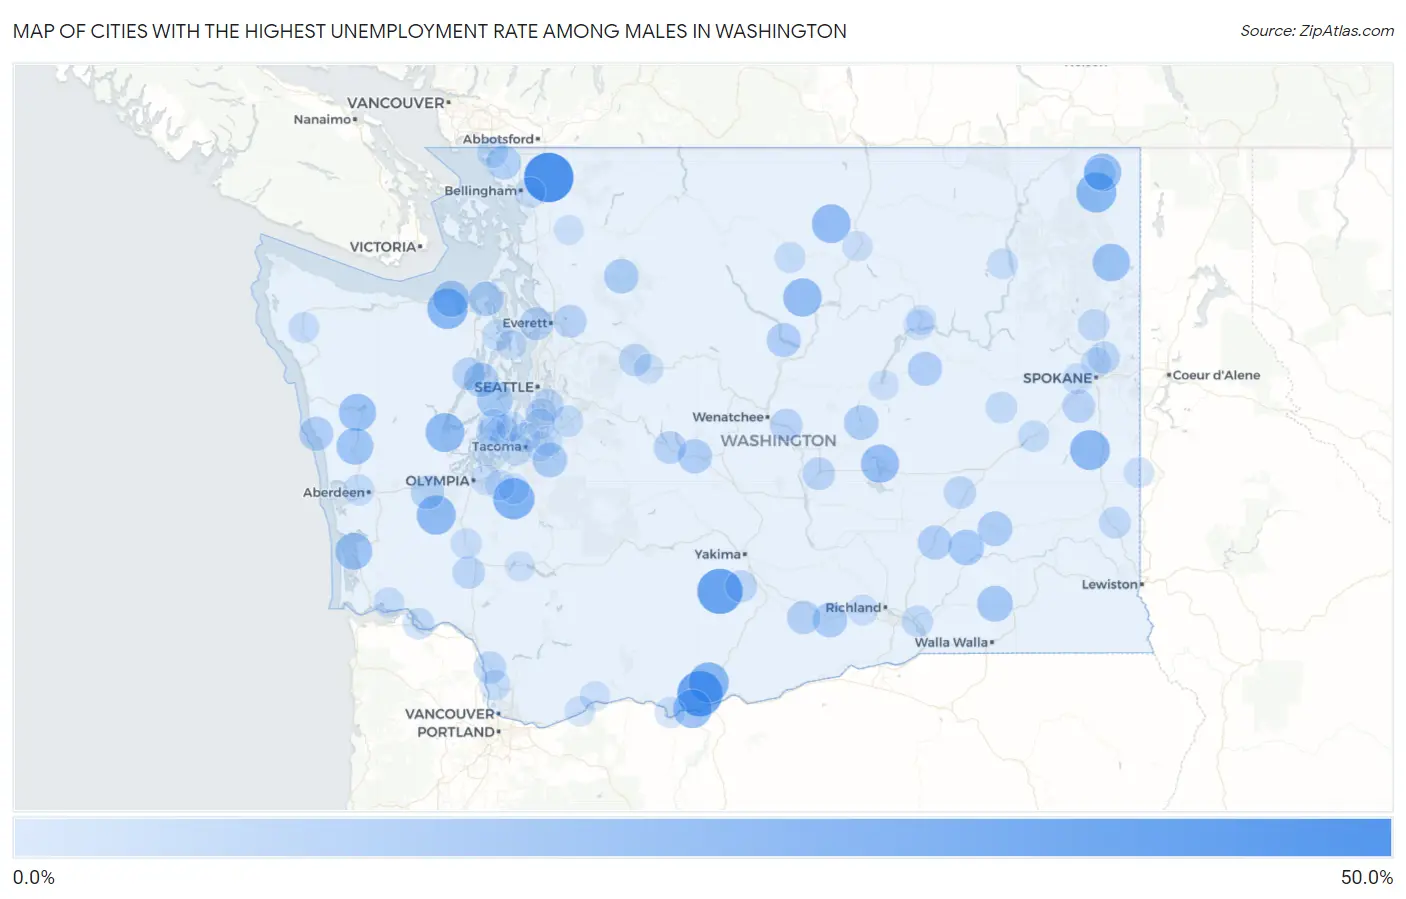
Map of Cities with the Highest Unemployment Rate Among Males in Washington
0.0%
50.0%
Cities with the Highest Unemployment Rate Among Males in Washington
| City | Male Unemployment | vs State | vs National | |
| 1. | Deming | 48.2% | 4.7%(+43.5)#1 | 5.0%(+43.2)#288 |
| 2. | Centerville | 39.4% | 4.7%(+34.7)#2 | 5.0%(+34.4)#437 |
| 3. | White Swan | 39.1% | 4.7%(+34.4)#3 | 5.0%(+34.1)#445 |
| 4. | Mckenna | 30.8% | 4.7%(+26.1)#4 | 5.0%(+25.8)#735 |
| 5. | River Road | 29.1% | 4.7%(+24.4)#5 | 5.0%(+24.1)#821 |
| 6. | Goldendale | 28.6% | 4.7%(+23.9)#6 | 5.0%(+23.6)#844 |
| 7. | Ione | 28.1% | 4.7%(+23.4)#7 | 5.0%(+23.1)#881 |
| 8. | Malden | 27.8% | 4.7%(+23.1)#8 | 5.0%(+22.8)#912 |
| 9. | Oakville | 26.5% | 4.7%(+21.8)#9 | 5.0%(+21.5)#990 |
| 10. | Skokomish | 26.0% | 4.7%(+21.3)#10 | 5.0%(+21.0)#1,029 |
| 11. | Conconully | 25.5% | 4.7%(+20.8)#11 | 5.0%(+20.5)#1,056 |
| 12. | Wishram | 25.3% | 4.7%(+20.6)#12 | 5.0%(+20.3)#1,071 |
| 13. | Methow | 25.0% | 4.7%(+20.3)#13 | 5.0%(+20.0)#1,101 |
| 14. | Cascade Valley | 24.1% | 4.7%(+19.4)#14 | 5.0%(+19.1)#1,173 |
| 15. | Metaline Falls | 23.3% | 4.7%(+18.6)#15 | 5.0%(+18.3)#1,268 |
| 16. | Cusick | 23.1% | 4.7%(+18.4)#16 | 5.0%(+18.1)#1,287 |
| 17. | Amanda Park | 22.6% | 4.7%(+17.9)#17 | 5.0%(+17.6)#1,346 |
| 18. | Bay Center | 21.9% | 4.7%(+17.2)#18 | 5.0%(+16.9)#1,420 |
| 19. | Humptulips | 21.7% | 4.7%(+17.0)#19 | 5.0%(+16.7)#1,440 |
| 20. | Jamestown | 20.6% | 4.7%(+15.9)#20 | 5.0%(+15.6)#1,542 |
| 21. | Gorst | 19.8% | 4.7%(+15.1)#21 | 5.0%(+14.8)#1,658 |
| 22. | Prescott | 19.7% | 4.7%(+15.0)#22 | 5.0%(+14.7)#1,667 |
| 23. | Kahlotus | 19.0% | 4.7%(+14.3)#23 | 5.0%(+14.0)#1,764 |
| 24. | Washtucna | 17.6% | 4.7%(+12.9)#24 | 5.0%(+12.6)#1,981 |
| 25. | Alderton | 17.4% | 4.7%(+12.7)#25 | 5.0%(+12.4)#2,003 |
| 26. | Prosser | 17.3% | 4.7%(+12.6)#26 | 5.0%(+12.3)#2,021 |
| 27. | Darrington | 17.2% | 4.7%(+12.5)#27 | 5.0%(+12.2)#2,044 |
| 28. | Soap Lake | 17.1% | 4.7%(+12.4)#28 | 5.0%(+12.1)#2,069 |
| 29. | Port Townsend | 16.8% | 4.7%(+12.1)#29 | 5.0%(+11.8)#2,119 |
| 30. | Seabeck | 16.6% | 4.7%(+11.9)#30 | 5.0%(+11.6)#2,192 |
| 31. | Connell | 16.5% | 4.7%(+11.8)#31 | 5.0%(+11.5)#2,195 |
| 32. | South Cle Elum | 16.5% | 4.7%(+11.8)#32 | 5.0%(+11.5)#2,206 |
| 33. | Almira | 16.4% | 4.7%(+11.7)#33 | 5.0%(+11.4)#2,231 |
| 34. | Manson | 16.1% | 4.7%(+11.4)#34 | 5.0%(+11.1)#2,282 |
| 35. | Taholah | 16.0% | 4.7%(+11.3)#35 | 5.0%(+11.0)#2,308 |
| 36. | Custer | 15.9% | 4.7%(+11.2)#36 | 5.0%(+10.9)#2,349 |
| 37. | Mabton | 15.0% | 4.7%(+10.3)#37 | 5.0%(+10.00)#2,566 |
| 38. | Malone | 14.8% | 4.7%(+10.1)#38 | 5.0%(+9.80)#2,641 |
| 39. | Riverpoint | 14.6% | 4.7%(+9.90)#39 | 5.0%(+9.60)#2,687 |
| 40. | Clinton | 14.2% | 4.7%(+9.50)#40 | 5.0%(+9.20)#2,809 |
| 41. | Machias | 14.1% | 4.7%(+9.40)#41 | 5.0%(+9.10)#2,829 |
| 42. | Cheney | 13.8% | 4.7%(+9.10)#42 | 5.0%(+8.80)#2,914 |
| 43. | Brinnon | 13.5% | 4.7%(+8.80)#43 | 5.0%(+8.50)#3,033 |
| 44. | Easton | 13.5% | 4.7%(+8.80)#44 | 5.0%(+8.50)#3,044 |
| 45. | Rock Island | 13.3% | 4.7%(+8.60)#45 | 5.0%(+8.30)#3,087 |
| 46. | George | 13.3% | 4.7%(+8.60)#46 | 5.0%(+8.30)#3,090 |
| 47. | Lind | 13.0% | 4.7%(+8.30)#47 | 5.0%(+8.00)#3,214 |
| 48. | Winlock | 12.8% | 4.7%(+8.10)#48 | 5.0%(+7.80)#3,292 |
| 49. | Woodland | 12.7% | 4.7%(+8.00)#49 | 5.0%(+7.70)#3,319 |
| 50. | Baring | 12.7% | 4.7%(+8.00)#50 | 5.0%(+7.70)#3,355 |
| 51. | Mead | 12.6% | 4.7%(+7.90)#51 | 5.0%(+7.60)#3,360 |
| 52. | Bryn Mawr Skyway | 12.5% | 4.7%(+7.80)#52 | 5.0%(+7.50)#3,394 |
| 53. | Harrah | 12.4% | 4.7%(+7.70)#53 | 5.0%(+7.40)#3,498 |
| 54. | Albion | 11.9% | 4.7%(+7.20)#54 | 5.0%(+6.90)#3,726 |
| 55. | Metaline | 11.8% | 4.7%(+7.10)#55 | 5.0%(+6.80)#3,779 |
| 56. | Deer Park | 11.7% | 4.7%(+7.00)#56 | 5.0%(+6.70)#3,803 |
| 57. | Stansberry Lake | 11.6% | 4.7%(+6.90)#57 | 5.0%(+6.60)#3,863 |
| 58. | Shadow Lake | 11.2% | 4.7%(+6.50)#58 | 5.0%(+6.20)#4,047 |
| 59. | Puget Island | 11.1% | 4.7%(+6.40)#59 | 5.0%(+6.10)#4,093 |
| 60. | Harrington | 11.1% | 4.7%(+6.40)#60 | 5.0%(+6.10)#4,104 |
| 61. | Burbank | 11.0% | 4.7%(+6.30)#61 | 5.0%(+6.00)#4,152 |
| 62. | Sprague | 11.0% | 4.7%(+6.30)#62 | 5.0%(+6.00)#4,173 |
| 63. | Fircrest | 10.9% | 4.7%(+6.20)#63 | 5.0%(+5.90)#4,191 |
| 64. | Rosedale | 10.6% | 4.7%(+5.90)#64 | 5.0%(+5.60)#4,368 |
| 65. | Hoquiam | 10.4% | 4.7%(+5.70)#65 | 5.0%(+5.40)#4,504 |
| 66. | Port Ludlow | 10.3% | 4.7%(+5.60)#66 | 5.0%(+5.30)#4,563 |
| 67. | Forks | 10.1% | 4.7%(+5.40)#67 | 5.0%(+5.10)#4,685 |
| 68. | Blaine | 10.0% | 4.7%(+5.30)#68 | 5.0%(+5.00)#4,742 |
| 69. | Twisp | 10.0% | 4.7%(+5.30)#69 | 5.0%(+5.00)#4,769 |
| 70. | Roy | 9.9% | 4.7%(+5.20)#70 | 5.0%(+4.90)#4,860 |
| 71. | Ridgefield | 9.8% | 4.7%(+5.10)#71 | 5.0%(+4.80)#4,891 |
| 72. | Airway Heights | 9.7% | 4.7%(+5.00)#72 | 5.0%(+4.70)#4,954 |
| 73. | Dallesport | 9.7% | 4.7%(+5.00)#73 | 5.0%(+4.70)#4,990 |
| 74. | Chehalis | 9.6% | 4.7%(+4.90)#74 | 5.0%(+4.60)#5,040 |
| 75. | Benton City | 9.6% | 4.7%(+4.90)#75 | 5.0%(+4.60)#5,046 |
| 76. | Geneva | 9.6% | 4.7%(+4.90)#76 | 5.0%(+4.60)#5,053 |
| 77. | Inchelium | 9.6% | 4.7%(+4.90)#77 | 5.0%(+4.60)#5,084 |
| 78. | Seatac | 9.4% | 4.7%(+4.70)#78 | 5.0%(+4.40)#5,172 |
| 79. | Rosburg | 9.4% | 4.7%(+4.70)#79 | 5.0%(+4.40)#5,226 |
| 80. | Tanglewilde | 9.3% | 4.7%(+4.60)#80 | 5.0%(+4.30)#5,258 |
| 81. | Country Homes | 9.3% | 4.7%(+4.60)#81 | 5.0%(+4.30)#5,261 |
| 82. | Des Moines | 9.2% | 4.7%(+4.50)#82 | 5.0%(+4.20)#5,329 |
| 83. | Farmington | 9.1% | 4.7%(+4.40)#83 | 5.0%(+4.10)#5,479 |
| 84. | Coulee Dam | 9.0% | 4.7%(+4.30)#84 | 5.0%(+4.00)#5,535 |
| 85. | Omak | 8.9% | 4.7%(+4.20)#85 | 5.0%(+3.90)#5,598 |
| 86. | Nisqually Indian Community | 8.9% | 4.7%(+4.20)#86 | 5.0%(+3.90)#5,643 |
| 87. | North Bonneville | 8.8% | 4.7%(+4.10)#87 | 5.0%(+3.80)#5,703 |
| 88. | Port Gamble Tribal Community | 8.8% | 4.7%(+4.10)#88 | 5.0%(+3.80)#5,705 |
| 89. | Maplewood | 8.7% | 4.7%(+4.00)#89 | 5.0%(+3.70)#5,748 |
| 90. | Coulee City | 8.6% | 4.7%(+3.90)#90 | 5.0%(+3.60)#5,894 |
| 91. | Milton | 8.5% | 4.7%(+3.80)#91 | 5.0%(+3.50)#5,921 |
| 92. | Algona | 8.5% | 4.7%(+3.80)#92 | 5.0%(+3.50)#5,933 |
| 93. | Carson | 8.5% | 4.7%(+3.80)#93 | 5.0%(+3.50)#5,937 |
| 94. | Mossyrock | 8.5% | 4.7%(+3.80)#94 | 5.0%(+3.50)#5,955 |
| 95. | Browns Point | 8.4% | 4.7%(+3.70)#95 | 5.0%(+3.40)#6,027 |
| 96. | Longbranch | 8.3% | 4.7%(+3.60)#96 | 5.0%(+3.30)#6,073 |
| 97. | Key Center | 8.3% | 4.7%(+3.60)#97 | 5.0%(+3.30)#6,076 |
| 98. | Lyman | 8.3% | 4.7%(+3.60)#98 | 5.0%(+3.30)#6,130 |
| 99. | Elmer City | 8.3% | 4.7%(+3.60)#99 | 5.0%(+3.30)#6,141 |
| 100. | Skykomish | 8.3% | 4.7%(+3.60)#100 | 5.0%(+3.30)#6,162 |
Common Questions
What are the Top 10 Cities with the Highest Unemployment Rate Among Males in Washington?
Top 10 Cities with the Highest Unemployment Rate Among Males in Washington are:
#1
48.2%
#2
39.4%
#3
39.1%
#4
30.8%
#5
29.1%
#6
28.6%
#7
28.1%
#8
27.8%
#9
26.5%
#10
26.0%
What city has the Highest Unemployment Rate Among Males in Washington?
Deming has the Highest Unemployment Rate Among Males in Washington with 48.2%.
What is the Unemployment Rate Among Males in the State of Washington?
Unemployment Rate Among Males in Washington is 4.7%.
What is the Unemployment Rate Among Males in the United States?
Unemployment Rate Among Males in the United States is 5.0%.