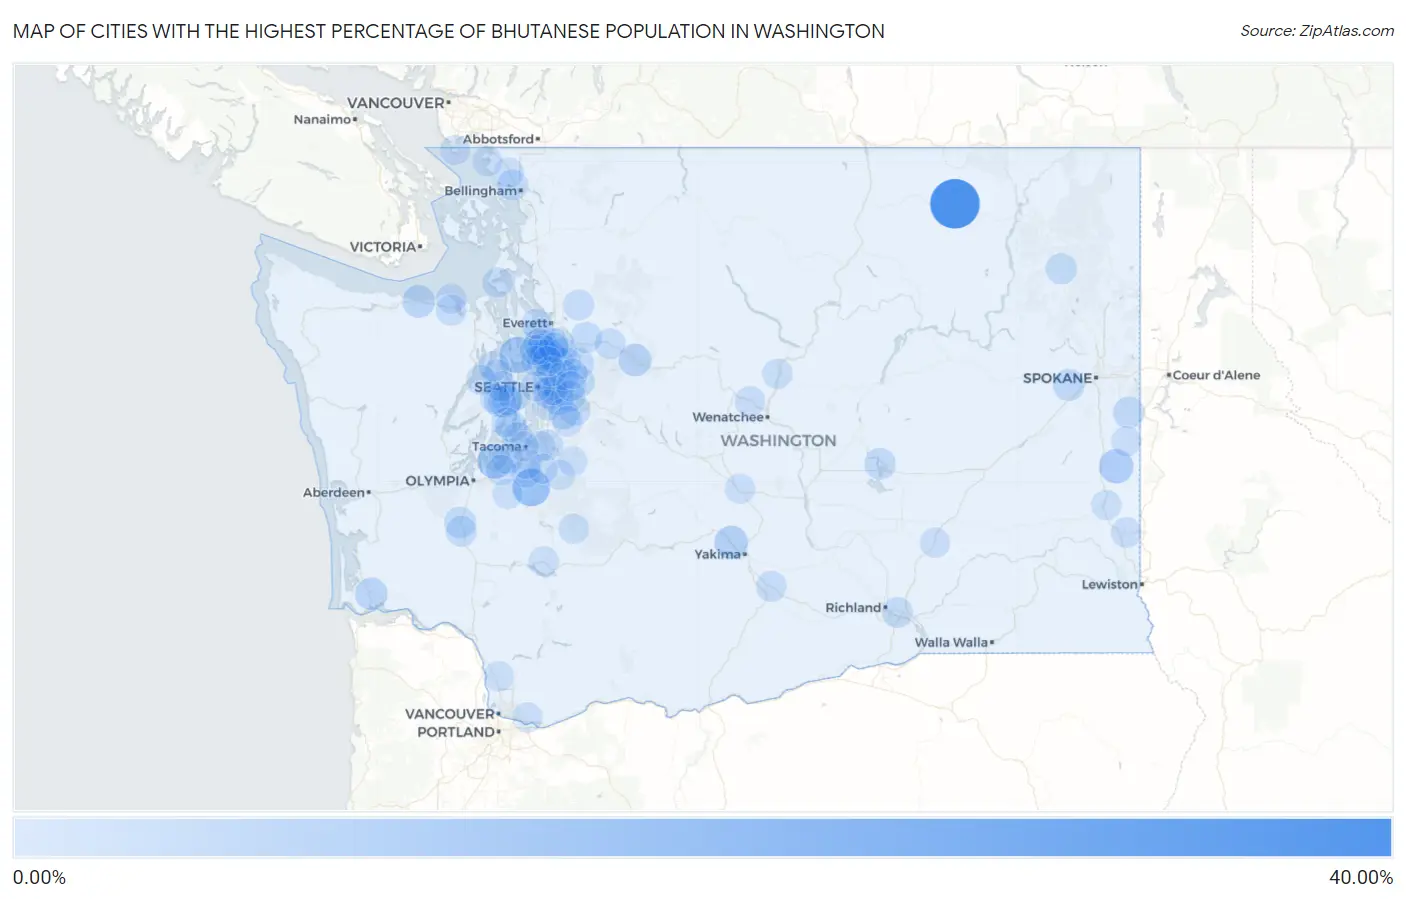
Cities with the Highest Percentage of Bhutanese Population in Washington
RELATED REPORTS & OPTIONS
Bhutanese
Washington
Compare Cities
Map of Cities with the Highest Percentage of Bhutanese Population in Washington
0.00%
40.00%
Cities with the Highest Percentage of Bhutanese Population in Washington
| City | Bhutanese | vs State | vs National | |
| 1. | Torboy | 31.28% | 1.21%(+30.1)#1 | 0.49%(+30.8)#27 |
| 2. | South Creek | 12.49% | 1.21%(+11.3)#2 | 0.49%(+12.0)#110 |
| 3. | Kingston | 10.77% | 1.21%(+9.56)#3 | 0.49%(+10.3)#129 |
| 4. | Anderson Island | 8.51% | 1.21%(+7.30)#4 | 0.49%(+8.03)#164 |
| 5. | Oakesdale | 7.73% | 1.21%(+6.52)#5 | 0.49%(+7.24)#177 |
| 6. | Eschbach | 6.70% | 1.21%(+5.49)#6 | 0.49%(+6.21)#207 |
| 7. | Baring | 5.34% | 1.21%(+4.13)#7 | 0.49%(+4.85)#263 |
| 8. | Port Angeles East | 5.30% | 1.21%(+4.09)#8 | 0.49%(+4.82)#266 |
| 9. | East Port Orchard | 5.13% | 1.21%(+3.92)#9 | 0.49%(+4.64)#276 |
| 10. | Hunts Point | 4.95% | 1.21%(+3.74)#10 | 0.49%(+4.47)#283 |
| 11. | Naselle | 4.61% | 1.21%(+3.40)#11 | 0.49%(+4.12)#301 |
| 12. | Port Orchard | 4.48% | 1.21%(+3.26)#12 | 0.49%(+3.99)#308 |
| 13. | Mercer Island | 4.41% | 1.21%(+3.20)#13 | 0.49%(+3.92)#316 |
| 14. | Tehaleh | 4.34% | 1.21%(+3.13)#14 | 0.49%(+3.86)#320 |
| 15. | Fairchild Afb | 4.27% | 1.21%(+3.06)#15 | 0.49%(+3.78)#328 |
| 16. | Ames Lake | 4.24% | 1.21%(+3.03)#16 | 0.49%(+3.75)#330 |
| 17. | Newcastle | 4.15% | 1.21%(+2.93)#17 | 0.49%(+3.66)#339 |
| 18. | Rockford | 3.95% | 1.21%(+2.74)#18 | 0.49%(+3.47)#355 |
| 19. | Grand Mound | 3.72% | 1.21%(+2.51)#19 | 0.49%(+3.23)#369 |
| 20. | Bellevue | 3.65% | 1.21%(+2.44)#20 | 0.49%(+3.17)#372 |
| 21. | Maplewood | 3.59% | 1.21%(+2.38)#21 | 0.49%(+3.10)#375 |
| 22. | Cascade Valley | 3.53% | 1.21%(+2.32)#22 | 0.49%(+3.04)#385 |
| 23. | Mill Creek | 3.23% | 1.21%(+2.02)#23 | 0.49%(+2.74)#418 |
| 24. | Lake Forest Park | 3.19% | 1.21%(+1.98)#24 | 0.49%(+2.70)#428 |
| 25. | Ruston | 3.07% | 1.21%(+1.86)#25 | 0.49%(+2.58)#441 |
| 26. | Chewelah | 3.07% | 1.21%(+1.86)#26 | 0.49%(+2.58)#442 |
| 27. | Duvall | 3.01% | 1.21%(+1.80)#27 | 0.49%(+2.53)#456 |
| 28. | Woods Creek | 3.01% | 1.21%(+1.80)#28 | 0.49%(+2.52)#459 |
| 29. | Marietta Alderwood | 2.97% | 1.21%(+1.75)#29 | 0.49%(+2.48)#465 |
| 30. | Mirrormont | 2.93% | 1.21%(+1.71)#30 | 0.49%(+2.44)#470 |
| 31. | Steilacoom | 2.81% | 1.21%(+1.60)#31 | 0.49%(+2.33)#492 |
| 32. | Silverdale | 2.81% | 1.21%(+1.59)#32 | 0.49%(+2.32)#496 |
| 33. | Manchester | 2.78% | 1.21%(+1.57)#33 | 0.49%(+2.30)#499 |
| 34. | Bothell West | 2.78% | 1.21%(+1.57)#34 | 0.49%(+2.29)#500 |
| 35. | Fords Prairie | 2.78% | 1.21%(+1.57)#35 | 0.49%(+2.29)#503 |
| 36. | Bell Hill | 2.78% | 1.21%(+1.57)#36 | 0.49%(+2.29)#504 |
| 37. | Mukilteo | 2.78% | 1.21%(+1.56)#37 | 0.49%(+2.29)#505 |
| 38. | Parkwood | 2.77% | 1.21%(+1.55)#38 | 0.49%(+2.28)#510 |
| 39. | Bryn Mawr Skyway | 2.74% | 1.21%(+1.53)#39 | 0.49%(+2.25)#514 |
| 40. | Issaquah | 2.74% | 1.21%(+1.53)#40 | 0.49%(+2.25)#515 |
| 41. | Pacific | 2.73% | 1.21%(+1.52)#41 | 0.49%(+2.25)#517 |
| 42. | Granite Falls | 2.63% | 1.21%(+1.42)#42 | 0.49%(+2.14)#541 |
| 43. | West Pasco | 2.62% | 1.21%(+1.41)#43 | 0.49%(+2.13)#543 |
| 44. | Alderwood Manor | 2.61% | 1.21%(+1.40)#44 | 0.49%(+2.13)#547 |
| 45. | Woodinville | 2.59% | 1.21%(+1.38)#45 | 0.49%(+2.10)#552 |
| 46. | Gold Bar | 2.48% | 1.21%(+1.27)#46 | 0.49%(+1.99)#579 |
| 47. | Zillah | 2.44% | 1.21%(+1.23)#47 | 0.49%(+1.95)#590 |
| 48. | Erlands Point | 2.37% | 1.21%(+1.15)#48 | 0.49%(+1.88)#615 |
| 49. | Bothell | 2.36% | 1.21%(+1.15)#49 | 0.49%(+1.87)#618 |
| 50. | Maple Heights Lake Desire | 2.36% | 1.21%(+1.15)#50 | 0.49%(+1.87)#619 |
| 51. | Beaux Arts Village | 2.33% | 1.21%(+1.11)#51 | 0.49%(+1.84)#626 |
| 52. | Shadow Lake | 2.27% | 1.21%(+1.06)#52 | 0.49%(+1.78)#646 |
| 53. | Seattle | 2.25% | 1.21%(+1.04)#53 | 0.49%(+1.77)#660 |
| 54. | Tracyton | 2.24% | 1.21%(+1.03)#54 | 0.49%(+1.76)#665 |
| 55. | Bangor Base | 2.23% | 1.21%(+1.02)#55 | 0.49%(+1.75)#667 |
| 56. | Fairwood Cdp King County | 2.23% | 1.21%(+1.02)#56 | 0.49%(+1.74)#668 |
| 57. | Milton | 2.18% | 1.21%(+0.966)#57 | 0.49%(+1.69)#695 |
| 58. | Meadowdale | 2.17% | 1.21%(+0.959)#58 | 0.49%(+1.68)#698 |
| 59. | Cottage Lake | 2.13% | 1.21%(+0.924)#59 | 0.49%(+1.65)#714 |
| 60. | Coupeville | 2.11% | 1.21%(+0.897)#60 | 0.49%(+1.62)#726 |
| 61. | Pullman | 2.09% | 1.21%(+0.878)#61 | 0.49%(+1.60)#734 |
| 62. | North Lynnwood | 2.05% | 1.21%(+0.840)#62 | 0.49%(+1.56)#753 |
| 63. | Brier | 2.05% | 1.21%(+0.838)#63 | 0.49%(+1.56)#754 |
| 64. | Spanaway | 2.01% | 1.21%(+0.797)#64 | 0.49%(+1.52)#768 |
| 65. | Shoreline | 2.00% | 1.21%(+0.790)#65 | 0.49%(+1.51)#770 |
| 66. | Parkland | 1.98% | 1.21%(+0.766)#66 | 0.49%(+1.49)#781 |
| 67. | Lynnwood | 1.97% | 1.21%(+0.763)#67 | 0.49%(+1.49)#783 |
| 68. | Maltby | 1.95% | 1.21%(+0.736)#68 | 0.49%(+1.46)#794 |
| 69. | Cashmere | 1.94% | 1.21%(+0.731)#69 | 0.49%(+1.45)#798 |
| 70. | Entiat | 1.93% | 1.21%(+0.716)#70 | 0.49%(+1.44)#802 |
| 71. | Ashford | 1.93% | 1.21%(+0.715)#71 | 0.49%(+1.44)#803 |
| 72. | Seabeck | 1.89% | 1.21%(+0.682)#72 | 0.49%(+1.41)#813 |
| 73. | Dupont | 1.89% | 1.21%(+0.677)#73 | 0.49%(+1.40)#818 |
| 74. | Morton | 1.88% | 1.21%(+0.664)#74 | 0.49%(+1.39)#829 |
| 75. | La Center | 1.85% | 1.21%(+0.634)#75 | 0.49%(+1.36)#849 |
| 76. | Jamestown | 1.84% | 1.21%(+0.629)#76 | 0.49%(+1.35)#854 |
| 77. | Camas | 1.83% | 1.21%(+0.619)#77 | 0.49%(+1.34)#860 |
| 78. | Redmond | 1.83% | 1.21%(+0.619)#78 | 0.49%(+1.34)#862 |
| 79. | Edmonds | 1.81% | 1.21%(+0.604)#79 | 0.49%(+1.33)#871 |
| 80. | Union Hill Novelty Hill | 1.81% | 1.21%(+0.597)#80 | 0.49%(+1.32)#877 |
| 81. | Crocker | 1.81% | 1.21%(+0.595)#81 | 0.49%(+1.32)#879 |
| 82. | Ellensburg | 1.80% | 1.21%(+0.594)#82 | 0.49%(+1.32)#880 |
| 83. | Kirkland | 1.79% | 1.21%(+0.582)#83 | 0.49%(+1.31)#888 |
| 84. | Buckley | 1.79% | 1.21%(+0.580)#84 | 0.49%(+1.30)#889 |
| 85. | Latah | 1.79% | 1.21%(+0.575)#85 | 0.49%(+1.30)#892 |
| 86. | Ferndale | 1.78% | 1.21%(+0.567)#86 | 0.49%(+1.29)#896 |
| 87. | Point Roberts | 1.76% | 1.21%(+0.550)#87 | 0.49%(+1.27)#912 |
| 88. | North Yelm | 1.76% | 1.21%(+0.548)#88 | 0.49%(+1.27)#914 |
| 89. | Purdy | 1.76% | 1.21%(+0.547)#89 | 0.49%(+1.27)#917 |
| 90. | Tacoma | 1.75% | 1.21%(+0.542)#90 | 0.49%(+1.27)#919 |
| 91. | Birch Bay | 1.74% | 1.21%(+0.530)#91 | 0.49%(+1.25)#925 |
| 92. | South Hill | 1.74% | 1.21%(+0.525)#92 | 0.49%(+1.25)#929 |
| 93. | Bremerton | 1.73% | 1.21%(+0.519)#93 | 0.49%(+1.24)#932 |
| 94. | Clinton | 1.72% | 1.21%(+0.506)#94 | 0.49%(+1.23)#941 |
| 95. | Connell | 1.70% | 1.21%(+0.489)#95 | 0.49%(+1.21)#949 |
| 96. | Silver Firs | 1.70% | 1.21%(+0.485)#96 | 0.49%(+1.21)#953 |
| 97. | Mill Creek East | 1.70% | 1.21%(+0.484)#97 | 0.49%(+1.21)#955 |
| 98. | Sammamish | 1.65% | 1.21%(+0.439)#98 | 0.49%(+1.16)#997 |
| 99. | Colfax | 1.64% | 1.21%(+0.432)#99 | 0.49%(+1.16)#1,000 |
| 100. | Kenmore | 1.63% | 1.21%(+0.419)#100 | 0.49%(+1.14)#1,012 |
Common Questions
What are the Top 10 Cities with the Highest Percentage of Bhutanese Population in Washington?
Top 10 Cities with the Highest Percentage of Bhutanese Population in Washington are:
#1
31.28%
#2
12.49%
#3
10.77%
#4
8.51%
#5
7.73%
#6
6.70%
#7
5.34%
#8
5.30%
#9
5.13%
#10
4.95%
What city has the Highest Percentage of Bhutanese Population in Washington?
Torboy has the Highest Percentage of Bhutanese Population in Washington with 31.28%.
What is the Percentage of Bhutanese Population in the State of Washington?
Percentage of Bhutanese Population in Washington is 1.21%.
What is the Percentage of Bhutanese Population in the United States?
Percentage of Bhutanese Population in the United States is 0.49%.