Cities with the Largest Inupiat Community in Washington

RELATED REPORTS & OPTIONS

Inupiat
Population
Families and Households
Female Fertility
Female Fertility (Unmarried)
Race (Community Size)
Race (Percentage)
Ancestry (Community Size)
AfghanAfricanAlaska NativeAlaskan AthabascanAlbanianAleutAlsatianAmericanApacheArabArapahoArgentineanArmenianAssyrian / Chaldean / SyriacAustralianAustrianBahamianBangladeshiBarbadianBasqueBelgianBelizeanBermudanBhutaneseBlackfeetBolivianBrazilianBritishBritish West IndianBulgarianBurmeseCajunCambodianCanadianCape VerdeanCarpatho RusynCelticCentral AmericanCentral American IndianCherokeeCheyenneChickasawChileanChineseChippewaChoctawColombianColvilleComancheCosta RicanCreeCreekCroatianCrowCubanCypriotCzechCzechoslovakianDanishDelawareDominicanDutchDutch West IndianEastern EuropeanEcuadorianEgyptianEnglishEstonianEthiopianEuropeanFijianFilipinoFinnishFrenchFrench American IndianFrench CanadianGermanGerman RussianGhanaianGreekGuamanian / ChamorroGuatemalanGuyaneseHaitianHmongHonduranHopiHoumaHungarianIcelanderIndian (Asian)IndonesianInupiatIranianIraqiIrishIroquoisIsraeliItalianJamaicanJapaneseJordanianKenyanKiowaKoreanLaotianLatvianLebaneseLiberianLithuanianLumbeeLuxembourgerMacedonianMalaysianMalteseMarshalleseMenomineeMexicanMexican American IndianMongolianMoroccanNative HawaiianNavajoNepaleseNew ZealanderNicaraguanNigerianNorthern EuropeanNorwegianOkinawanOsageOttawaPaiutePakistaniPalestinianPanamanianParaguayanPennsylvania GermanPeruvianPimaPolishPortuguesePotawatomiPuebloPuerto RicanPuget Sound SalishRomanianRussianSalvadoranSamoanScandinavianScotch-IrishScottishSeminoleSenegaleseSerbianShoshoneSierra LeoneanSiouxSlavicSlovakSloveneSomaliSouth AfricanSouth AmericanSouth American IndianSoviet UnionSpaniardSpanishSpanish AmericanSpanish American IndianSri LankanSubsaharan AfricanSudaneseSwedishSwissSyrianTaiwaneseThaiTlingit-HaidaTohono O'OdhamTonganTrinidadian and TobagonianTsimshianTurkishU.S. Virgin IslanderUgandanUkrainianUruguayanUteVenezuelanVietnameseWelshWest IndianYakamaYaquiYugoslavianYumanYup'ikZimbabwean
Ancestry (Percentage)
AfghanAfricanAlaska NativeAlaskan AthabascanAlbanianAleutAlsatianAmericanApacheArabArapahoArgentineanArmenianAssyrian / Chaldean / SyriacAustralianAustrianBahamianBangladeshiBarbadianBasqueBelgianBelizeanBermudanBhutaneseBlackfeetBolivianBrazilianBritishBritish West IndianBulgarianBurmeseCajunCambodianCanadianCape VerdeanCarpatho RusynCelticCentral AmericanCentral American IndianCherokeeCheyenneChickasawChileanChineseChippewaChoctawColombianColvilleComancheCosta RicanCreeCreekCroatianCrowCubanCypriotCzechCzechoslovakianDanishDelawareDominicanDutchDutch West IndianEastern EuropeanEcuadorianEgyptianEnglishEstonianEthiopianEuropeanFijianFilipinoFinnishFrenchFrench American IndianFrench CanadianGermanGerman RussianGhanaianGreekGuamanian / ChamorroGuatemalanGuyaneseHaitianHmongHonduranHopiHoumaHungarianIcelanderIndian (Asian)IndonesianInupiatIranianIraqiIrishIroquoisIsraeliItalianJamaicanJapaneseJordanianKenyanKiowaKoreanLaotianLatvianLebaneseLiberianLithuanianLumbeeLuxembourgerMacedonianMalaysianMalteseMarshalleseMenomineeMexicanMexican American IndianMongolianMoroccanNative HawaiianNavajoNepaleseNew ZealanderNicaraguanNigerianNorthern EuropeanNorwegianOkinawanOsageOttawaPaiutePakistaniPalestinianPanamanianParaguayanPennsylvania GermanPeruvianPimaPolishPortuguesePotawatomiPuebloPuerto RicanPuget Sound SalishRomanianRussianSalvadoranSamoanScandinavianScotch-IrishScottishSeminoleSenegaleseSerbianShoshoneSierra LeoneanSiouxSlavicSlovakSloveneSomaliSouth AfricanSouth AmericanSouth American IndianSoviet UnionSpaniardSpanishSpanish AmericanSpanish American IndianSri LankanSubsaharan AfricanSudaneseSwedishSwissSyrianTaiwaneseThaiTlingit-HaidaTohono O'OdhamTonganTrinidadian and TobagonianTsimshianTurkishU.S. Virgin IslanderUgandanUkrainianUruguayanUteVenezuelanVietnameseWelshWest IndianYakamaYaquiYugoslavianYumanYup'ikZimbabwean
Immigrant Origin (Total)
AfghanistanAfricaAlbaniaArgentinaArmeniaAsiaAustraliaAustriaAzoresBahamasBangladeshBarbadosBelarusBelgiumBelizeBoliviaBosnia and HerzegovinaBrazilBulgariaBurma / MyanmarCabo VerdeCambodiaCameroonCanadaCaribbeanCentral AmericaChileChinaColombiaCongoCosta RicaCroatiaCubaCzechoslovakiaDenmarkDominicaDominican RepublicEastern AfricaEastern AsiaEastern EuropeEcuadorEgyptEl SalvadorEnglandEritreaEthiopiaEuropeFijiFranceGermanyGhanaGreeceGrenadaGuatemalaGuyanaHaitiHondurasHong KongHungaryIndiaIndonesiaIranIraqIrelandIsraelItalyJamaicaJapanJordanKazakhstanKenyaKoreaKuwaitLaosLatin AmericaLatviaLebanonLiberiaLithuaniaMalaysiaMexicoMicronesiaMiddle AfricaMoldovaMoroccoNepalNetherlandsNicaraguaNigeriaNorth MacedoniaNorthern AfricaNorthern EuropeNorwayOceaniaPakistanPanamaPeruPhilippinesPolandPortugalRomaniaRussiaSaudi ArabiaScotlandSenegalSerbiaSierra LeoneSingaporeSomaliaSouth AfricaSouth AmericaSouth Central AsiaSouth Eastern AsiaSouthern EuropeSpainSri LankaSt. Vincent and the GrenadinesSudanSwedenSwitzerlandSyriaTaiwanThailandTrinidad and TobagoTurkeyUgandaUkraineUruguayUzbekistanVenezuelaVietnamWest IndiesWestern AfricaWestern AsiaWestern EuropeYemenZaireZimbabwe
Immigrant Origin (Percentage)
AfghanistanAfricaAlbaniaArgentinaArmeniaAsiaAustraliaAustriaAzoresBahamasBangladeshBarbadosBelarusBelgiumBelizeBoliviaBosnia and HerzegovinaBrazilBulgariaBurma / MyanmarCabo VerdeCambodiaCameroonCanadaCaribbeanCentral AmericaChileChinaColombiaCongoCosta RicaCroatiaCubaCzechoslovakiaDenmarkDominicaDominican RepublicEastern AfricaEastern AsiaEastern EuropeEcuadorEgyptEl SalvadorEnglandEritreaEthiopiaEuropeFijiFranceGermanyGhanaGreeceGrenadaGuatemalaGuyanaHaitiHondurasHong KongHungaryIndiaIndonesiaIranIraqIrelandIsraelItalyJamaicaJapanJordanKazakhstanKenyaKoreaKuwaitLaosLatin AmericaLatviaLebanonLiberiaLithuaniaMalaysiaMexicoMicronesiaMiddle AfricaMoldovaMoroccoNepalNetherlandsNicaraguaNigeriaNorth MacedoniaNorthern AfricaNorthern EuropeNorwayOceaniaPakistanPanamaPeruPhilippinesPolandPortugalRomaniaRussiaSaudi ArabiaScotlandSenegalSerbiaSierra LeoneSingaporeSomaliaSouth AfricaSouth AmericaSouth Central AsiaSouth Eastern AsiaSouthern EuropeSpainSri LankaSt. Vincent and the GrenadinesSudanSwedenSwitzerlandSyriaTaiwanThailandTrinidad and TobagoTurkeyUgandaUkraineUruguayUzbekistanVenezuelaVietnamWest IndiesWestern AfricaWestern AsiaWestern EuropeYemenZaireZimbabwe
Income
Income (Families)
Income (Households)
Poverty
Poverty (Families)
Unemployment
Employment Occupations
Employment Industries
Employer Class
Commute Time
Commute Means
School Enrollment
Education by Degree Field
Occupancy
Finances
Physical Characteristics
Washington
Compare Cities
Comparison Subject

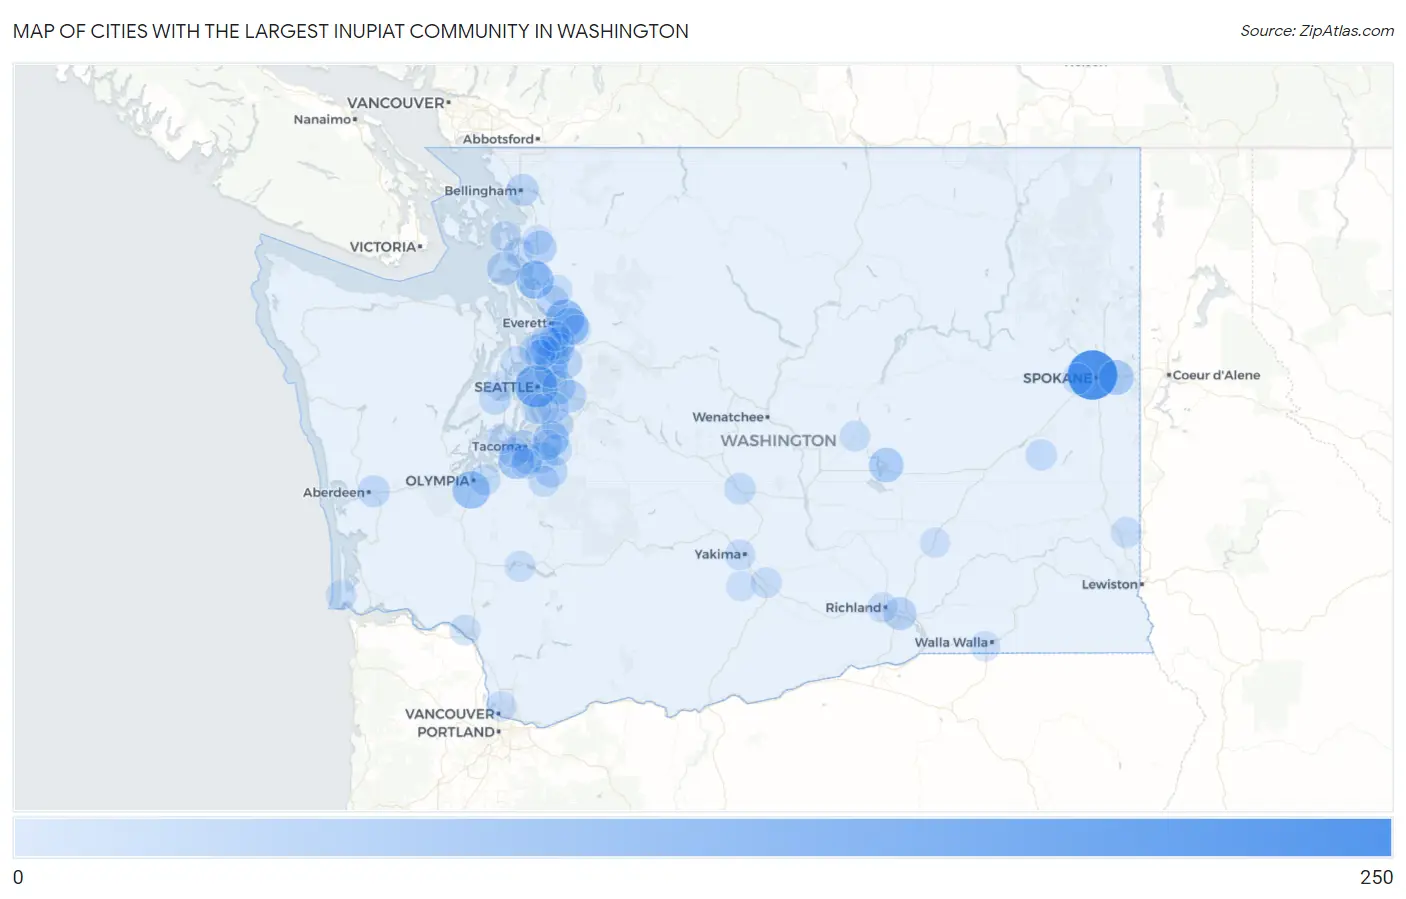
Map of Cities with the Largest Inupiat Community in Washington

0
250
Cities with the Largest Inupiat Community in Washington Map

Cities with the Largest Inupiat Community in Washington

City Inupiat vs State vs National
1.Spokane2091,927(10.85%)#146,707(0.45%)#34
2.Seattle1281,927(6.64%)#246,707(0.27%)#58
3.Lake Stevens851,927(4.41%)#346,707(0.18%)#81
4.Stanwood781,927(4.05%)#446,707(0.17%)#89
5.Tumwater761,927(3.94%)#546,707(0.16%)#93
6.Everett711,927(3.68%)#646,707(0.15%)#99
7.Auburn561,927(2.91%)#746,707(0.12%)#119
8.Lakewood561,927(2.91%)#846,707(0.12%)#120
9.Spokane Valley521,927(2.70%)#946,707(0.11%)#126
10.Moses Lake451,927(2.34%)#1046,707(0.10%)#145
11.Bothell411,927(2.13%)#1146,707(0.09%)#157
12.Oak Harbor361,927(1.87%)#1246,707(0.08%)#177
13.Bellevue341,927(1.76%)#1346,707(0.07%)#181
14.Kirkland331,927(1.71%)#1446,707(0.07%)#187
15.Mount Vernon331,927(1.71%)#1546,707(0.07%)#189
16.Pasco301,927(1.56%)#1646,707(0.06%)#203
17.Fairwood Cdp King County281,927(1.45%)#1746,707(0.06%)#212
18.Issaquah251,927(1.30%)#1846,707(0.05%)#225
19.Mill Creek251,927(1.30%)#1946,707(0.05%)#226
20.Orting251,927(1.30%)#2046,707(0.05%)#230
21.Tacoma231,927(1.19%)#2146,707(0.05%)#250
22.Bellingham231,927(1.19%)#2246,707(0.05%)#251
23.Silver Firs231,927(1.19%)#2346,707(0.05%)#254
24.Cottage Lake221,927(1.14%)#2446,707(0.05%)#263
25.Bremerton201,927(1.04%)#2546,707(0.04%)#275
26.Lynnwood191,927(0.99%)#2646,707(0.04%)#289
27.Aberdeen191,927(0.99%)#2746,707(0.04%)#292
28.Marysville181,927(0.93%)#2846,707(0.04%)#296
29.Kent171,927(0.88%)#2946,707(0.04%)#303
30.Puyallup161,927(0.83%)#3046,707(0.03%)#324
31.Lake Tapps151,927(0.78%)#3146,707(0.03%)#340
32.Ellensburg141,927(0.73%)#3246,707(0.03%)#356
33.Clearview141,927(0.73%)#3346,707(0.03%)#361
34.Airway Heights121,927(0.62%)#3446,707(0.03%)#385
35.Midland121,927(0.62%)#3546,707(0.03%)#387
36.Lamont121,927(0.62%)#3646,707(0.03%)#395
37.Lacey111,927(0.57%)#3746,707(0.02%)#400
38.Renton101,927(0.52%)#3846,707(0.02%)#415
39.Edmonds101,927(0.52%)#3946,707(0.02%)#420
40.Graham101,927(0.52%)#4046,707(0.02%)#423
41.Suncrest101,927(0.52%)#4146,707(0.02%)#429
42.Pullman91,927(0.47%)#4246,707(0.02%)#452
43.Mossyrock91,927(0.47%)#4346,707(0.02%)#463
44.Longview81,927(0.42%)#4446,707(0.02%)#475
45.Ephrata81,927(0.42%)#4546,707(0.02%)#479
46.Yakima71,927(0.36%)#4646,707(0.01%)#496
47.Tukwila71,927(0.36%)#4746,707(0.01%)#503
48.Buena71,927(0.36%)#4846,707(0.01%)#513
49.University Place61,927(0.31%)#4946,707(0.01%)#530
50.Artondale61,927(0.31%)#5046,707(0.01%)#536
51.Tracyton61,927(0.31%)#5146,707(0.01%)#539
52.Three Lakes61,927(0.31%)#5246,707(0.01%)#542
53.Richland51,927(0.26%)#5346,707(0.01%)#554
54.Burien51,927(0.26%)#5446,707(0.01%)#556
55.Parkland51,927(0.26%)#5546,707(0.01%)#558
56.Lake Stickney51,927(0.26%)#5646,707(0.01%)#564
57.Alderwood Manor51,927(0.26%)#5746,707(0.01%)#565
58.Long Beach51,927(0.26%)#5846,707(0.01%)#570
59.Mountlake Terrace41,927(0.21%)#5946,707(0.01%)#583
60.Arlington41,927(0.21%)#6046,707(0.01%)#584
61.Anacortes41,927(0.21%)#6146,707(0.01%)#585
62.College Place41,927(0.21%)#6246,707(0.01%)#588
63.Pacific41,927(0.21%)#6346,707(0.01%)#591
64.Indianola41,927(0.21%)#6446,707(0.01%)#596
65.Eastmont31,927(0.16%)#6546,707(0.01%)#617
66.Hazel Dell31,927(0.16%)#6646,707(0.01%)#619
67.La Conner31,927(0.16%)#6746,707(0.01%)#634
68.Burlington21,927(0.10%)#6846,707(0.00%)#663
69.Connell21,927(0.10%)#6946,707(0.00%)#667
70.Harrah11,927(0.05%)#7046,707(0.00%)#715
71.Northwest Stanwood11,927(0.05%)#7146,707(0.00%)#727

Common Questions

What are the Top 10 Cities with the Largest Inupiat Community in Washington?
Top 10 Cities with the Largest Inupiat Community in Washington are:
What city has the Largest Inupiat Community in Washington?
Spokane has the Largest Inupiat Community in Washington with 209.
What is the Total Inupiat Population in the State of Washington?
Total Inupiat Population in Washington is 1,927.
What is the Total Inupiat Population in the United States?
Total Inupiat Population in the United States is 46,707.