Ocean Shores, WA Map & Demographics
Ocean Shores Map
Ocean Shores Overview
$33,662
PER CAPITA INCOME
$69,948
AVG FAMILY INCOME
$54,435
AVG HOUSEHOLD INCOME
10.9%
WAGE / INCOME GAP [ % ]
89.1¢/ $1
WAGE / INCOME GAP [ $ ]
0.36
INEQUALITY / GINI INDEX
6,838
TOTAL POPULATION
3,311
MALE POPULATION
3,527
FEMALE POPULATION
93.88
MALES / 100 FEMALES
106.52
FEMALES / 100 MALES
62.1
MEDIAN AGE
2.3
AVG FAMILY SIZE
1.9
AVG HOUSEHOLD SIZE
2,357
LABOR FORCE [ PEOPLE ]
36.5%
PERCENT IN LABOR FORCE
5.3%
UNEMPLOYMENT RATE
Ocean Shores Zip Codes
Ocean Shores Area Codes
Income in Ocean Shores
Income Overview in Ocean Shores
Per Capita Income in Ocean Shores is $33,662, while median incomes of families and households are $69,948 and $54,435 respectively.
| Characteristic | Number | Measure |
| Per Capita Income | 6,838 | $33,662 |
| Median Family Income | 2,192 | $69,948 |
| Mean Family Income | 2,192 | $74,918 |
| Median Household Income | 3,587 | $54,435 |
| Mean Household Income | 3,587 | $63,996 |
| Income Deficit | 2,192 | $0 |
| Wage / Income Gap (%) | 6,838 | 10.90% |
| Wage / Income Gap ($) | 6,838 | 89.10¢ per $1 |
| Gini / Inequality Index | 6,838 | 0.36 |
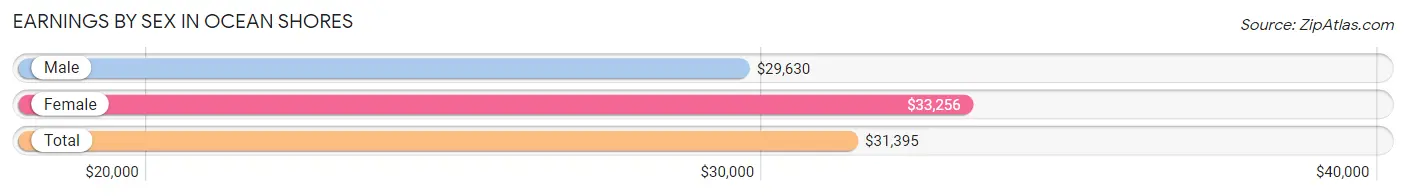
Earnings by Sex in Ocean Shores
Average Earnings in Ocean Shores are $31,395, $29,630 for men and $33,256 for women, a difference of 10.9%.
| Sex | Number | Average Earnings |
| Male | 1,237 (47.4%) | $29,630 |
| Female | 1,374 (52.6%) | $33,256 |
| Total | 2,611 (100.0%) | $31,395 |
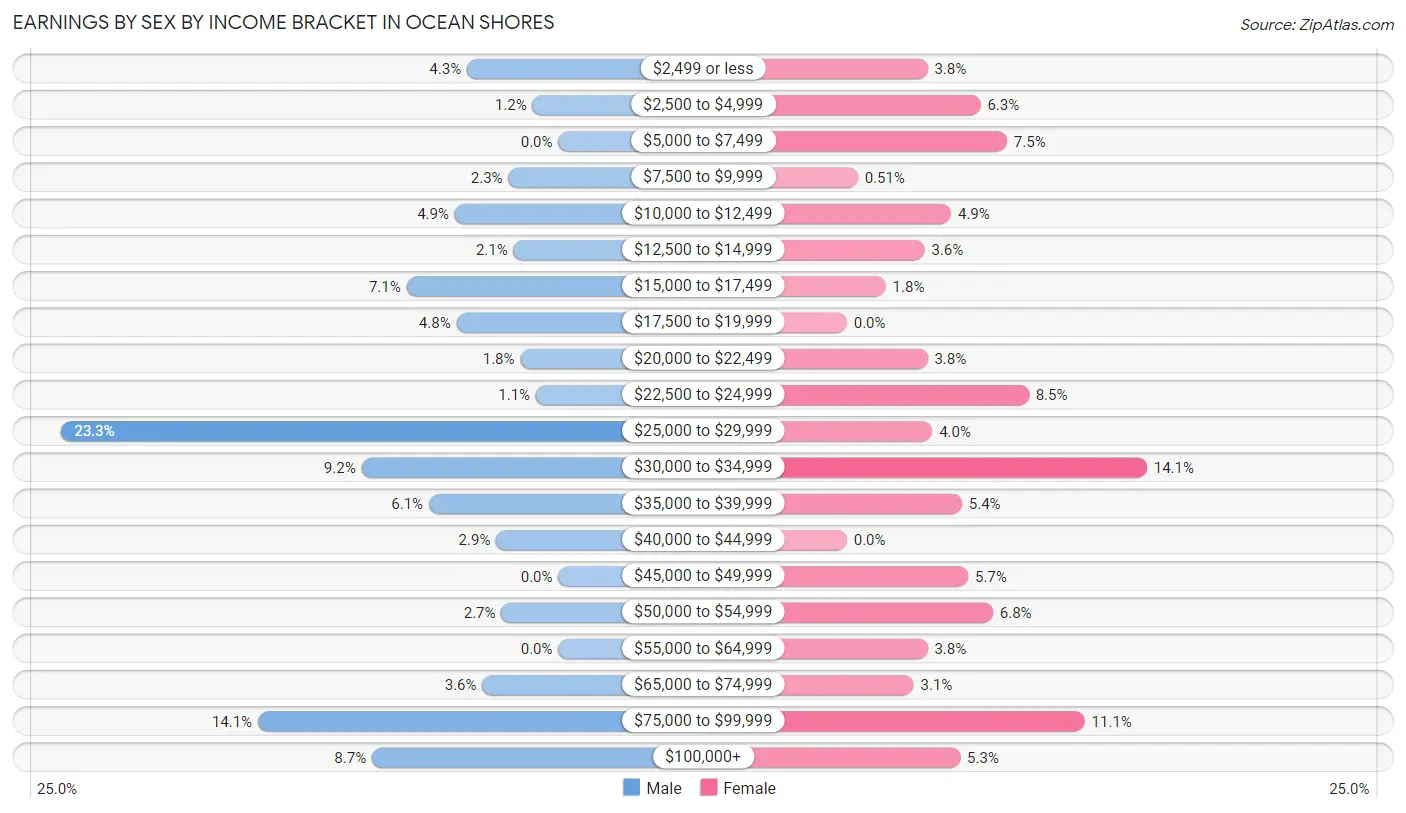
Earnings by Sex by Income Bracket in Ocean Shores
The most common earnings brackets in Ocean Shores are $25,000 to $29,999 for men (288 | 23.3%) and $30,000 to $34,999 for women (193 | 14.1%).
| Income | Male | Female |
| $2,499 or less | 53 (4.3%) | 52 (3.8%) |
| $2,500 to $4,999 | 15 (1.2%) | 86 (6.3%) |
| $5,000 to $7,499 | 0 (0.0%) | 103 (7.5%) |
| $7,500 to $9,999 | 29 (2.3%) | 7 (0.5%) |
| $10,000 to $12,499 | 60 (4.9%) | 67 (4.9%) |
| $12,500 to $14,999 | 26 (2.1%) | 50 (3.6%) |
| $15,000 to $17,499 | 88 (7.1%) | 25 (1.8%) |
| $17,500 to $19,999 | 59 (4.8%) | 0 (0.0%) |
| $20,000 to $22,499 | 22 (1.8%) | 52 (3.8%) |
| $22,500 to $24,999 | 13 (1.1%) | 117 (8.5%) |
| $25,000 to $29,999 | 288 (23.3%) | 55 (4.0%) |
| $30,000 to $34,999 | 114 (9.2%) | 193 (14.1%) |
| $35,000 to $39,999 | 75 (6.1%) | 74 (5.4%) |
| $40,000 to $44,999 | 36 (2.9%) | 0 (0.0%) |
| $45,000 to $49,999 | 0 (0.0%) | 78 (5.7%) |
| $50,000 to $54,999 | 33 (2.7%) | 94 (6.8%) |
| $55,000 to $64,999 | 0 (0.0%) | 52 (3.8%) |
| $65,000 to $74,999 | 44 (3.6%) | 43 (3.1%) |
| $75,000 to $99,999 | 174 (14.1%) | 153 (11.1%) |
| $100,000+ | 108 (8.7%) | 73 (5.3%) |
| Total | 1,237 (100.0%) | 1,374 (100.0%) |
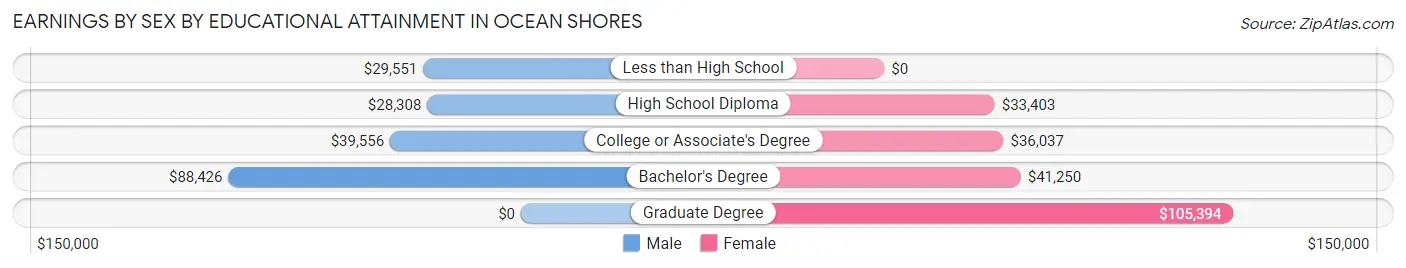
Earnings by Sex by Educational Attainment in Ocean Shores
Average earnings in Ocean Shores are $29,630 for men and $34,266 for women, a difference of 13.5%. Men with an educational attainment of bachelor's degree enjoy the highest average annual earnings of $88,426, while those with high school diploma education earn the least with $28,308. Women with an educational attainment of graduate degree earn the most with the average annual earnings of $105,394, while those with high school diploma education have the smallest earnings of $33,403.
| Educational Attainment | Male Income | Female Income |
| Less than High School | $29,551 | $0 |
| High School Diploma | $28,308 | $33,403 |
| College or Associate's Degree | $39,556 | $36,037 |
| Bachelor's Degree | $88,426 | $41,250 |
| Graduate Degree | - | - |
| Total | $29,630 | $34,266 |
Family Income in Ocean Shores
Family Income Brackets in Ocean Shores
According to the Ocean Shores family income data, there are 623 families falling into the $50,000 to $74,999 income range, which is the most common income bracket and makes up 28.4% of all families. Conversely, the $200,000+ income bracket is the least frequent group with only 28 families (1.3%) belonging to this category.
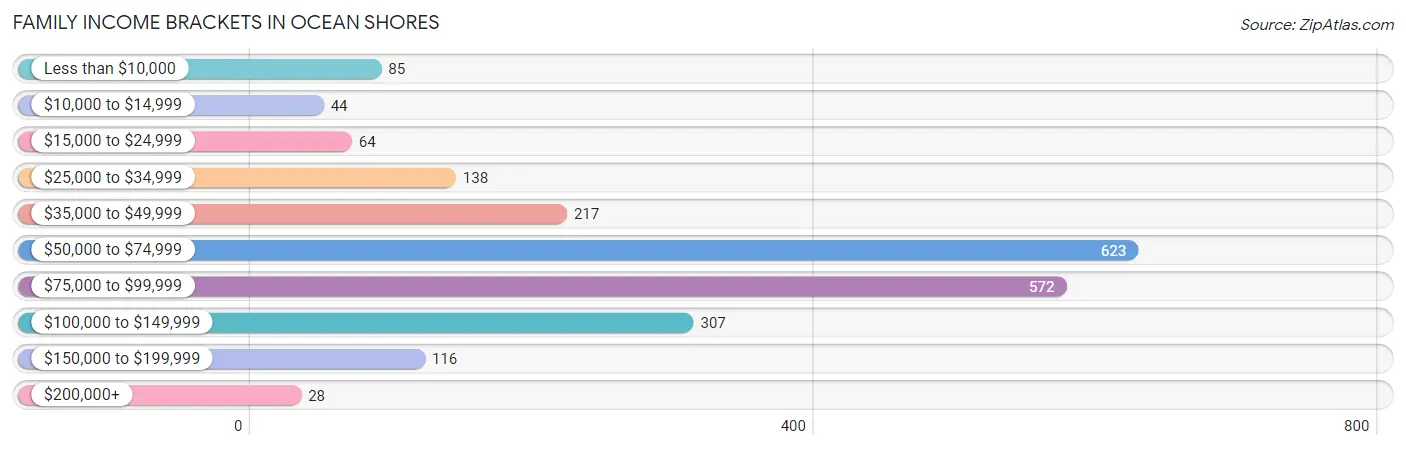
| Income Bracket | # Families | % Families |
| Less than $10,000 | 85 | 3.9% |
| $10,000 to $14,999 | 44 | 2.0% |
| $15,000 to $24,999 | 64 | 2.9% |
| $25,000 to $34,999 | 138 | 6.3% |
| $35,000 to $49,999 | 217 | 9.9% |
| $50,000 to $74,999 | 623 | 28.4% |
| $75,000 to $99,999 | 572 | 26.1% |
| $100,000 to $149,999 | 307 | 14.0% |
| $150,000 to $199,999 | 116 | 5.3% |
| $200,000+ | 28 | 1.3% |
Family Income by Famaliy Size in Ocean Shores
3-person families (254 | 11.6%) account for the highest median family income in Ocean Shores with $77,427 per family, while 2-person families (1,808 | 82.5%) have the highest median income of $30,943 per family member.
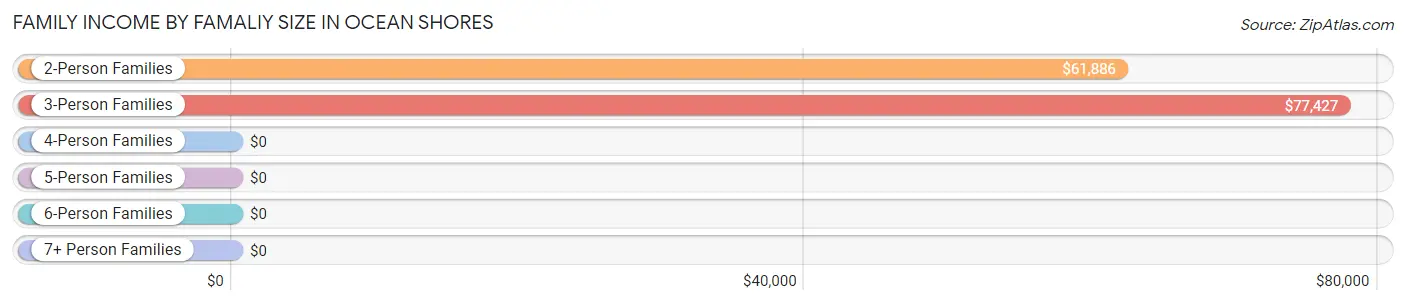
| Income Bracket | # Families | Median Income |
| 2-Person Families | 1,808 (82.5%) | $61,886 |
| 3-Person Families | 254 (11.6%) | $77,427 |
| 4-Person Families | 46 (2.1%) | $0 |
| 5-Person Families | 37 (1.7%) | $0 |
| 6-Person Families | 47 (2.1%) | $0 |
| 7+ Person Families | 0 (0.0%) | $0 |
| Total | 2,192 (100.0%) | $69,948 |
Family Income by Number of Earners in Ocean Shores
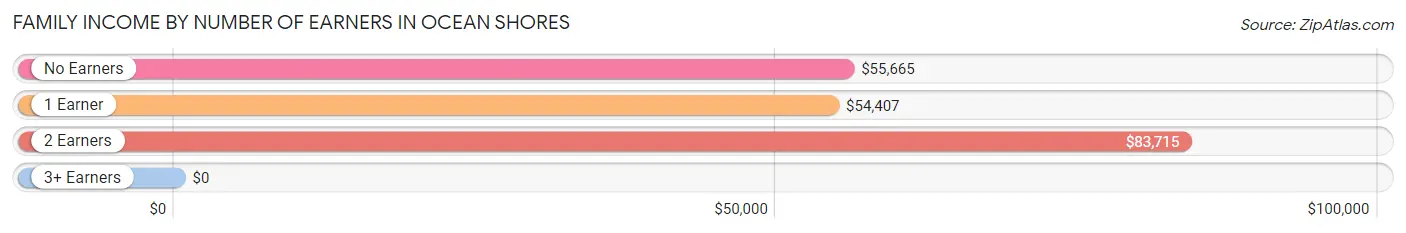
| Number of Earners | # Families | Median Income |
| No Earners | 901 (41.1%) | $55,665 |
| 1 Earner | 676 (30.8%) | $54,407 |
| 2 Earners | 591 (27.0%) | $83,715 |
| 3+ Earners | 24 (1.1%) | $0 |
| Total | 2,192 (100.0%) | $69,948 |
Household Income in Ocean Shores
Household Income Brackets in Ocean Shores
With 854 households falling in the category, the $50,000 to $74,999 income range is the most frequent in Ocean Shores, accounting for 23.8% of all households. In contrast, only 47 households (1.3%) fall into the $200,000+ income bracket, making it the least populous group.
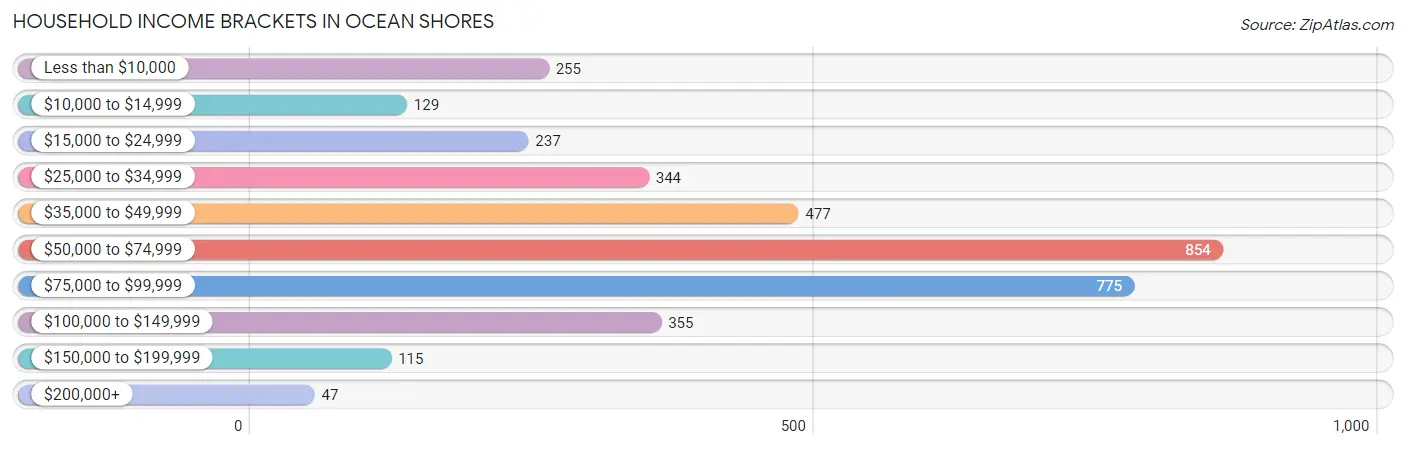
| Income Bracket | # Households | % Households |
| Less than $10,000 | 255 | 7.1% |
| $10,000 to $14,999 | 129 | 3.6% |
| $15,000 to $24,999 | 237 | 6.6% |
| $25,000 to $34,999 | 344 | 9.6% |
| $35,000 to $49,999 | 477 | 13.3% |
| $50,000 to $74,999 | 854 | 23.8% |
| $75,000 to $99,999 | 775 | 21.6% |
| $100,000 to $149,999 | 355 | 9.9% |
| $150,000 to $199,999 | 115 | 3.2% |
| $200,000+ | 47 | 1.3% |
Household Income by Householder Age in Ocean Shores
The median household income in Ocean Shores is $54,435, with the highest median household income of $63,938 found in the 25 to 44 years age bracket for the primary householder. A total of 391 households (10.9%) fall into this category. Meanwhile, the 15 to 24 years age bracket for the primary householder has the lowest median household income of $0, with 21 households (0.6%) in this group.
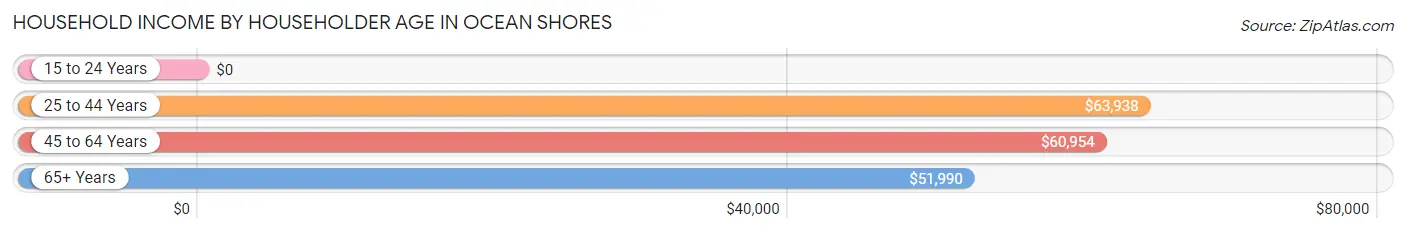
| Income Bracket | # Households | Median Income |
| 15 to 24 Years | 21 (0.6%) | $0 |
| 25 to 44 Years | 391 (10.9%) | $63,938 |
| 45 to 64 Years | 1,450 (40.4%) | $60,954 |
| 65+ Years | 1,725 (48.1%) | $51,990 |
| Total | 3,587 (100.0%) | $54,435 |
Poverty in Ocean Shores
Income Below Poverty by Sex and Age in Ocean Shores
With 10.0% poverty level for males and 13.9% for females among the residents of Ocean Shores, 6 to 11 year old males and 35 to 44 year old females are the most vulnerable to poverty, with 42 males (46.2%) and 108 females (38.7%) in their respective age groups living below the poverty level.
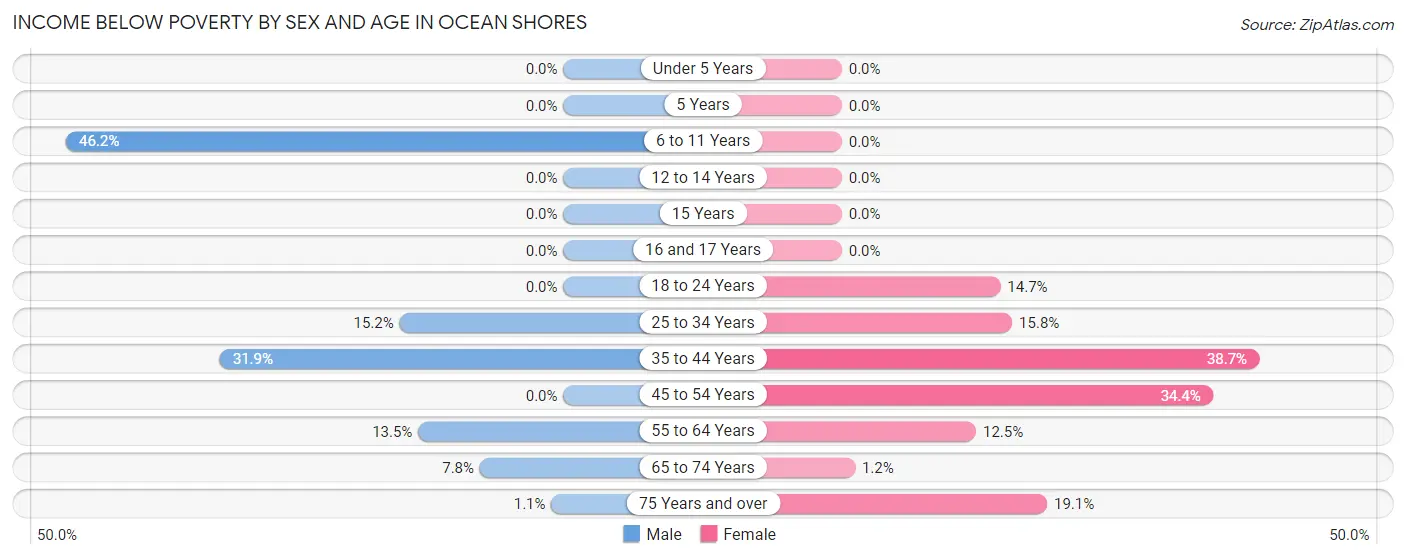
| Age Bracket | Male | Female |
| Under 5 Years | 0 (0.0%) | 0 (0.0%) |
| 5 Years | 0 (0.0%) | 0 (0.0%) |
| 6 to 11 Years | 42 (46.2%) | 0 (0.0%) |
| 12 to 14 Years | 0 (0.0%) | 0 (0.0%) |
| 15 Years | 0 (0.0%) | 0 (0.0%) |
| 16 and 17 Years | 0 (0.0%) | 0 (0.0%) |
| 18 to 24 Years | 0 (0.0%) | 24 (14.7%) |
| 25 to 34 Years | 31 (15.2%) | 46 (15.8%) |
| 35 to 44 Years | 44 (31.9%) | 108 (38.7%) |
| 45 to 54 Years | 0 (0.0%) | 148 (34.4%) |
| 55 to 64 Years | 137 (13.5%) | 82 (12.5%) |
| 65 to 74 Years | 73 (7.7%) | 14 (1.2%) |
| 75 Years and over | 4 (1.1%) | 68 (19.1%) |
| Total | 331 (10.0%) | 490 (13.9%) |
Income Above Poverty by Sex and Age in Ocean Shores
According to the poverty statistics in Ocean Shores, males aged under 5 years and females aged under 5 years are the age groups that are most secure financially, with 100.0% of males and 100.0% of females in these age groups living above the poverty line.
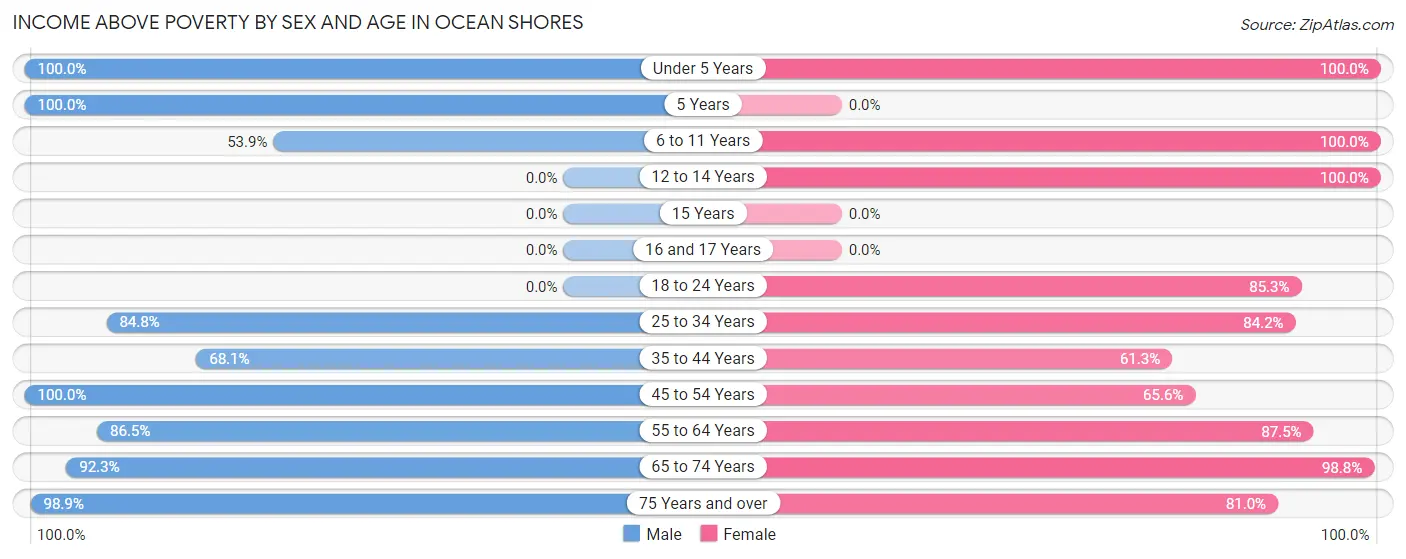
| Age Bracket | Male | Female |
| Under 5 Years | 76 (100.0%) | 109 (100.0%) |
| 5 Years | 10 (100.0%) | 0 (0.0%) |
| 6 to 11 Years | 49 (53.8%) | 75 (100.0%) |
| 12 to 14 Years | 0 (0.0%) | 20 (100.0%) |
| 15 Years | 0 (0.0%) | 0 (0.0%) |
| 16 and 17 Years | 0 (0.0%) | 0 (0.0%) |
| 18 to 24 Years | 0 (0.0%) | 139 (85.3%) |
| 25 to 34 Years | 173 (84.8%) | 245 (84.2%) |
| 35 to 44 Years | 94 (68.1%) | 171 (61.3%) |
| 45 to 54 Years | 472 (100.0%) | 282 (65.6%) |
| 55 to 64 Years | 880 (86.5%) | 576 (87.5%) |
| 65 to 74 Years | 869 (92.2%) | 1,131 (98.8%) |
| 75 Years and over | 357 (98.9%) | 289 (80.9%) |
| Total | 2,980 (90.0%) | 3,037 (86.1%) |
Income Below Poverty Among Married-Couple Families in Ocean Shores
The poverty statistics for married-couple families in Ocean Shores show that 4.4% or 82 of the total 1,859 families live below the poverty line. Families with no children have the highest poverty rate of 4.8%, comprising of 82 families. On the other hand, families with 1 or 2 children have the lowest poverty rate of 0.0%, which includes 0 families.
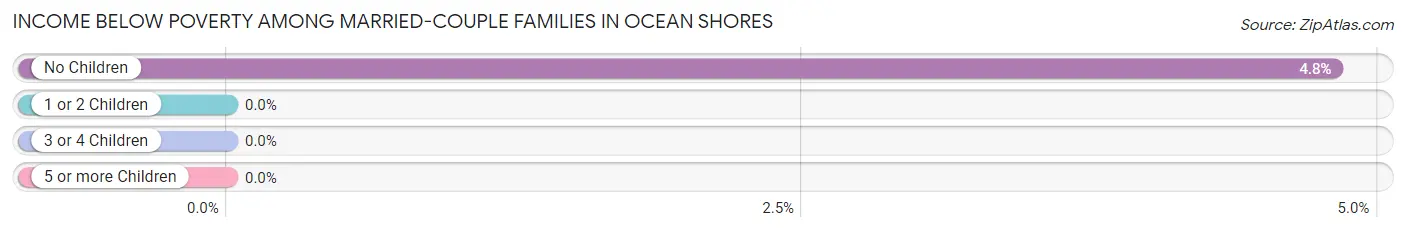
| Children | Above Poverty | Below Poverty |
| No Children | 1,622 (95.2%) | 82 (4.8%) |
| 1 or 2 Children | 155 (100.0%) | 0 (0.0%) |
| 3 or 4 Children | 0 (0.0%) | 0 (0.0%) |
| 5 or more Children | 0 (0.0%) | 0 (0.0%) |
| Total | 1,777 (95.6%) | 82 (4.4%) |
Income Below Poverty Among Single-Parent Households in Ocean Shores
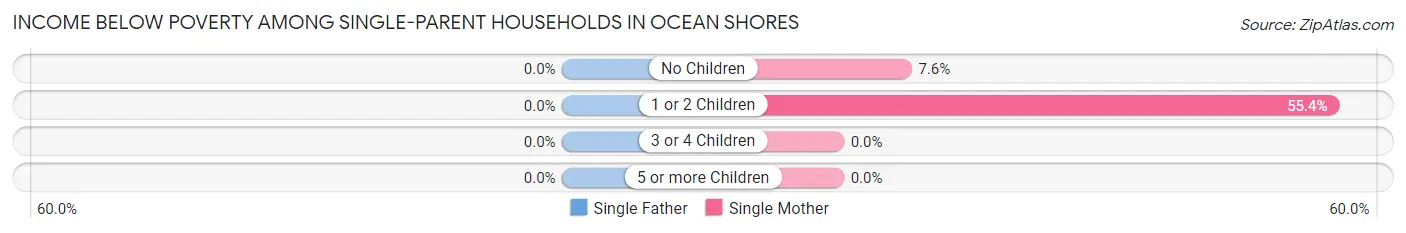
| Children | Single Father | Single Mother |
| No Children | 0 (0.0%) | 10 (7.6%) |
| 1 or 2 Children | 0 (0.0%) | 36 (55.4%) |
| 3 or 4 Children | 0 (0.0%) | 0 (0.0%) |
| 5 or more Children | 0 (0.0%) | 0 (0.0%) |
| Total | 0 (0.0%) | 46 (17.4%) |
Income Below Poverty Among Married-Couple vs Single-Parent Households in Ocean Shores
The poverty data for Ocean Shores shows that 82 of the married-couple family households (4.4%) and 46 of the single-parent households (13.8%) are living below the poverty level. Within the married-couple family households, those with no children have the highest poverty rate, with 82 households (4.8%) falling below the poverty line. Among the single-parent households, those with 1 or 2 children have the highest poverty rate, with 36 household (38.7%) living below poverty.
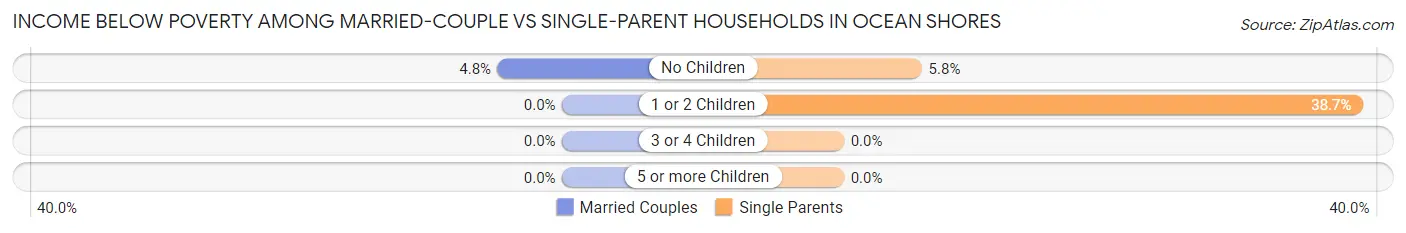
| Children | Married-Couple Families | Single-Parent Households |
| No Children | 82 (4.8%) | 10 (5.8%) |
| 1 or 2 Children | 0 (0.0%) | 36 (38.7%) |
| 3 or 4 Children | 0 (0.0%) | 0 (0.0%) |
| 5 or more Children | 0 (0.0%) | 0 (0.0%) |
| Total | 82 (4.4%) | 46 (13.8%) |
Race in Ocean Shores
The most populous races in Ocean Shores are White / Caucasian (6,037 | 88.3%), Two or more Races (297 | 4.3%), and Native / Alaskan (259 | 3.8%).
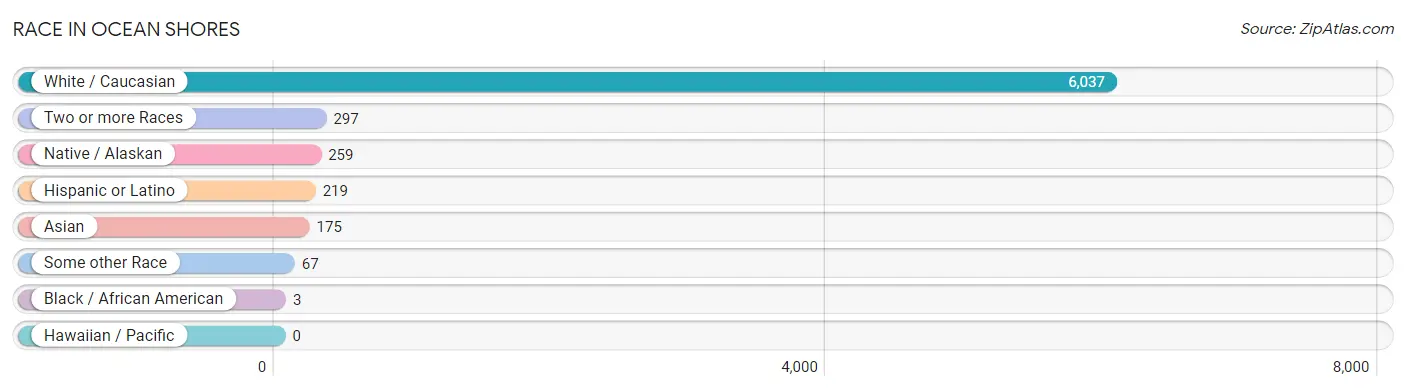
| Race | # Population | % Population |
| Asian | 175 | 2.6% |
| Black / African American | 3 | 0.0% |
| Hawaiian / Pacific | 0 | 0.0% |
| Hispanic or Latino | 219 | 3.2% |
| Native / Alaskan | 259 | 3.8% |
| White / Caucasian | 6,037 | 88.3% |
| Two or more Races | 297 | 4.3% |
| Some other Race | 67 | 1.0% |
| Total | 6,838 | 100.0% |
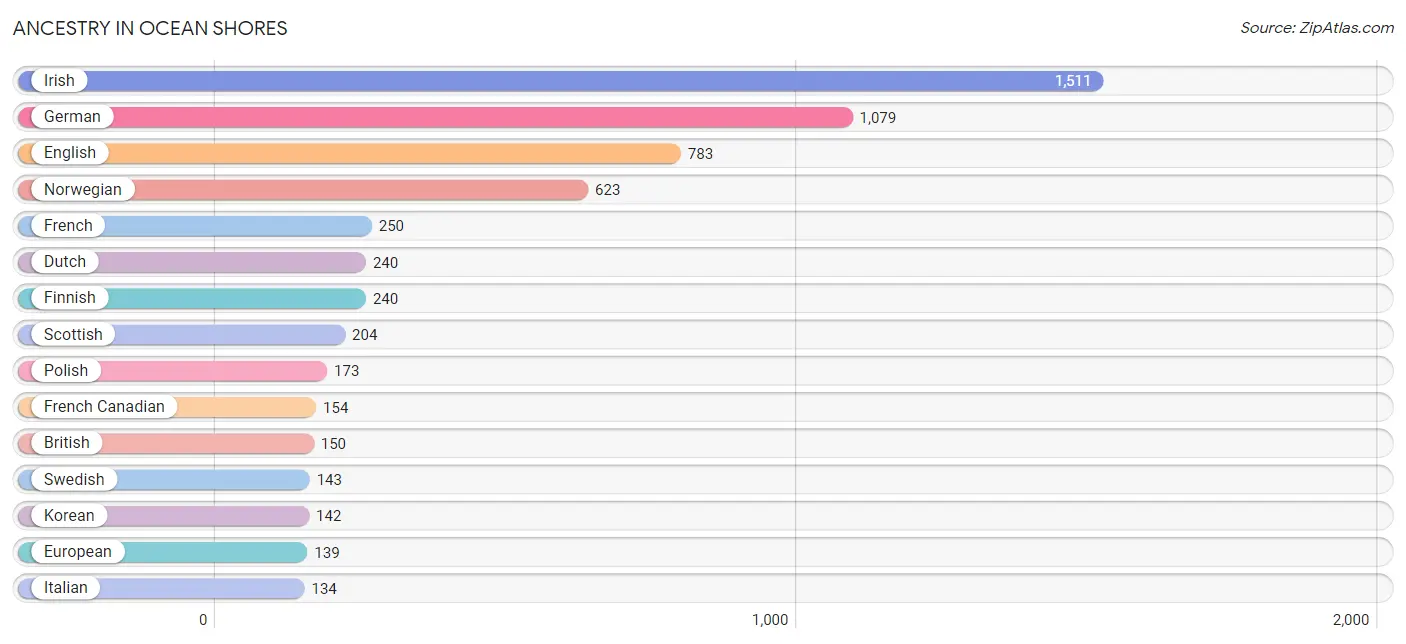
Ancestry in Ocean Shores
The most populous ancestries reported in Ocean Shores are Irish (1,511 | 22.1%), German (1,079 | 15.8%), English (783 | 11.5%), Norwegian (623 | 9.1%), and French (250 | 3.7%), together accounting for 62.1% of all Ocean Shores residents.
| Ancestry | # Population | % Population |
| American | 124 | 1.8% |
| Austrian | 17 | 0.3% |
| Bhutanese | 56 | 0.8% |
| British | 150 | 2.2% |
| Burmese | 20 | 0.3% |
| Cherokee | 19 | 0.3% |
| Cheyenne | 11 | 0.2% |
| Chinese | 43 | 0.6% |
| Croatian | 90 | 1.3% |
| Czech | 3 | 0.0% |
| Danish | 71 | 1.0% |
| Dutch | 240 | 3.5% |
| Eastern European | 57 | 0.8% |
| English | 783 | 11.5% |
| European | 139 | 2.0% |
| Finnish | 240 | 3.5% |
| French | 250 | 3.7% |
| French Canadian | 154 | 2.2% |
| German | 1,079 | 15.8% |
| Greek | 17 | 0.3% |
| Hungarian | 28 | 0.4% |
| Icelander | 18 | 0.3% |
| Irish | 1,511 | 22.1% |
| Italian | 134 | 2.0% |
| Korean | 142 | 2.1% |
| Mexican | 130 | 1.9% |
| Northern European | 37 | 0.5% |
| Norwegian | 623 | 9.1% |
| Polish | 173 | 2.5% |
| Portuguese | 40 | 0.6% |
| Puerto Rican | 60 | 0.9% |
| Puget Sound Salish | 33 | 0.5% |
| Russian | 17 | 0.3% |
| Scandinavian | 97 | 1.4% |
| Scotch-Irish | 39 | 0.6% |
| Scottish | 204 | 3.0% |
| Spaniard | 29 | 0.4% |
| Swedish | 143 | 2.1% |
| Swiss | 42 | 0.6% |
| Thai | 38 | 0.6% |
| Welsh | 57 | 0.8% |
| Yup'ik | 27 | 0.4% | View All 42 Rows |
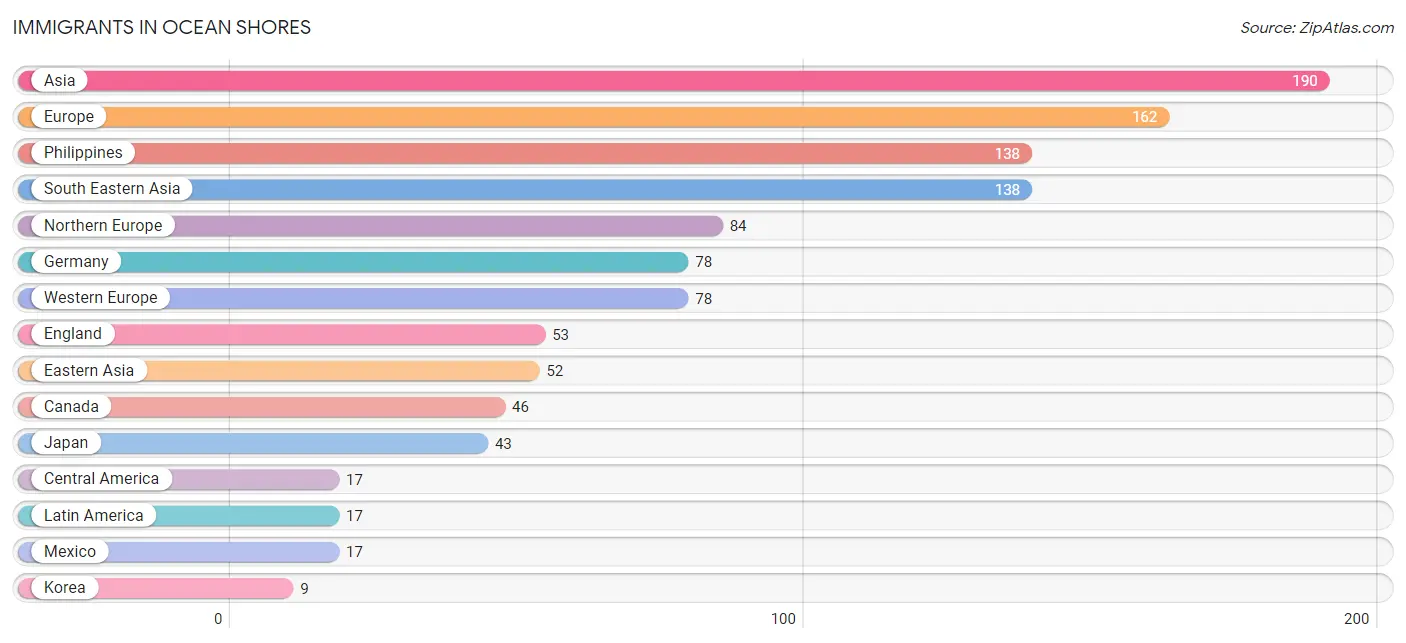
Immigrants in Ocean Shores
The most numerous immigrant groups reported in Ocean Shores came from Asia (190 | 2.8%), Europe (162 | 2.4%), Philippines (138 | 2.0%), South Eastern Asia (138 | 2.0%), and Northern Europe (84 | 1.2%), together accounting for 10.4% of all Ocean Shores residents.
| Immigration Origin | # Population | % Population |
| Asia | 190 | 2.8% |
| Canada | 46 | 0.7% |
| Central America | 17 | 0.3% |
| Eastern Asia | 52 | 0.8% |
| England | 53 | 0.8% |
| Europe | 162 | 2.4% |
| Germany | 78 | 1.1% |
| Japan | 43 | 0.6% |
| Korea | 9 | 0.1% |
| Latin America | 17 | 0.3% |
| Mexico | 17 | 0.3% |
| Northern Europe | 84 | 1.2% |
| Philippines | 138 | 2.0% |
| South Eastern Asia | 138 | 2.0% |
| Western Europe | 78 | 1.1% | View All 15 Rows |
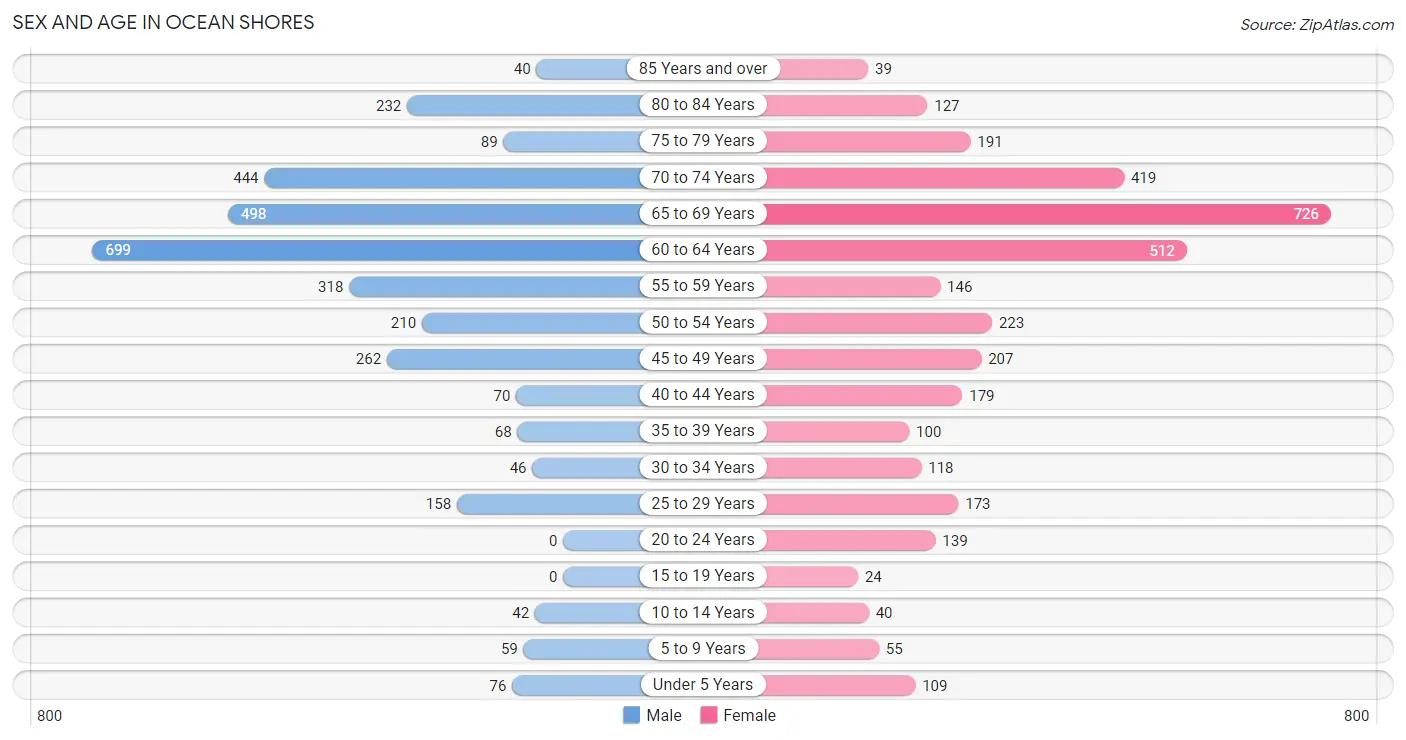
Sex and Age in Ocean Shores
Sex and Age in Ocean Shores
The most populous age groups in Ocean Shores are 60 to 64 Years (699 | 21.1%) for men and 65 to 69 Years (726 | 20.6%) for women.
| Age Bracket | Male | Female |
| Under 5 Years | 76 (2.3%) | 109 (3.1%) |
| 5 to 9 Years | 59 (1.8%) | 55 (1.6%) |
| 10 to 14 Years | 42 (1.3%) | 40 (1.1%) |
| 15 to 19 Years | 0 (0.0%) | 24 (0.7%) |
| 20 to 24 Years | 0 (0.0%) | 139 (3.9%) |
| 25 to 29 Years | 158 (4.8%) | 173 (4.9%) |
| 30 to 34 Years | 46 (1.4%) | 118 (3.4%) |
| 35 to 39 Years | 68 (2.1%) | 100 (2.8%) |
| 40 to 44 Years | 70 (2.1%) | 179 (5.1%) |
| 45 to 49 Years | 262 (7.9%) | 207 (5.9%) |
| 50 to 54 Years | 210 (6.3%) | 223 (6.3%) |
| 55 to 59 Years | 318 (9.6%) | 146 (4.1%) |
| 60 to 64 Years | 699 (21.1%) | 512 (14.5%) |
| 65 to 69 Years | 498 (15.0%) | 726 (20.6%) |
| 70 to 74 Years | 444 (13.4%) | 419 (11.9%) |
| 75 to 79 Years | 89 (2.7%) | 191 (5.4%) |
| 80 to 84 Years | 232 (7.0%) | 127 (3.6%) |
| 85 Years and over | 40 (1.2%) | 39 (1.1%) |
| Total | 3,311 (100.0%) | 3,527 (100.0%) |
Families and Households in Ocean Shores
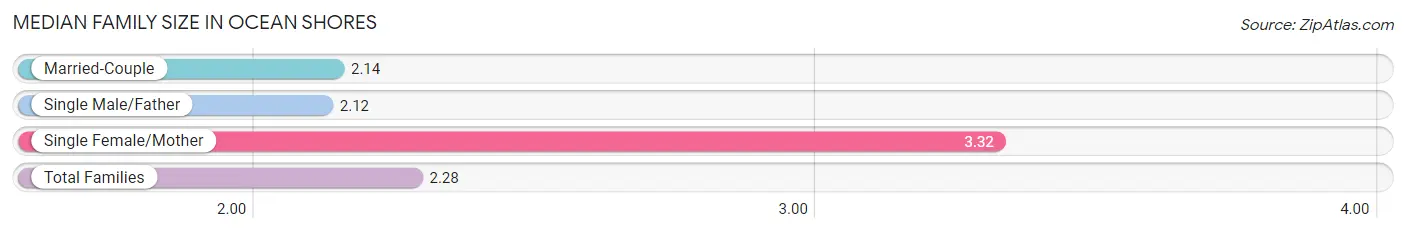
Median Family Size in Ocean Shores
The median family size in Ocean Shores is 2.28 persons per family, with single female/mother families (265 | 12.1%) accounting for the largest median family size of 3.32 persons per family. On the other hand, single male/father families (68 | 3.1%) represent the smallest median family size with 2.12 persons per family.
| Family Type | # Families | Family Size |
| Married-Couple | 1,859 (84.8%) | 2.14 |
| Single Male/Father | 68 (3.1%) | 2.12 |
| Single Female/Mother | 265 (12.1%) | 3.32 |
| Total Families | 2,192 (100.0%) | 2.28 |
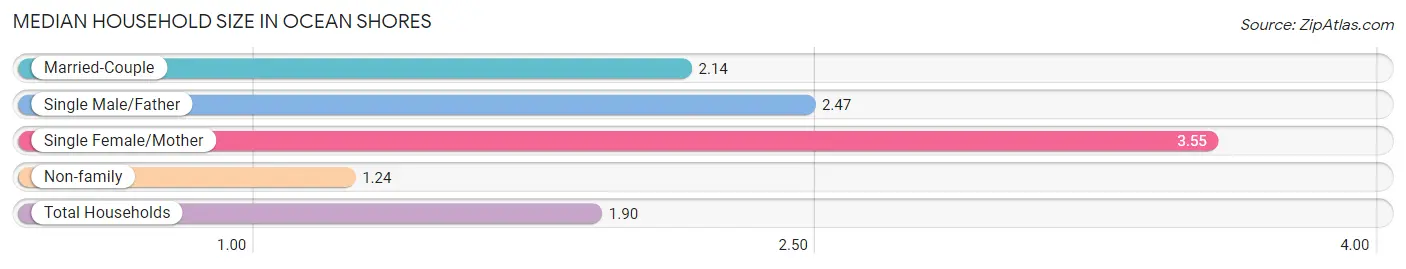
Median Household Size in Ocean Shores
The median household size in Ocean Shores is 1.90 persons per household, with single female/mother households (265 | 7.4%) accounting for the largest median household size of 3.55 persons per household. non-family households (1,395 | 38.9%) represent the smallest median household size with 1.24 persons per household.
| Household Type | # Households | Household Size |
| Married-Couple | 1,859 (51.8%) | 2.14 |
| Single Male/Father | 68 (1.9%) | 2.47 |
| Single Female/Mother | 265 (7.4%) | 3.55 |
| Non-family | 1,395 (38.9%) | 1.24 |
| Total Households | 3,587 (100.0%) | 1.90 |
Household Size by Marriage Status in Ocean Shores
Out of a total of 3,587 households in Ocean Shores, 2,192 (61.1%) are family households, while 1,395 (38.9%) are nonfamily households. The most numerous type of family households are 2-person households, comprising 1,780, and the most common type of nonfamily households are 1-person households, comprising 1,124.
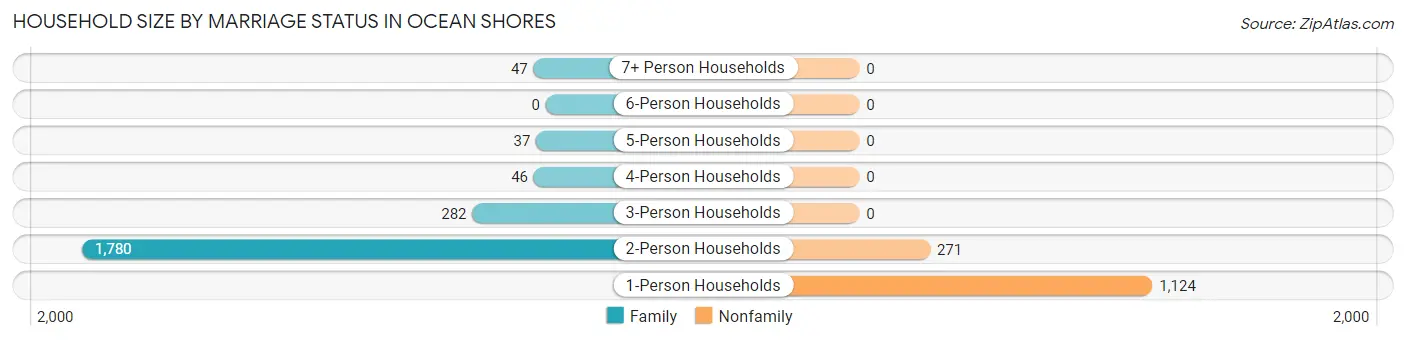
| Household Size | Family Households | Nonfamily Households |
| 1-Person Households | - | 1,124 (31.3%) |
| 2-Person Households | 1,780 (49.6%) | 271 (7.6%) |
| 3-Person Households | 282 (7.9%) | 0 (0.0%) |
| 4-Person Households | 46 (1.3%) | 0 (0.0%) |
| 5-Person Households | 37 (1.0%) | 0 (0.0%) |
| 6-Person Households | 0 (0.0%) | 0 (0.0%) |
| 7+ Person Households | 47 (1.3%) | 0 (0.0%) |
| Total | 2,192 (61.1%) | 1,395 (38.9%) |
Female Fertility in Ocean Shores
Fertility by Age in Ocean Shores
Average fertility rate in Ocean Shores is 68.0 births per 1,000 women. Women in the age bracket of 20 to 34 years have the highest fertility rate with 160.0 births per 1,000 women. Women in the age bracket of 20 to 34 years acount for 100.0% of all women with births.
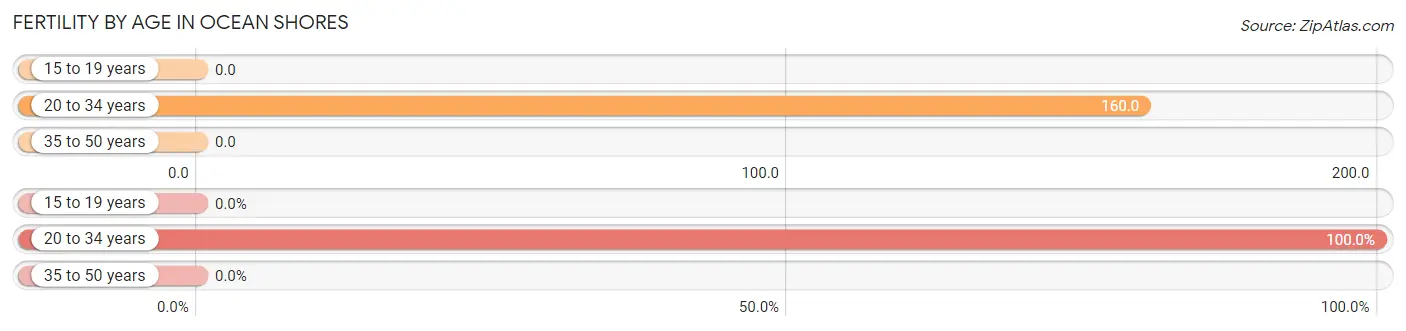
| Age Bracket | Women with Births | Births / 1,000 Women |
| 15 to 19 years | 0 (0.0%) | 0.0 |
| 20 to 34 years | 69 (100.0%) | 160.0 |
| 35 to 50 years | 0 (0.0%) | 0.0 |
| Total | 69 (100.0%) | 68.0 |
Fertility by Age by Marriage Status in Ocean Shores
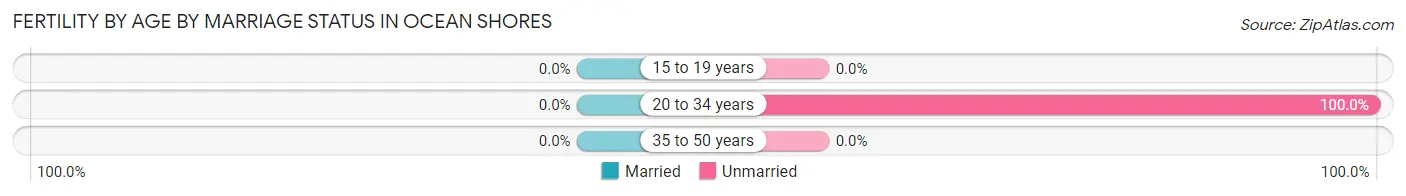
| Age Bracket | Married | Unmarried |
| 15 to 19 years | 0 (0.0%) | 0 (0.0%) |
| 20 to 34 years | 0 (0.0%) | 69 (100.0%) |
| 35 to 50 years | 0 (0.0%) | 0 (0.0%) |
| Total | 0 (0.0%) | 69 (100.0%) |
Fertility by Education in Ocean Shores
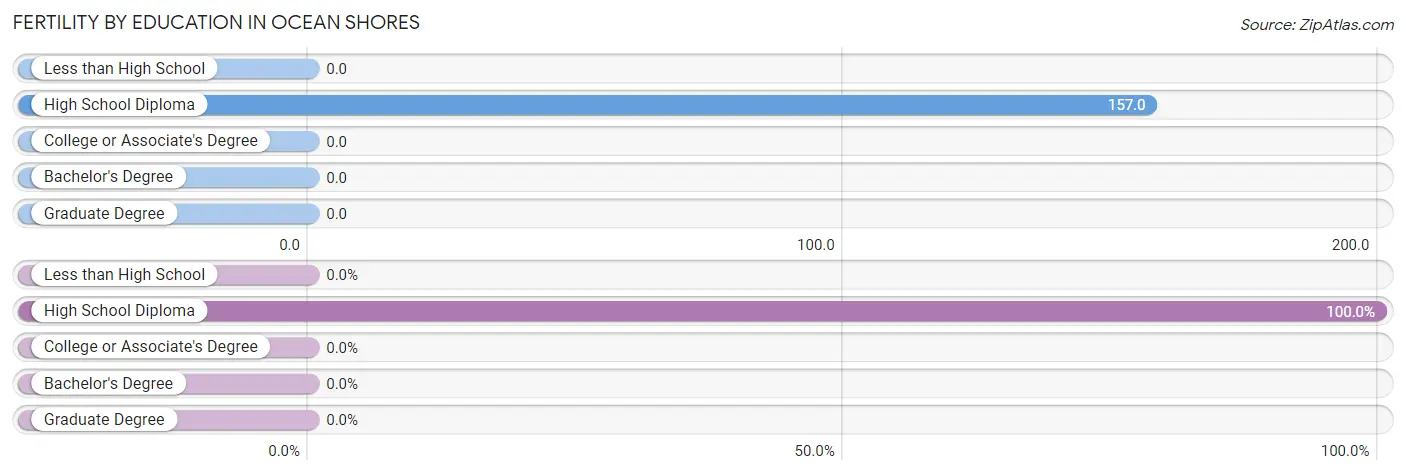
| Educational Attainment | Women with Births | Births / 1,000 Women |
| Less than High School | 0 (0.0%) | 0.0 |
| High School Diploma | 69 (100.0%) | 157.0 |
| College or Associate's Degree | 0 (0.0%) | 0.0 |
| Bachelor's Degree | 0 (0.0%) | 0.0 |
| Graduate Degree | 0 (0.0%) | 0.0 |
| Total | 69 (100.0%) | 68.0 |
Fertility by Education by Marriage Status in Ocean Shores
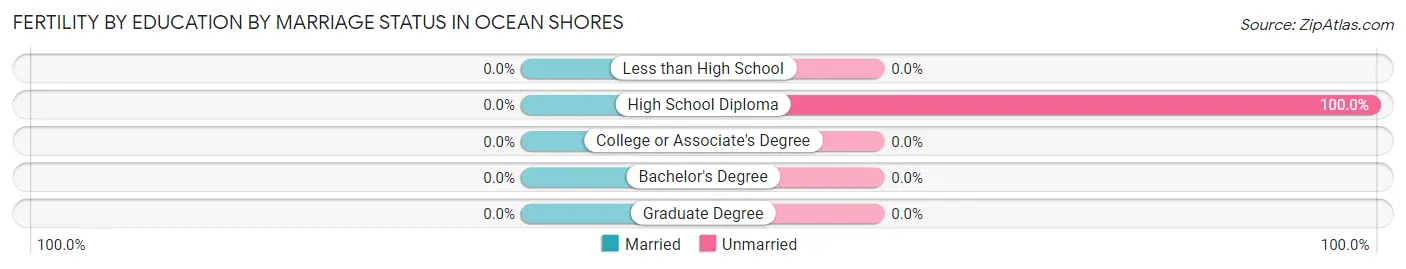
| Educational Attainment | Married | Unmarried |
| Less than High School | 0 (0.0%) | 0 (0.0%) |
| High School Diploma | 0 (0.0%) | 69 (100.0%) |
| College or Associate's Degree | 0 (0.0%) | 0 (0.0%) |
| Bachelor's Degree | 0 (0.0%) | 0 (0.0%) |
| Graduate Degree | 0 (0.0%) | 0 (0.0%) |
| Total | 0 (0.0%) | 69 (100.0%) |
Employment Characteristics in Ocean Shores
Employment by Class of Employer in Ocean Shores
Among the 2,210 employed individuals in Ocean Shores, private company employees (1,534 | 69.4%), local government employees (286 | 12.9%), and self-employed (not incorporated) (167 | 7.6%) make up the most common classes of employment.
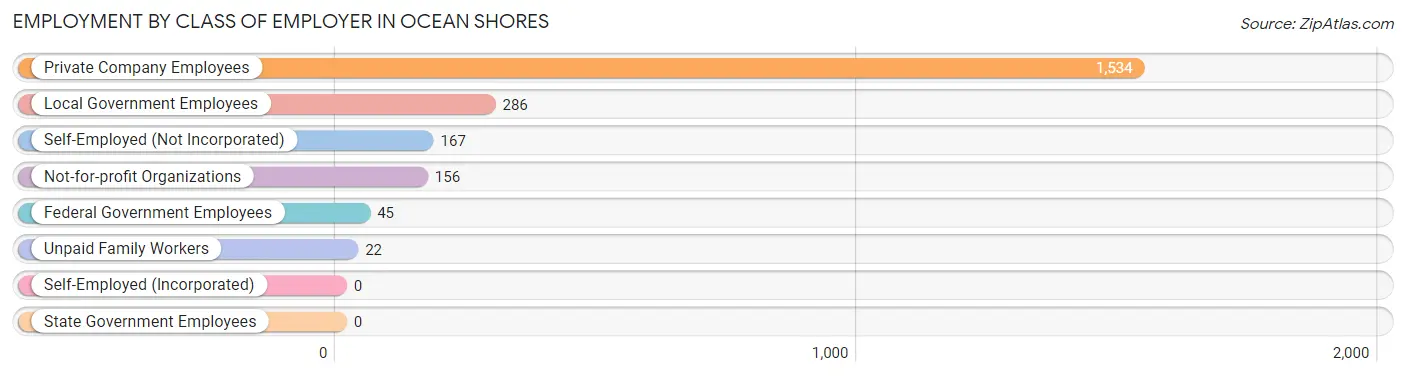
| Employer Class | # Employees | % Employees |
| Private Company Employees | 1,534 | 69.4% |
| Self-Employed (Incorporated) | 0 | 0.0% |
| Self-Employed (Not Incorporated) | 167 | 7.6% |
| Not-for-profit Organizations | 156 | 7.1% |
| Local Government Employees | 286 | 12.9% |
| State Government Employees | 0 | 0.0% |
| Federal Government Employees | 45 | 2.0% |
| Unpaid Family Workers | 22 | 1.0% |
| Total | 2,210 | 100.0% |
Employment Status by Age in Ocean Shores
According to the labor force statistics for Ocean Shores, out of the total population over 16 years of age (6,457), 36.5% or 2,357 individuals are in the labor force, with 5.3% or 125 of them unemployed. The age group with the highest labor force participation rate is 16 to 19 years, with 100.0% or 24 individuals in the labor force. Within the labor force, the 16 to 19 years age range has the highest percentage of unemployed individuals, with 100.0% or 24 of them being unemployed.
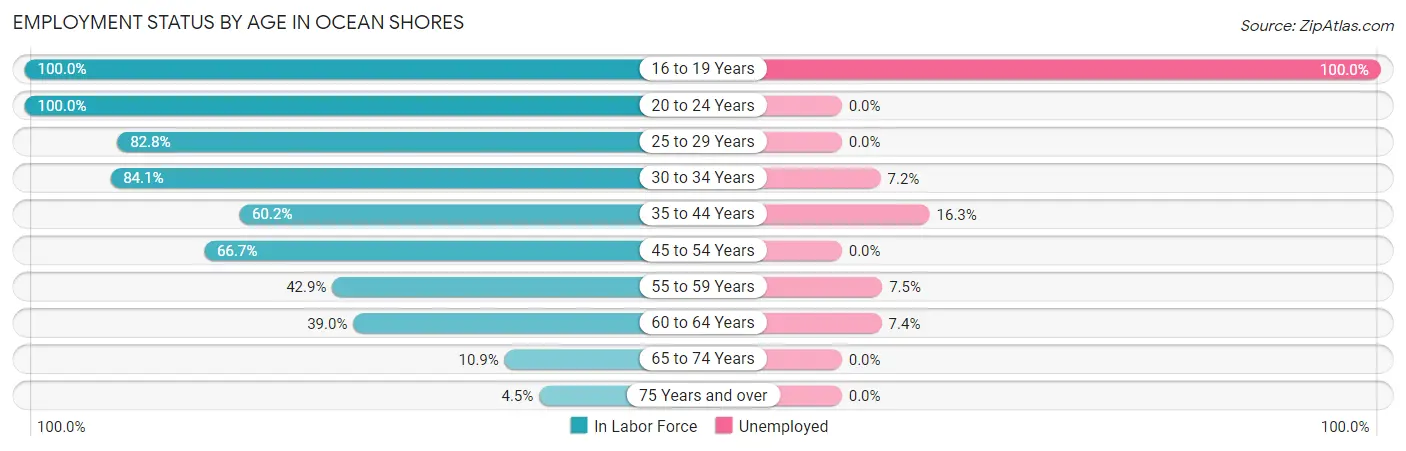
| Age Bracket | In Labor Force | Unemployed |
| 16 to 19 Years | 24 (100.0%) | 24 (100.0%) |
| 20 to 24 Years | 139 (100.0%) | 0 (0.0%) |
| 25 to 29 Years | 274 (82.8%) | 0 (0.0%) |
| 30 to 34 Years | 138 (84.1%) | 10 (7.2%) |
| 35 to 44 Years | 251 (60.2%) | 41 (16.3%) |
| 45 to 54 Years | 602 (66.7%) | 0 (0.0%) |
| 55 to 59 Years | 199 (42.9%) | 15 (7.5%) |
| 60 to 64 Years | 472 (39.0%) | 35 (7.4%) |
| 65 to 74 Years | 227 (10.9%) | 0 (0.0%) |
| 75 Years and over | 32 (4.5%) | 0 (0.0%) |
| Total | 2,357 (36.5%) | 125 (5.3%) |
Employment Status by Educational Attainment in Ocean Shores
According to labor force statistics for Ocean Shores, 55.5% of individuals (1,936) out of the total population between 25 and 64 years of age (3,489) are in the labor force, with 5.2% or 101 of them being unemployed. The group with the highest labor force participation rate are those with the educational attainment of less than high school, with 63.1% or 280 individuals in the labor force. Within the labor force, individuals with high school diploma education have the highest percentage of unemployment, with 10.5% or 76 of them being unemployed.
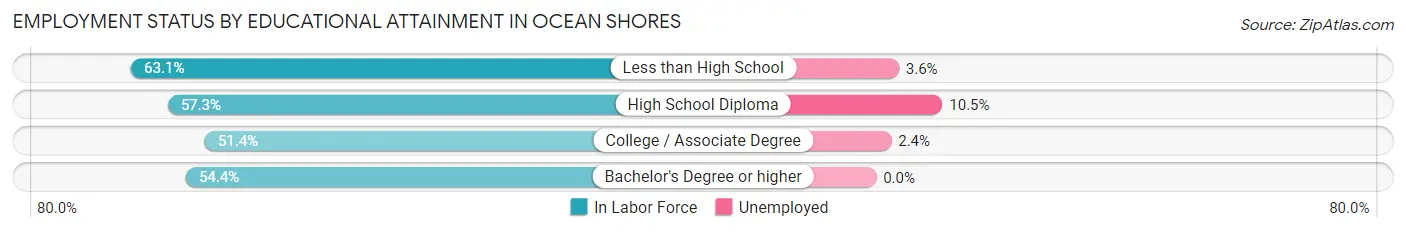
| Educational Attainment | In Labor Force | Unemployed |
| Less than High School | 280 (63.1%) | 16 (3.6%) |
| High School Diploma | 727 (57.3%) | 133 (10.5%) |
| College / Associate Degree | 626 (51.4%) | 29 (2.4%) |
| Bachelor's Degree or higher | 304 (54.4%) | 0 (0.0%) |
| Total | 1,936 (55.5%) | 181 (5.2%) |
Employment Occupations by Sex in Ocean Shores
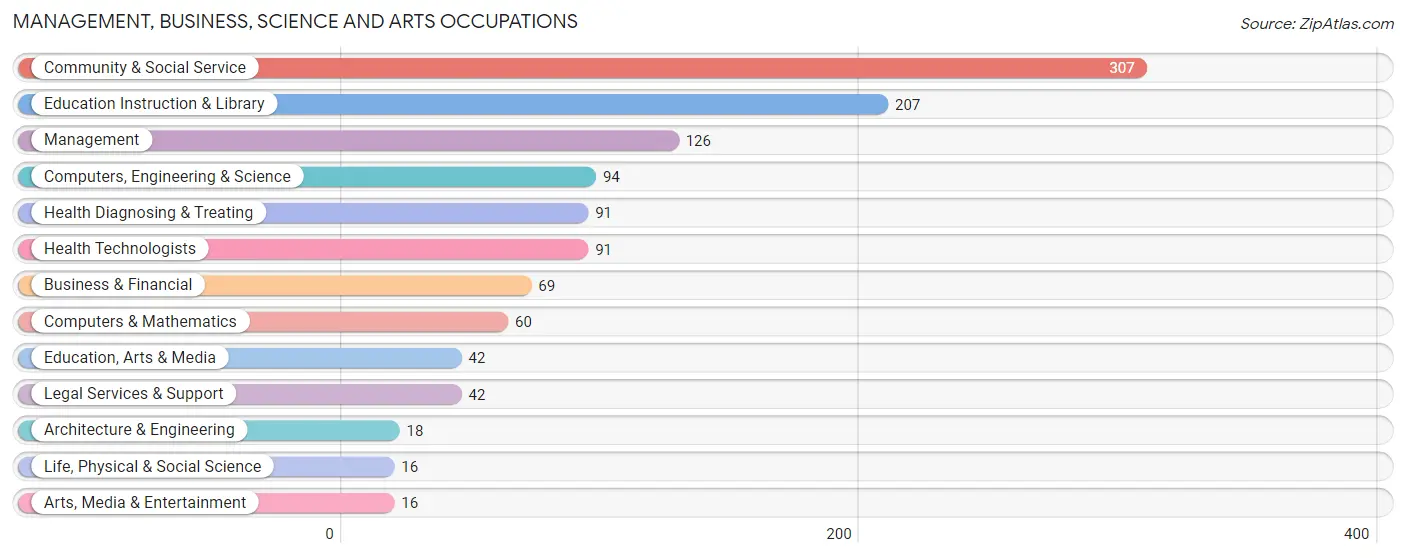
Management, Business, Science and Arts Occupations
The most common Management, Business, Science and Arts occupations in Ocean Shores are Community & Social Service (307 | 13.8%), Education Instruction & Library (207 | 9.3%), Management (126 | 5.6%), Computers, Engineering & Science (94 | 4.2%), and Health Diagnosing & Treating (91 | 4.1%).
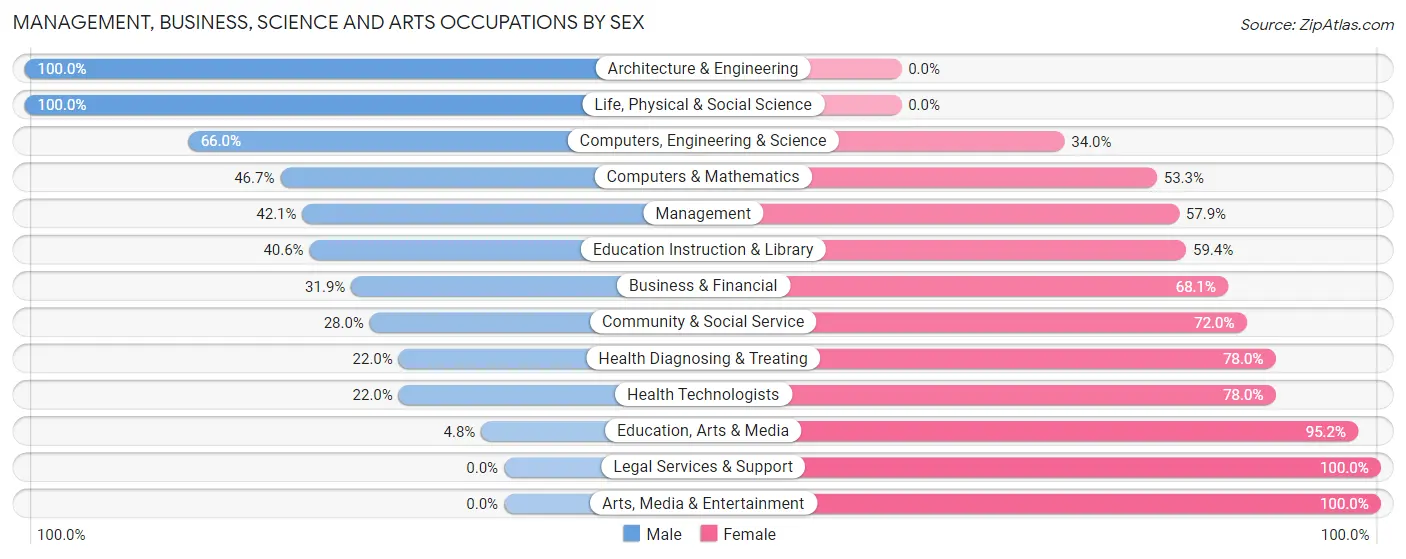
Management, Business, Science and Arts Occupations by Sex
Within the Management, Business, Science and Arts occupations in Ocean Shores, the most male-oriented occupations are Architecture & Engineering (100.0%), Life, Physical & Social Science (100.0%), and Computers, Engineering & Science (66.0%), while the most female-oriented occupations are Legal Services & Support (100.0%), Arts, Media & Entertainment (100.0%), and Education, Arts & Media (95.2%).
| Occupation | Male | Female |
| Management | 53 (42.1%) | 73 (57.9%) |
| Business & Financial | 22 (31.9%) | 47 (68.1%) |
| Computers, Engineering & Science | 62 (66.0%) | 32 (34.0%) |
| Computers & Mathematics | 28 (46.7%) | 32 (53.3%) |
| Architecture & Engineering | 18 (100.0%) | 0 (0.0%) |
| Life, Physical & Social Science | 16 (100.0%) | 0 (0.0%) |
| Community & Social Service | 86 (28.0%) | 221 (72.0%) |
| Education, Arts & Media | 2 (4.8%) | 40 (95.2%) |
| Legal Services & Support | 0 (0.0%) | 42 (100.0%) |
| Education Instruction & Library | 84 (40.6%) | 123 (59.4%) |
| Arts, Media & Entertainment | 0 (0.0%) | 16 (100.0%) |
| Health Diagnosing & Treating | 20 (22.0%) | 71 (78.0%) |
| Health Technologists | 20 (22.0%) | 71 (78.0%) |
| Total (Category) | 243 (35.4%) | 444 (64.6%) |
| Total (Overall) | 1,056 (47.3%) | 1,177 (52.7%) |
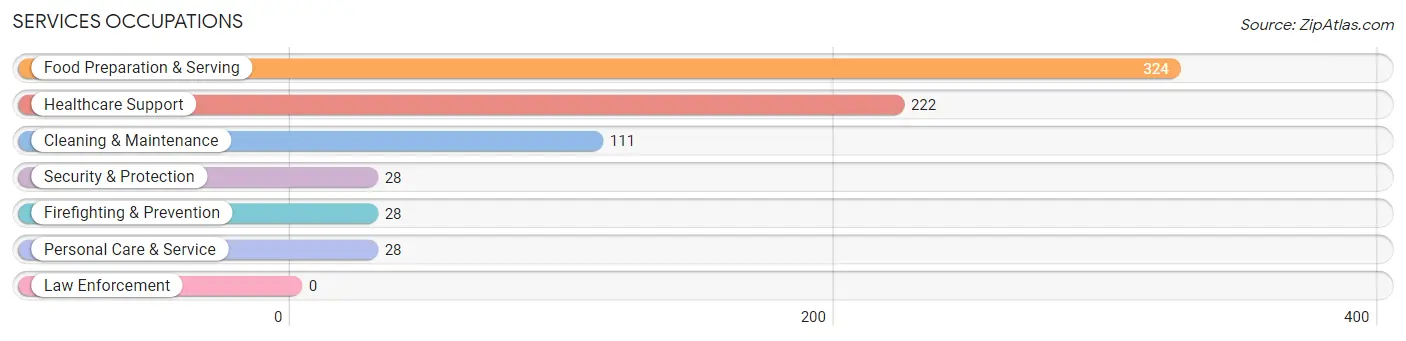
Services Occupations
The most common Services occupations in Ocean Shores are Food Preparation & Serving (324 | 14.5%), Healthcare Support (222 | 9.9%), Cleaning & Maintenance (111 | 5.0%), Security & Protection (28 | 1.3%), and Firefighting & Prevention (28 | 1.3%).
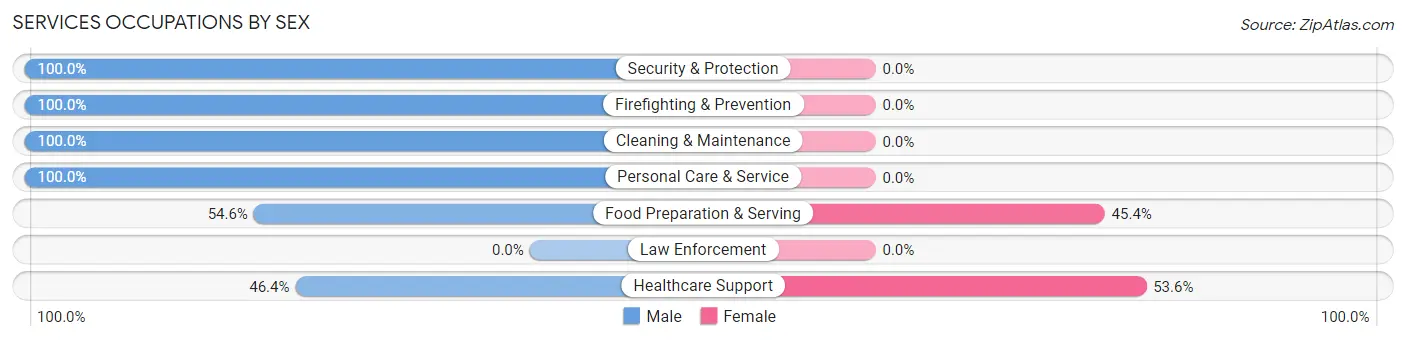
Services Occupations by Sex
Within the Services occupations in Ocean Shores, the most male-oriented occupations are Security & Protection (100.0%), Firefighting & Prevention (100.0%), and Cleaning & Maintenance (100.0%), while the most female-oriented occupations are Healthcare Support (53.6%), and Food Preparation & Serving (45.4%).
| Occupation | Male | Female |
| Healthcare Support | 103 (46.4%) | 119 (53.6%) |
| Security & Protection | 28 (100.0%) | 0 (0.0%) |
| Firefighting & Prevention | 28 (100.0%) | 0 (0.0%) |
| Law Enforcement | 0 (0.0%) | 0 (0.0%) |
| Food Preparation & Serving | 177 (54.6%) | 147 (45.4%) |
| Cleaning & Maintenance | 111 (100.0%) | 0 (0.0%) |
| Personal Care & Service | 28 (100.0%) | 0 (0.0%) |
| Total (Category) | 447 (62.7%) | 266 (37.3%) |
| Total (Overall) | 1,056 (47.3%) | 1,177 (52.7%) |
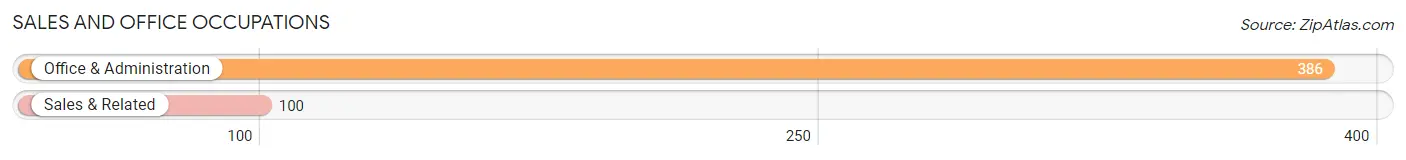
Sales and Office Occupations
The most common Sales and Office occupations in Ocean Shores are Office & Administration (386 | 17.3%), and Sales & Related (100 | 4.5%).
Sales and Office Occupations by Sex
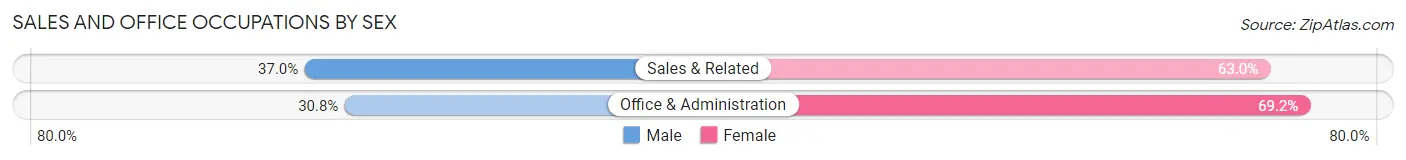
| Occupation | Male | Female |
| Sales & Related | 37 (37.0%) | 63 (63.0%) |
| Office & Administration | 119 (30.8%) | 267 (69.2%) |
| Total (Category) | 156 (32.1%) | 330 (67.9%) |
| Total (Overall) | 1,056 (47.3%) | 1,177 (52.7%) |
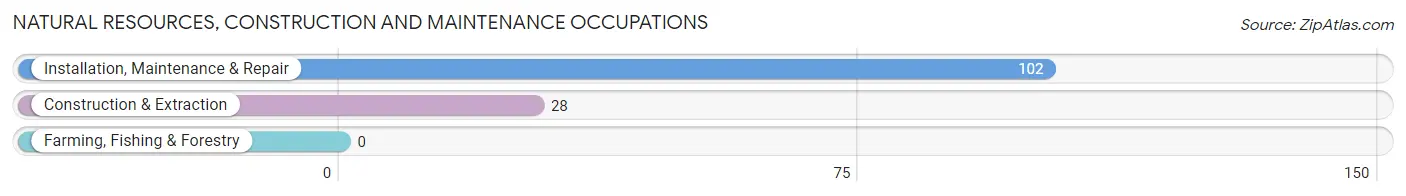
Natural Resources, Construction and Maintenance Occupations
The most common Natural Resources, Construction and Maintenance occupations in Ocean Shores are Installation, Maintenance & Repair (102 | 4.6%), and Construction & Extraction (28 | 1.3%).
Natural Resources, Construction and Maintenance Occupations by Sex
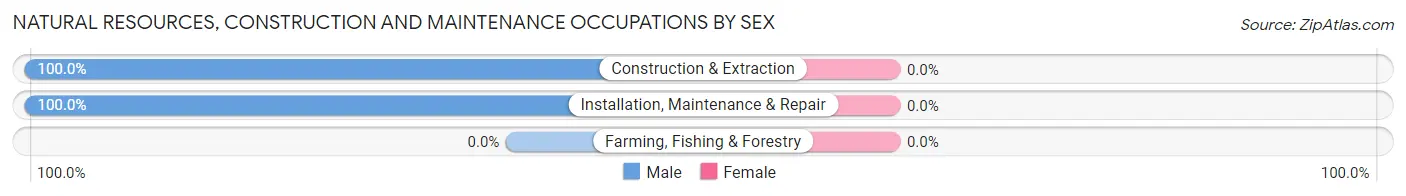
| Occupation | Male | Female |
| Farming, Fishing & Forestry | 0 (0.0%) | 0 (0.0%) |
| Construction & Extraction | 28 (100.0%) | 0 (0.0%) |
| Installation, Maintenance & Repair | 102 (100.0%) | 0 (0.0%) |
| Total (Category) | 130 (100.0%) | 0 (0.0%) |
| Total (Overall) | 1,056 (47.3%) | 1,177 (52.7%) |
Production, Transportation and Moving Occupations
The most common Production, Transportation and Moving occupations in Ocean Shores are Transportation (119 | 5.3%), and Production (98 | 4.4%).
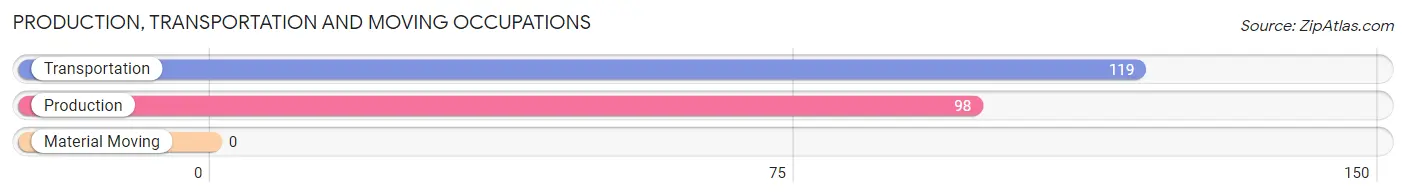
Production, Transportation and Moving Occupations by Sex
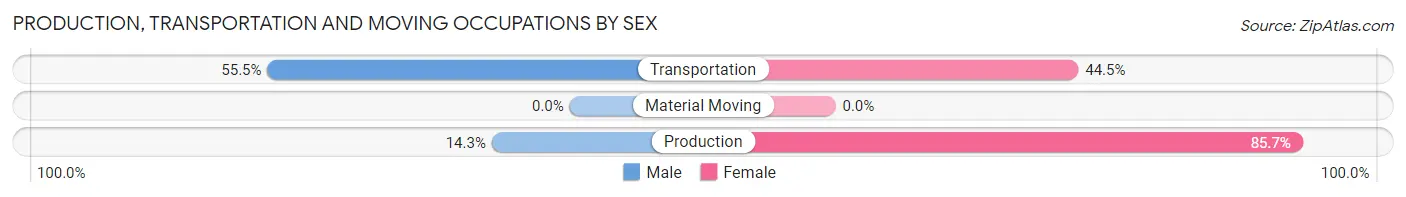
| Occupation | Male | Female |
| Production | 14 (14.3%) | 84 (85.7%) |
| Transportation | 66 (55.5%) | 53 (44.5%) |
| Material Moving | 0 (0.0%) | 0 (0.0%) |
| Total (Category) | 80 (36.9%) | 137 (63.1%) |
| Total (Overall) | 1,056 (47.3%) | 1,177 (52.7%) |
Employment Industries by Sex in Ocean Shores
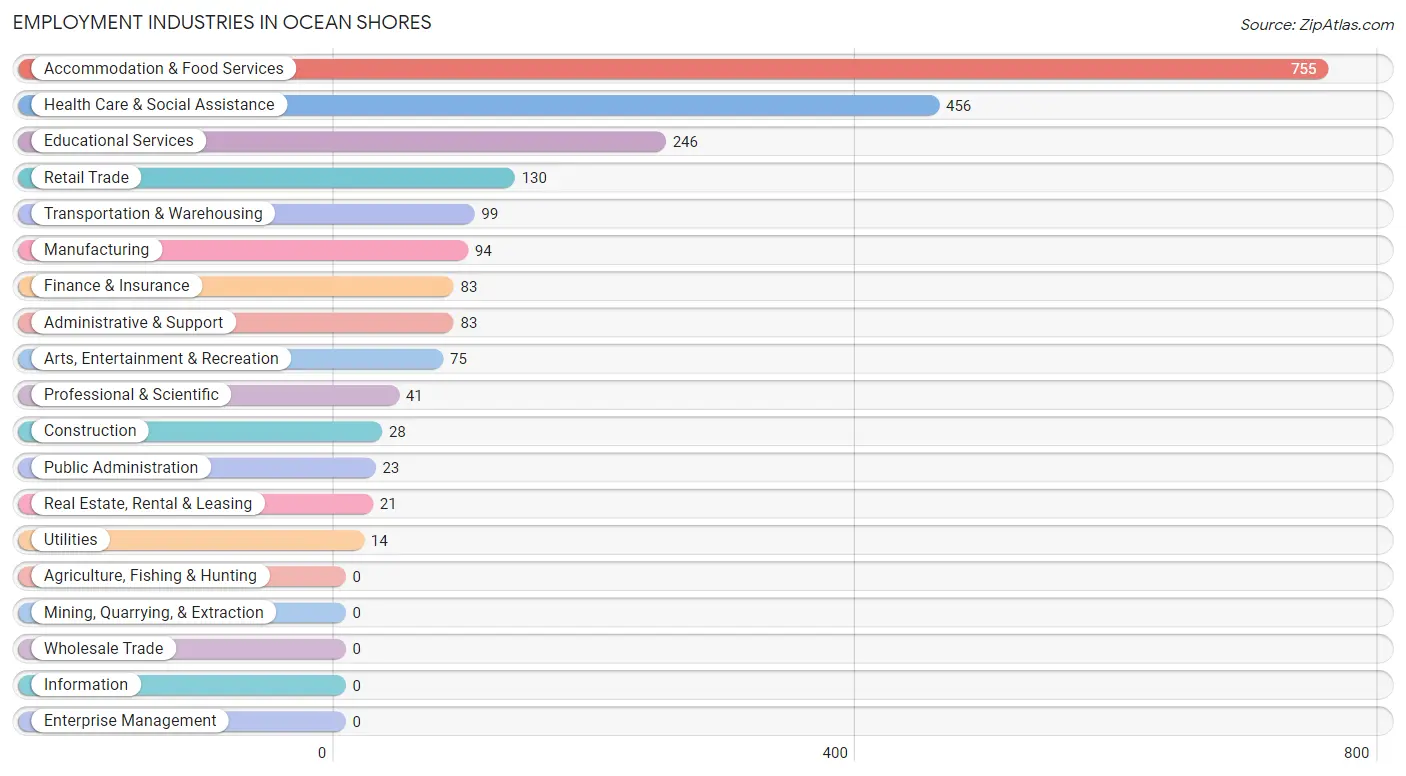
Employment Industries in Ocean Shores
The major employment industries in Ocean Shores include Accommodation & Food Services (755 | 33.8%), Health Care & Social Assistance (456 | 20.4%), Educational Services (246 | 11.0%), Retail Trade (130 | 5.8%), and Transportation & Warehousing (99 | 4.4%).
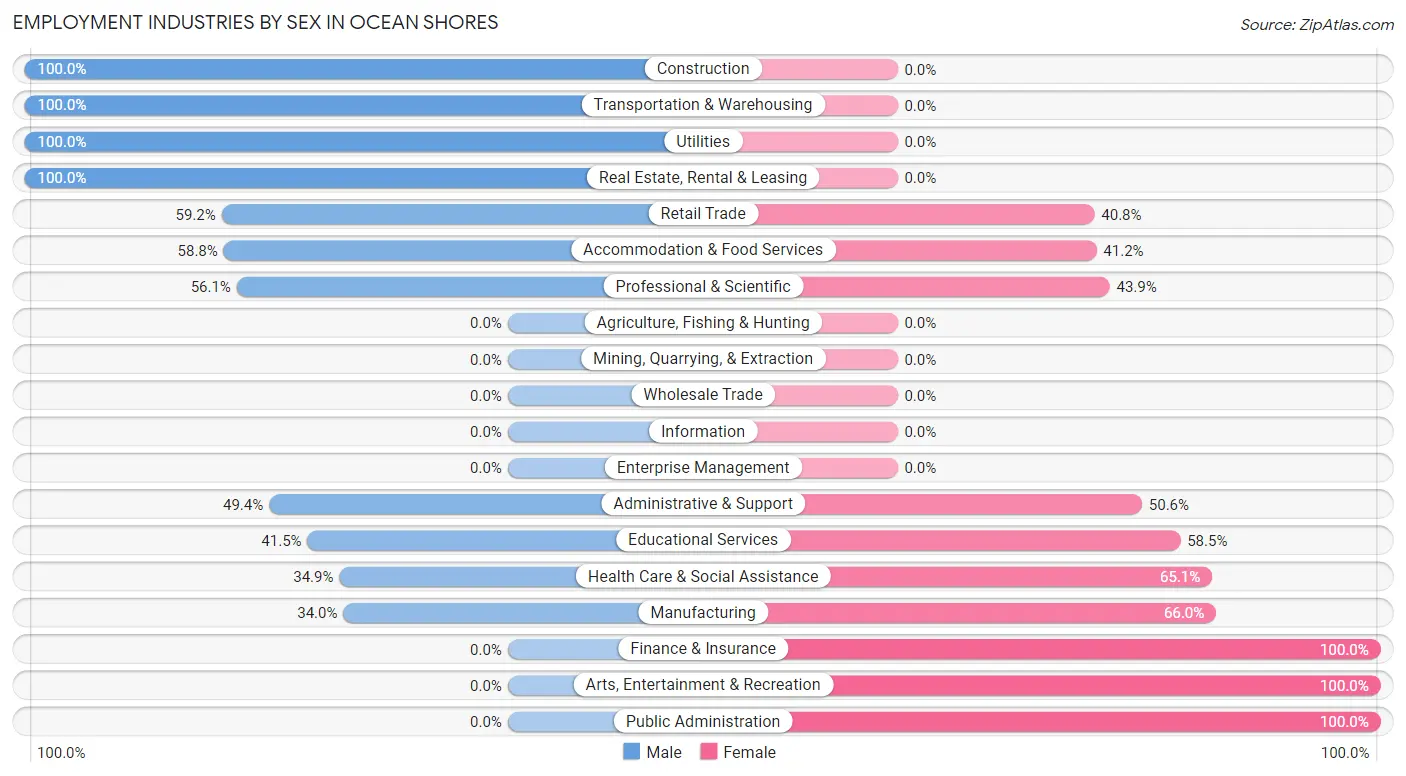
Employment Industries by Sex in Ocean Shores
The Ocean Shores industries that see more men than women are Construction (100.0%), Transportation & Warehousing (100.0%), and Utilities (100.0%), whereas the industries that tend to have a higher number of women are Finance & Insurance (100.0%), Arts, Entertainment & Recreation (100.0%), and Public Administration (100.0%).
| Industry | Male | Female |
| Agriculture, Fishing & Hunting | 0 (0.0%) | 0 (0.0%) |
| Mining, Quarrying, & Extraction | 0 (0.0%) | 0 (0.0%) |
| Construction | 28 (100.0%) | 0 (0.0%) |
| Manufacturing | 32 (34.0%) | 62 (66.0%) |
| Wholesale Trade | 0 (0.0%) | 0 (0.0%) |
| Retail Trade | 77 (59.2%) | 53 (40.8%) |
| Transportation & Warehousing | 99 (100.0%) | 0 (0.0%) |
| Utilities | 14 (100.0%) | 0 (0.0%) |
| Information | 0 (0.0%) | 0 (0.0%) |
| Finance & Insurance | 0 (0.0%) | 83 (100.0%) |
| Real Estate, Rental & Leasing | 21 (100.0%) | 0 (0.0%) |
| Professional & Scientific | 23 (56.1%) | 18 (43.9%) |
| Enterprise Management | 0 (0.0%) | 0 (0.0%) |
| Administrative & Support | 41 (49.4%) | 42 (50.6%) |
| Educational Services | 102 (41.5%) | 144 (58.5%) |
| Health Care & Social Assistance | 159 (34.9%) | 297 (65.1%) |
| Arts, Entertainment & Recreation | 0 (0.0%) | 75 (100.0%) |
| Accommodation & Food Services | 444 (58.8%) | 311 (41.2%) |
| Public Administration | 0 (0.0%) | 23 (100.0%) |
| Total | 1,056 (47.3%) | 1,177 (52.7%) |
Education in Ocean Shores
School Enrollment in Ocean Shores
The most common levels of schooling among the 352 students in Ocean Shores are college / undergraduate (128 | 36.4%), elementary school (97 | 27.6%), and middle school (40 | 11.4%).
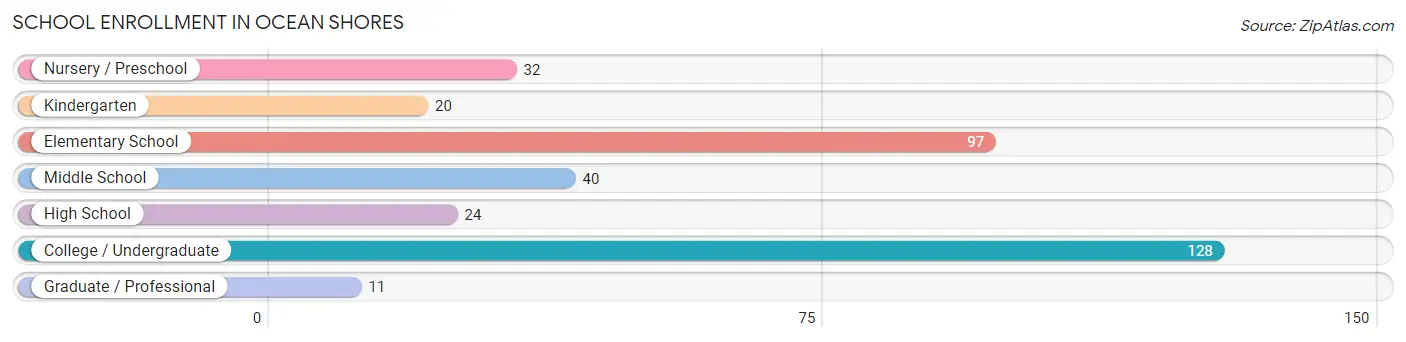
| School Level | # Students | % Students |
| Nursery / Preschool | 32 | 9.1% |
| Kindergarten | 20 | 5.7% |
| Elementary School | 97 | 27.6% |
| Middle School | 40 | 11.4% |
| High School | 24 | 6.8% |
| College / Undergraduate | 128 | 36.4% |
| Graduate / Professional | 11 | 3.1% |
| Total | 352 | 100.0% |
School Enrollment by Age by Funding Source in Ocean Shores
Out of a total of 352 students who are enrolled in schools in Ocean Shores, 28 (8.0%) attend a private institution, while the remaining 324 (92.0%) are enrolled in public schools. The age group of 25 to 34 year olds has the highest likelihood of being enrolled in private schools, with 8 (100.0% in the age bracket) enrolled. Conversely, the age group of 5 to 9 year old has the lowest likelihood of being enrolled in a private school, with 75 (100.0% in the age bracket) attending a public institution.
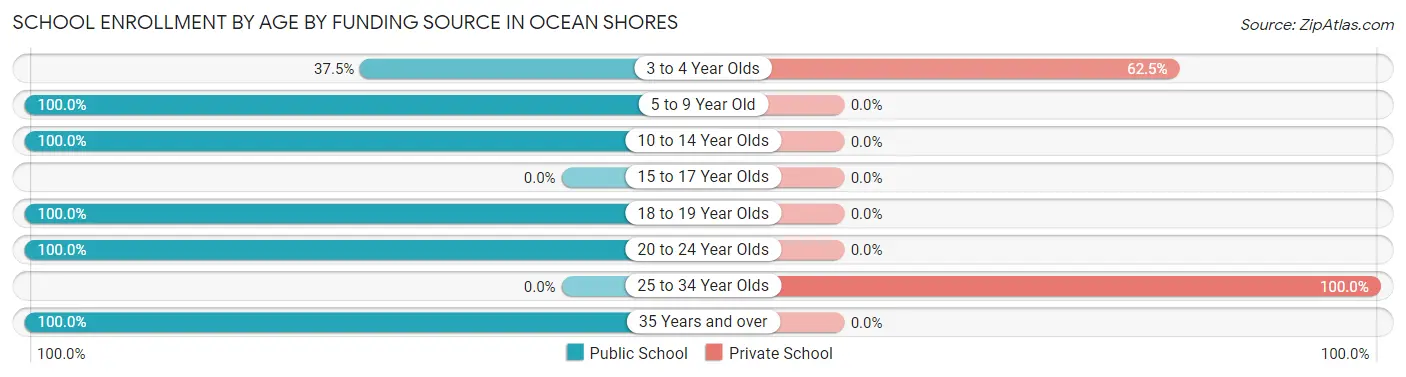
| Age Bracket | Public School | Private School |
| 3 to 4 Year Olds | 12 (37.5%) | 20 (62.5%) |
| 5 to 9 Year Old | 75 (100.0%) | 0 (0.0%) |
| 10 to 14 Year Olds | 82 (100.0%) | 0 (0.0%) |
| 15 to 17 Year Olds | 0 (0.0%) | 0 (0.0%) |
| 18 to 19 Year Olds | 24 (100.0%) | 0 (0.0%) |
| 20 to 24 Year Olds | 49 (100.0%) | 0 (0.0%) |
| 25 to 34 Year Olds | 0 (0.0%) | 8 (100.0%) |
| 35 Years and over | 82 (100.0%) | 0 (0.0%) |
| Total | 324 (92.0%) | 28 (8.0%) |
Educational Attainment by Field of Study in Ocean Shores
Education (183 | 13.5%), engineering (157 | 11.6%), science & technology (126 | 9.3%), social sciences (123 | 9.1%), and business (115 | 8.5%) are the most common fields of study among 1,355 individuals in Ocean Shores who have obtained a bachelor's degree or higher.
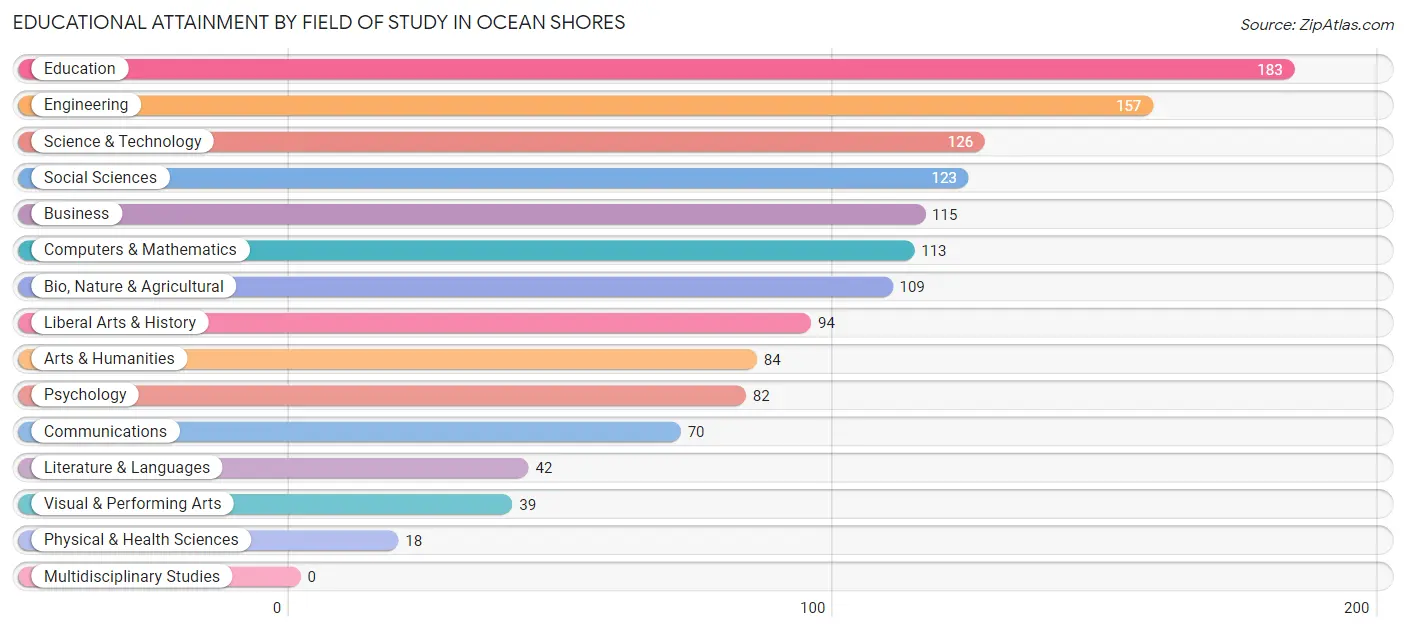
| Field of Study | # Graduates | % Graduates |
| Computers & Mathematics | 113 | 8.3% |
| Bio, Nature & Agricultural | 109 | 8.0% |
| Physical & Health Sciences | 18 | 1.3% |
| Psychology | 82 | 6.0% |
| Social Sciences | 123 | 9.1% |
| Engineering | 157 | 11.6% |
| Multidisciplinary Studies | 0 | 0.0% |
| Science & Technology | 126 | 9.3% |
| Business | 115 | 8.5% |
| Education | 183 | 13.5% |
| Literature & Languages | 42 | 3.1% |
| Liberal Arts & History | 94 | 6.9% |
| Visual & Performing Arts | 39 | 2.9% |
| Communications | 70 | 5.2% |
| Arts & Humanities | 84 | 6.2% |
| Total | 1,355 | 100.0% |
Transportation & Commute in Ocean Shores
Vehicle Availability by Sex in Ocean Shores
The most prevalent vehicle ownership categories in Ocean Shores are males with 1 vehicle (335, accounting for 31.9%) and females with 1 vehicle (318, making up 29.0%).
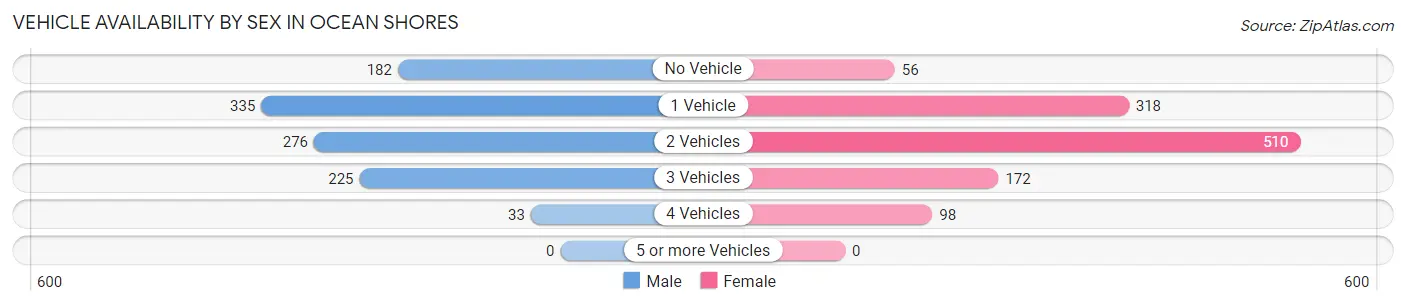
| Vehicles Available | Male | Female |
| No Vehicle | 182 (17.3%) | 56 (4.9%) |
| 1 Vehicle | 335 (31.9%) | 318 (27.6%) |
| 2 Vehicles | 276 (26.3%) | 510 (44.2%) |
| 3 Vehicles | 225 (21.4%) | 172 (14.9%) |
| 4 Vehicles | 33 (3.1%) | 98 (8.5%) |
| 5 or more Vehicles | 0 (0.0%) | 0 (0.0%) |
| Total | 1,051 (100.0%) | 1,154 (100.0%) |
Commute Time in Ocean Shores
The most frequently occuring commute durations in Ocean Shores are 5 to 9 minutes (691 commuters, 35.5%), 10 to 14 minutes (348 commuters, 17.9%), and 15 to 19 minutes (276 commuters, 14.2%).
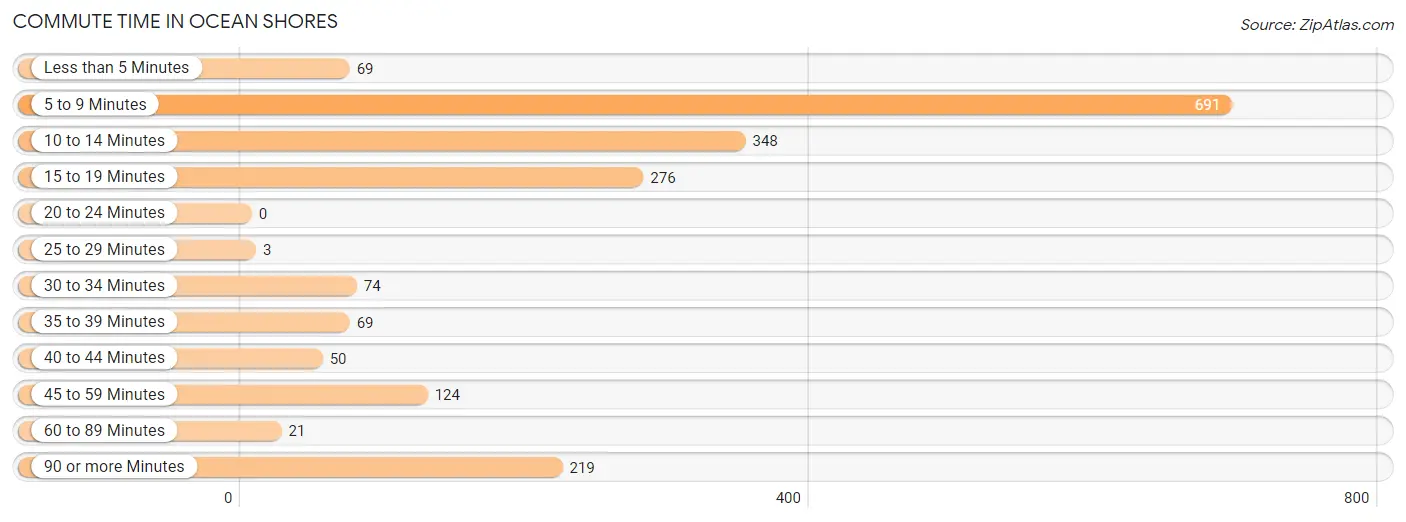
| Commute Time | # Commuters | % Commuters |
| Less than 5 Minutes | 69 | 3.5% |
| 5 to 9 Minutes | 691 | 35.5% |
| 10 to 14 Minutes | 348 | 17.9% |
| 15 to 19 Minutes | 276 | 14.2% |
| 20 to 24 Minutes | 0 | 0.0% |
| 25 to 29 Minutes | 3 | 0.2% |
| 30 to 34 Minutes | 74 | 3.8% |
| 35 to 39 Minutes | 69 | 3.5% |
| 40 to 44 Minutes | 50 | 2.6% |
| 45 to 59 Minutes | 124 | 6.4% |
| 60 to 89 Minutes | 21 | 1.1% |
| 90 or more Minutes | 219 | 11.3% |
Commute Time by Sex in Ocean Shores
The most common commute times in Ocean Shores are 5 to 9 minutes (331 commuters, 35.2%) for males and 5 to 9 minutes (360 commuters, 35.9%) for females.
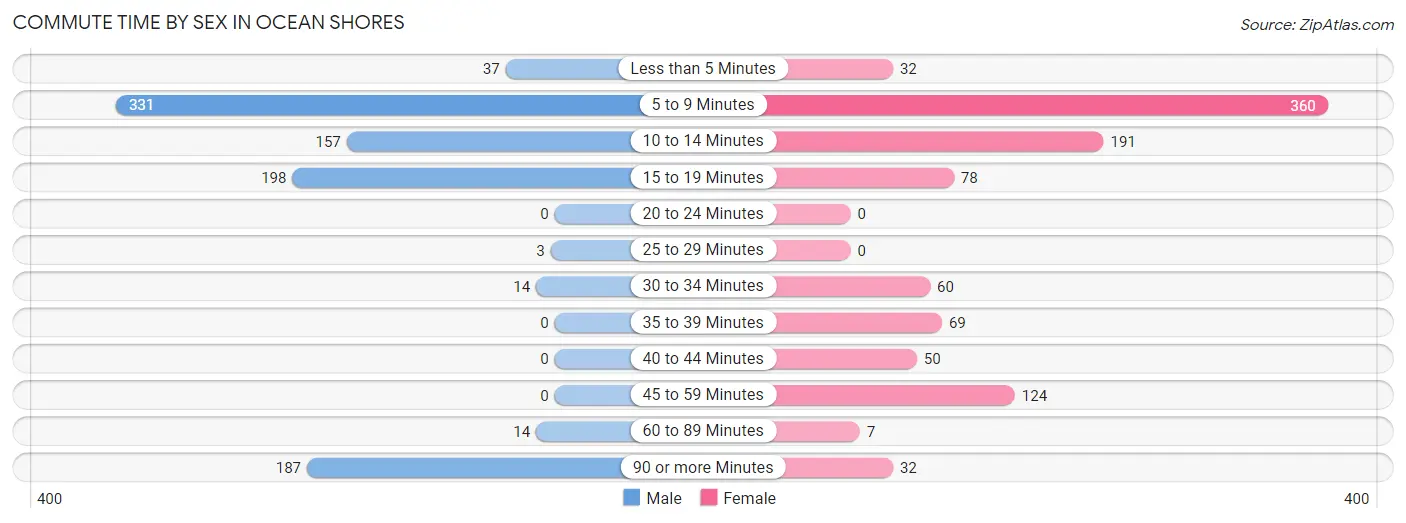
| Commute Time | Male | Female |
| Less than 5 Minutes | 37 (3.9%) | 32 (3.2%) |
| 5 to 9 Minutes | 331 (35.2%) | 360 (35.9%) |
| 10 to 14 Minutes | 157 (16.7%) | 191 (19.0%) |
| 15 to 19 Minutes | 198 (21.0%) | 78 (7.8%) |
| 20 to 24 Minutes | 0 (0.0%) | 0 (0.0%) |
| 25 to 29 Minutes | 3 (0.3%) | 0 (0.0%) |
| 30 to 34 Minutes | 14 (1.5%) | 60 (6.0%) |
| 35 to 39 Minutes | 0 (0.0%) | 69 (6.9%) |
| 40 to 44 Minutes | 0 (0.0%) | 50 (5.0%) |
| 45 to 59 Minutes | 0 (0.0%) | 124 (12.4%) |
| 60 to 89 Minutes | 14 (1.5%) | 7 (0.7%) |
| 90 or more Minutes | 187 (19.9%) | 32 (3.2%) |
Time of Departure to Work by Sex in Ocean Shores
The most frequent times of departure to work in Ocean Shores are 7:00 AM to 7:29 AM (174, 18.5%) for males and 7:00 AM to 7:29 AM (242, 24.1%) for females.
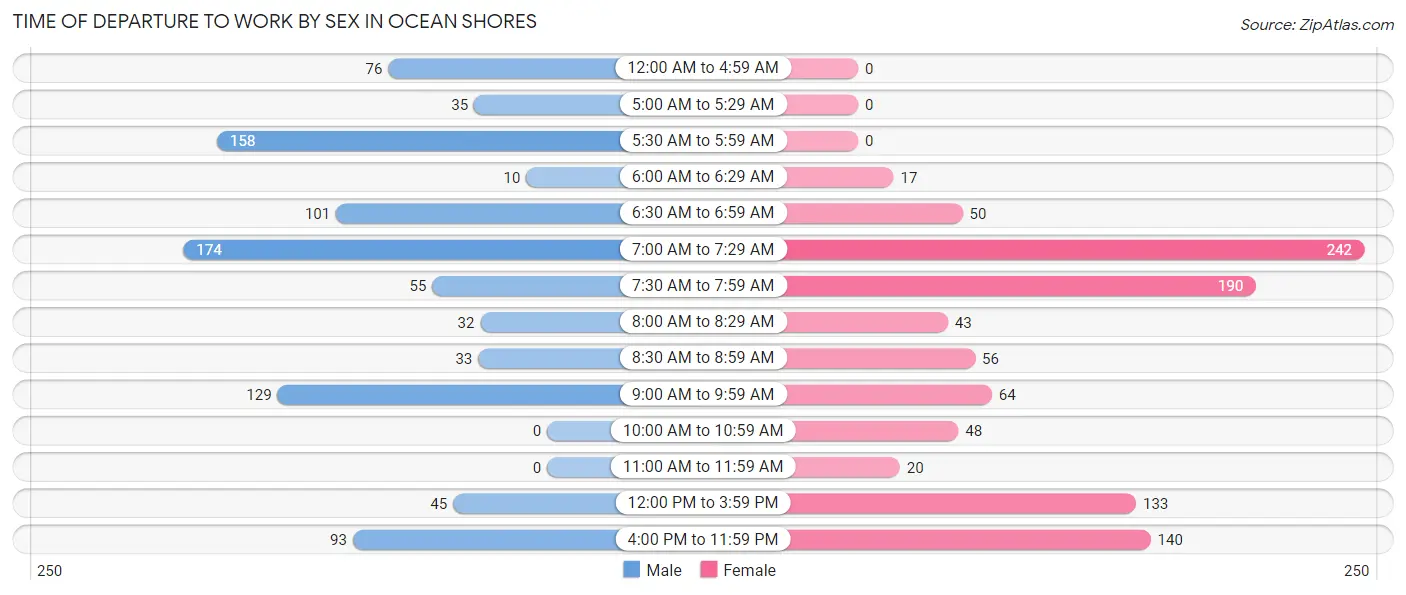
| Time of Departure | Male | Female |
| 12:00 AM to 4:59 AM | 76 (8.1%) | 0 (0.0%) |
| 5:00 AM to 5:29 AM | 35 (3.7%) | 0 (0.0%) |
| 5:30 AM to 5:59 AM | 158 (16.8%) | 0 (0.0%) |
| 6:00 AM to 6:29 AM | 10 (1.1%) | 17 (1.7%) |
| 6:30 AM to 6:59 AM | 101 (10.7%) | 50 (5.0%) |
| 7:00 AM to 7:29 AM | 174 (18.5%) | 242 (24.1%) |
| 7:30 AM to 7:59 AM | 55 (5.8%) | 190 (18.9%) |
| 8:00 AM to 8:29 AM | 32 (3.4%) | 43 (4.3%) |
| 8:30 AM to 8:59 AM | 33 (3.5%) | 56 (5.6%) |
| 9:00 AM to 9:59 AM | 129 (13.7%) | 64 (6.4%) |
| 10:00 AM to 10:59 AM | 0 (0.0%) | 48 (4.8%) |
| 11:00 AM to 11:59 AM | 0 (0.0%) | 20 (2.0%) |
| 12:00 PM to 3:59 PM | 45 (4.8%) | 133 (13.3%) |
| 4:00 PM to 11:59 PM | 93 (9.9%) | 140 (14.0%) |
| Total | 941 (100.0%) | 1,003 (100.0%) |
Housing Occupancy in Ocean Shores
Occupancy by Ownership in Ocean Shores
Of the total 3,587 dwellings in Ocean Shores, owner-occupied units account for 2,881 (80.3%), while renter-occupied units make up 706 (19.7%).
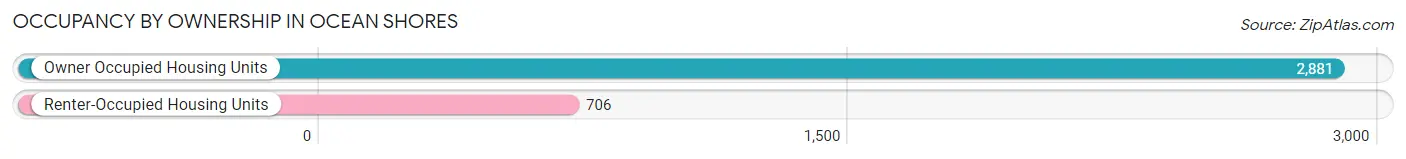
| Occupancy | # Housing Units | % Housing Units |
| Owner Occupied Housing Units | 2,881 | 80.3% |
| Renter-Occupied Housing Units | 706 | 19.7% |
| Total Occupied Housing Units | 3,587 | 100.0% |
Occupancy by Household Size in Ocean Shores
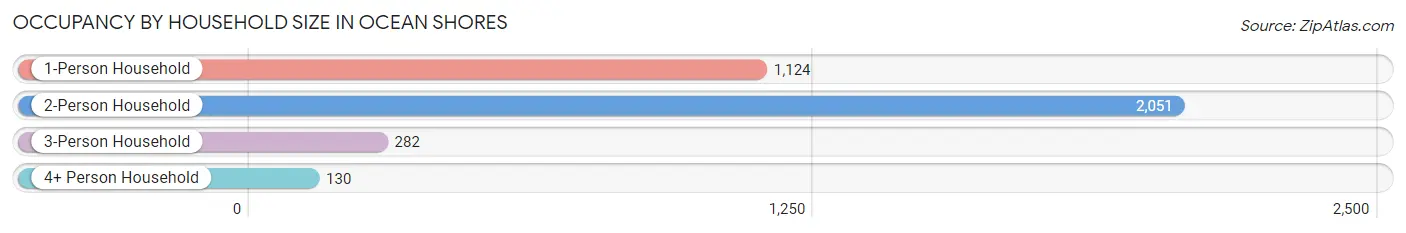
| Household Size | # Housing Units | % Housing Units |
| 1-Person Household | 1,124 | 31.3% |
| 2-Person Household | 2,051 | 57.2% |
| 3-Person Household | 282 | 7.9% |
| 4+ Person Household | 130 | 3.6% |
| Total Housing Units | 3,587 | 100.0% |
Occupancy by Ownership by Household Size in Ocean Shores
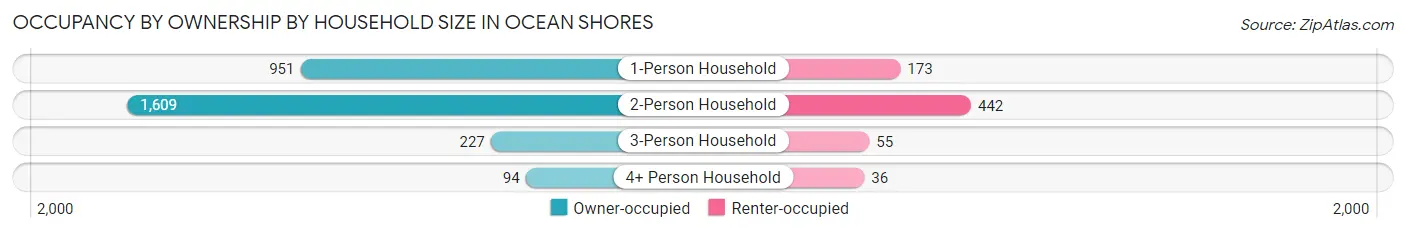
| Household Size | Owner-occupied | Renter-occupied |
| 1-Person Household | 951 (84.6%) | 173 (15.4%) |
| 2-Person Household | 1,609 (78.4%) | 442 (21.5%) |
| 3-Person Household | 227 (80.5%) | 55 (19.5%) |
| 4+ Person Household | 94 (72.3%) | 36 (27.7%) |
| Total Housing Units | 2,881 (80.3%) | 706 (19.7%) |
Occupancy by Educational Attainment in Ocean Shores
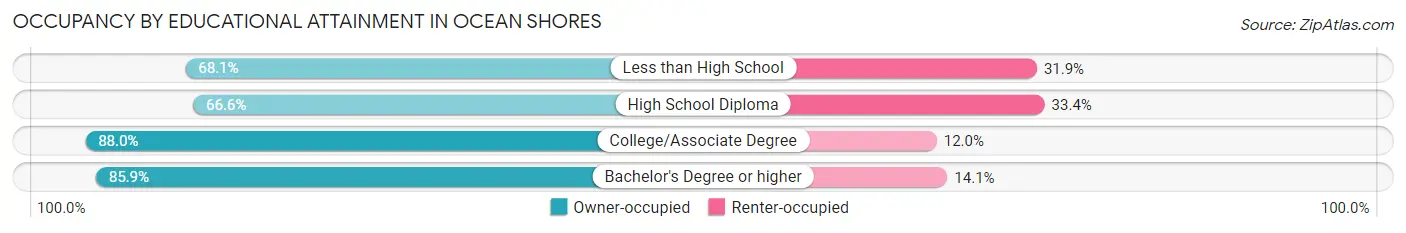
| Household Size | Owner-occupied | Renter-occupied |
| Less than High School | 156 (68.1%) | 73 (31.9%) |
| High School Diploma | 664 (66.6%) | 333 (33.4%) |
| College/Associate Degree | 1,398 (88.0%) | 191 (12.0%) |
| Bachelor's Degree or higher | 663 (85.9%) | 109 (14.1%) |
Occupancy by Age of Householder in Ocean Shores
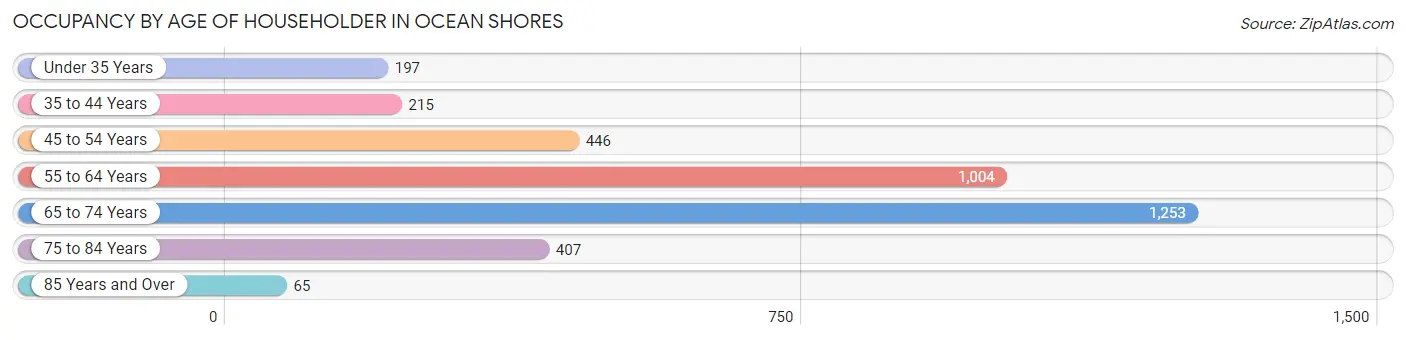
| Age Bracket | # Households | % Households |
| Under 35 Years | 197 | 5.5% |
| 35 to 44 Years | 215 | 6.0% |
| 45 to 54 Years | 446 | 12.4% |
| 55 to 64 Years | 1,004 | 28.0% |
| 65 to 74 Years | 1,253 | 34.9% |
| 75 to 84 Years | 407 | 11.4% |
| 85 Years and Over | 65 | 1.8% |
| Total | 3,587 | 100.0% |
Housing Finances in Ocean Shores
Median Income by Occupancy in Ocean Shores
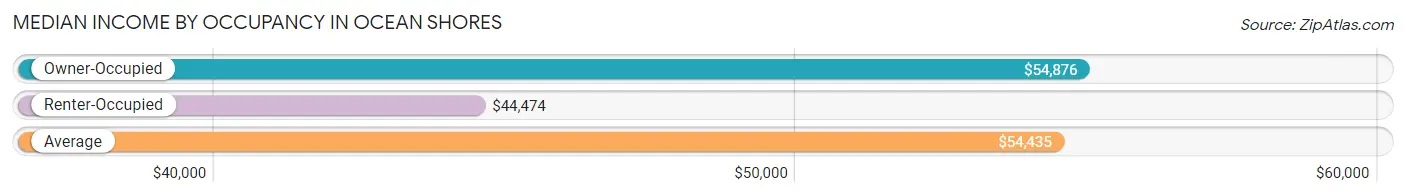
| Occupancy Type | # Households | Median Income |
| Owner-Occupied | 2,881 (80.3%) | $54,876 |
| Renter-Occupied | 706 (19.7%) | $44,474 |
| Average | 3,587 (100.0%) | $54,435 |
Occupancy by Householder Income Bracket in Ocean Shores
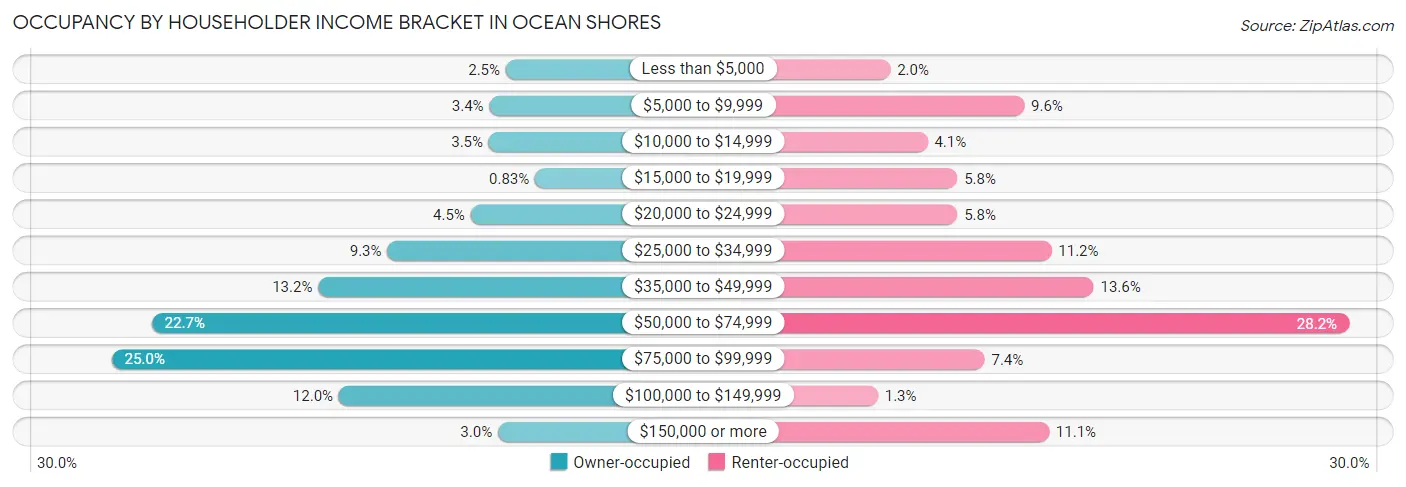
| Income Bracket | Owner-occupied | Renter-occupied |
| Less than $5,000 | 72 (2.5%) | 14 (2.0%) |
| $5,000 to $9,999 | 99 (3.4%) | 68 (9.6%) |
| $10,000 to $14,999 | 100 (3.5%) | 29 (4.1%) |
| $15,000 to $19,999 | 24 (0.8%) | 41 (5.8%) |
| $20,000 to $24,999 | 130 (4.5%) | 41 (5.8%) |
| $25,000 to $34,999 | 267 (9.3%) | 79 (11.2%) |
| $35,000 to $49,999 | 381 (13.2%) | 96 (13.6%) |
| $50,000 to $74,999 | 655 (22.7%) | 199 (28.2%) |
| $75,000 to $99,999 | 721 (25.0%) | 52 (7.4%) |
| $100,000 to $149,999 | 347 (12.0%) | 9 (1.3%) |
| $150,000 or more | 85 (2.9%) | 78 (11.1%) |
| Total | 2,881 (100.0%) | 706 (100.0%) |
Monthly Housing Cost Tiers in Ocean Shores
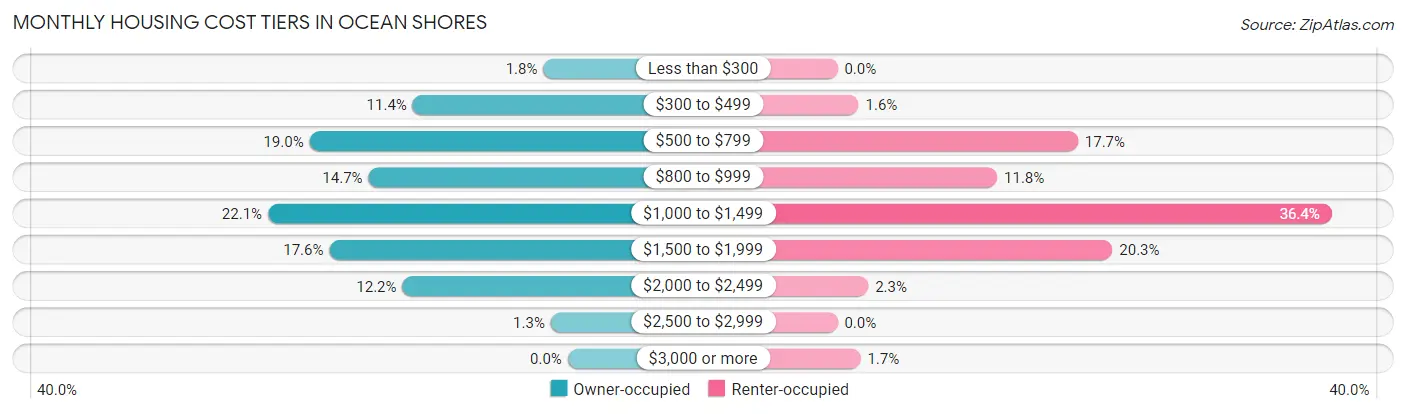
| Monthly Cost | Owner-occupied | Renter-occupied |
| Less than $300 | 52 (1.8%) | 0 (0.0%) |
| $300 to $499 | 329 (11.4%) | 11 (1.6%) |
| $500 to $799 | 548 (19.0%) | 125 (17.7%) |
| $800 to $999 | 423 (14.7%) | 83 (11.8%) |
| $1,000 to $1,499 | 636 (22.1%) | 257 (36.4%) |
| $1,500 to $1,999 | 506 (17.6%) | 143 (20.3%) |
| $2,000 to $2,499 | 351 (12.2%) | 16 (2.3%) |
| $2,500 to $2,999 | 36 (1.3%) | 0 (0.0%) |
| $3,000 or more | 0 (0.0%) | 12 (1.7%) |
| Total | 2,881 (100.0%) | 706 (100.0%) |
Physical Housing Characteristics in Ocean Shores
Housing Structures in Ocean Shores
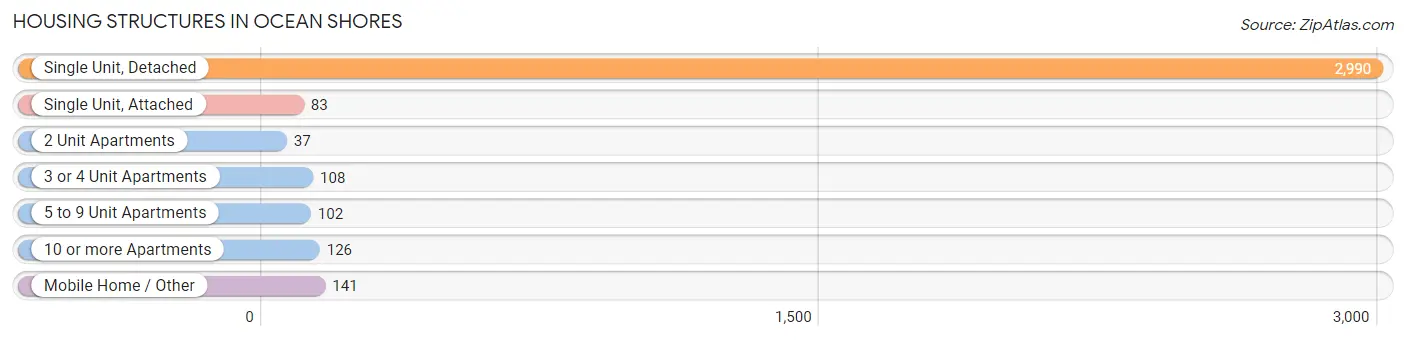
| Structure Type | # Housing Units | % Housing Units |
| Single Unit, Detached | 2,990 | 83.4% |
| Single Unit, Attached | 83 | 2.3% |
| 2 Unit Apartments | 37 | 1.0% |
| 3 or 4 Unit Apartments | 108 | 3.0% |
| 5 to 9 Unit Apartments | 102 | 2.8% |
| 10 or more Apartments | 126 | 3.5% |
| Mobile Home / Other | 141 | 3.9% |
| Total | 3,587 | 100.0% |
Housing Structures by Occupancy in Ocean Shores
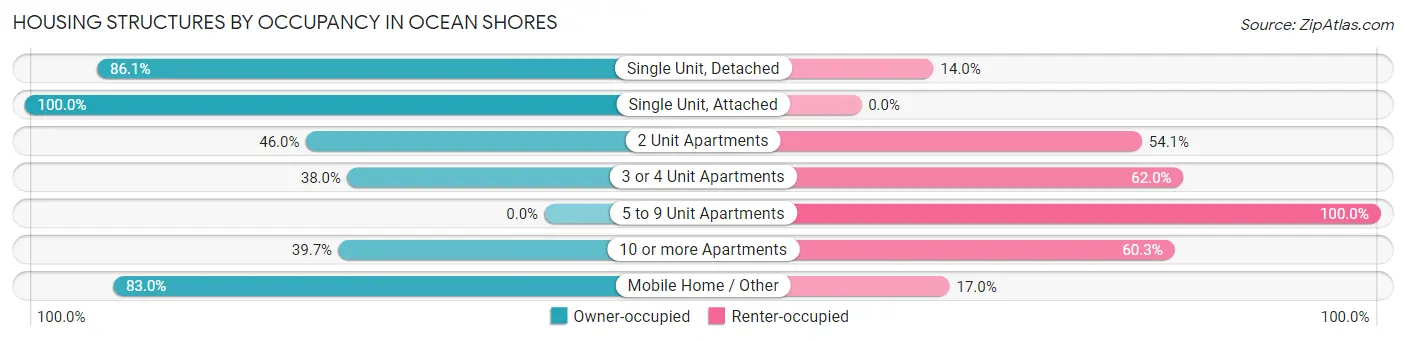
| Structure Type | Owner-occupied | Renter-occupied |
| Single Unit, Detached | 2,573 (86.1%) | 417 (14.0%) |
| Single Unit, Attached | 83 (100.0%) | 0 (0.0%) |
| 2 Unit Apartments | 17 (46.0%) | 20 (54.0%) |
| 3 or 4 Unit Apartments | 41 (38.0%) | 67 (62.0%) |
| 5 to 9 Unit Apartments | 0 (0.0%) | 102 (100.0%) |
| 10 or more Apartments | 50 (39.7%) | 76 (60.3%) |
| Mobile Home / Other | 117 (83.0%) | 24 (17.0%) |
| Total | 2,881 (80.3%) | 706 (19.7%) |
Housing Structures by Number of Rooms in Ocean Shores
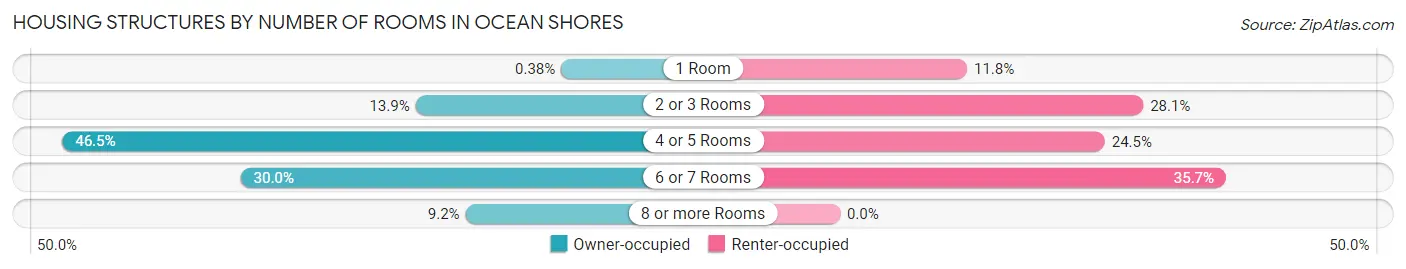
| Number of Rooms | Owner-occupied | Renter-occupied |
| 1 Room | 11 (0.4%) | 83 (11.8%) |
| 2 or 3 Rooms | 399 (13.9%) | 198 (28.1%) |
| 4 or 5 Rooms | 1,340 (46.5%) | 173 (24.5%) |
| 6 or 7 Rooms | 865 (30.0%) | 252 (35.7%) |
| 8 or more Rooms | 266 (9.2%) | 0 (0.0%) |
| Total | 2,881 (100.0%) | 706 (100.0%) |
Housing Structure by Heating Type in Ocean Shores
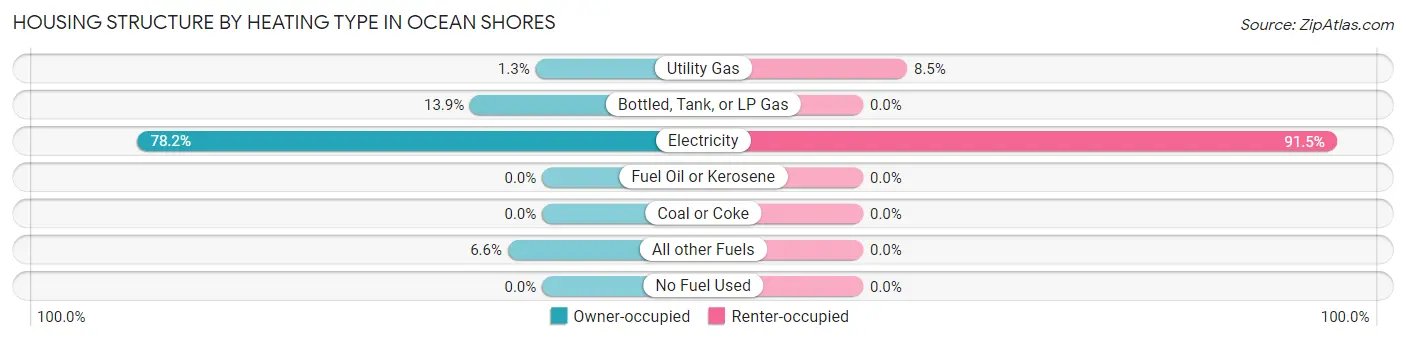
| Heating Type | Owner-occupied | Renter-occupied |
| Utility Gas | 37 (1.3%) | 60 (8.5%) |
| Bottled, Tank, or LP Gas | 401 (13.9%) | 0 (0.0%) |
| Electricity | 2,252 (78.2%) | 646 (91.5%) |
| Fuel Oil or Kerosene | 0 (0.0%) | 0 (0.0%) |
| Coal or Coke | 0 (0.0%) | 0 (0.0%) |
| All other Fuels | 191 (6.6%) | 0 (0.0%) |
| No Fuel Used | 0 (0.0%) | 0 (0.0%) |
| Total | 2,881 (100.0%) | 706 (100.0%) |
Household Vehicle Usage in Ocean Shores
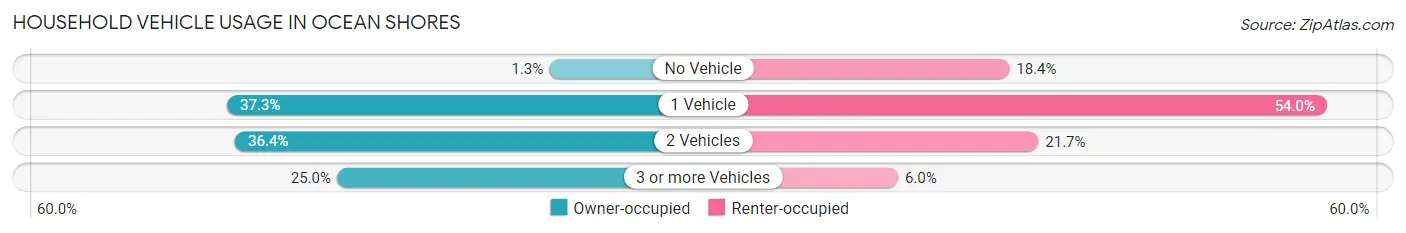
| Vehicles per Household | Owner-occupied | Renter-occupied |
| No Vehicle | 36 (1.3%) | 130 (18.4%) |
| 1 Vehicle | 1,075 (37.3%) | 381 (54.0%) |
| 2 Vehicles | 1,049 (36.4%) | 153 (21.7%) |
| 3 or more Vehicles | 721 (25.0%) | 42 (5.9%) |
| Total | 2,881 (100.0%) | 706 (100.0%) |
Real Estate & Mortgages in Ocean Shores
Real Estate and Mortgage Overview in Ocean Shores
| Characteristic | Without Mortgage | With Mortgage |
| Housing Units | 1,213 | 1,668 |
| Median Property Value | $294,100 | $311,100 |
| Median Household Income | $52,745 | $37 |
| Monthly Housing Costs | $580 | $0 |
| Real Estate Taxes | $2,429 | $0 |
Property Value by Mortgage Status in Ocean Shores
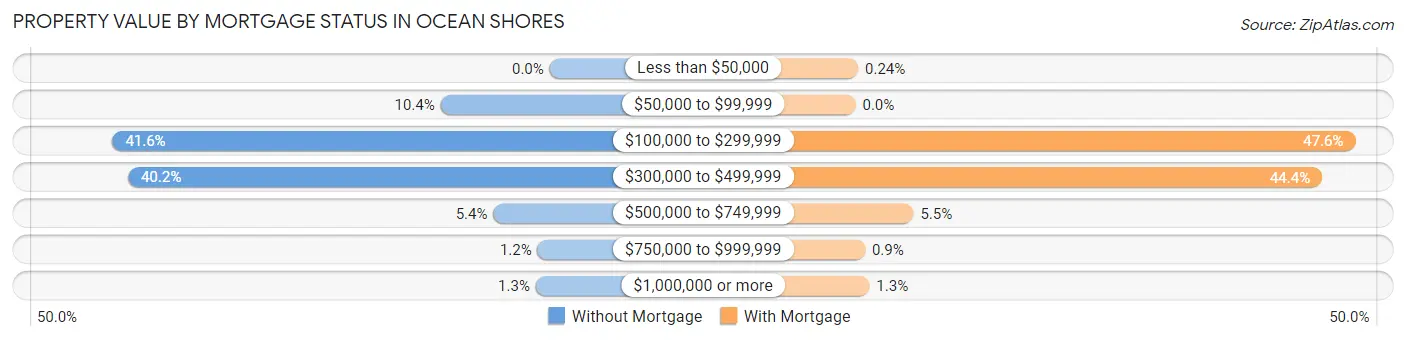
| Property Value | Without Mortgage | With Mortgage |
| Less than $50,000 | 0 (0.0%) | 4 (0.2%) |
| $50,000 to $99,999 | 126 (10.4%) | 0 (0.0%) |
| $100,000 to $299,999 | 505 (41.6%) | 794 (47.6%) |
| $300,000 to $499,999 | 487 (40.2%) | 741 (44.4%) |
| $500,000 to $749,999 | 65 (5.4%) | 92 (5.5%) |
| $750,000 to $999,999 | 14 (1.1%) | 15 (0.9%) |
| $1,000,000 or more | 16 (1.3%) | 22 (1.3%) |
| Total | 1,213 (100.0%) | 1,668 (100.0%) |
Household Income by Mortgage Status in Ocean Shores
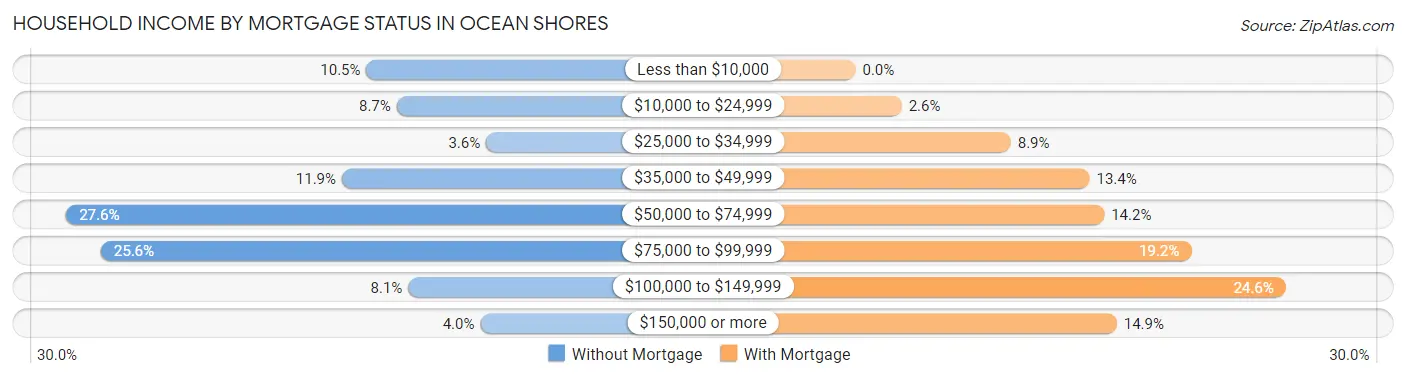
| Household Income | Without Mortgage | With Mortgage |
| Less than $10,000 | 127 (10.5%) | 0 (0.0%) |
| $10,000 to $24,999 | 106 (8.7%) | 44 (2.6%) |
| $25,000 to $34,999 | 44 (3.6%) | 148 (8.9%) |
| $35,000 to $49,999 | 144 (11.9%) | 223 (13.4%) |
| $50,000 to $74,999 | 335 (27.6%) | 237 (14.2%) |
| $75,000 to $99,999 | 311 (25.6%) | 320 (19.2%) |
| $100,000 to $149,999 | 98 (8.1%) | 410 (24.6%) |
| $150,000 or more | 48 (4.0%) | 249 (14.9%) |
| Total | 1,213 (100.0%) | 1,668 (100.0%) |
Property Value to Household Income Ratio in Ocean Shores
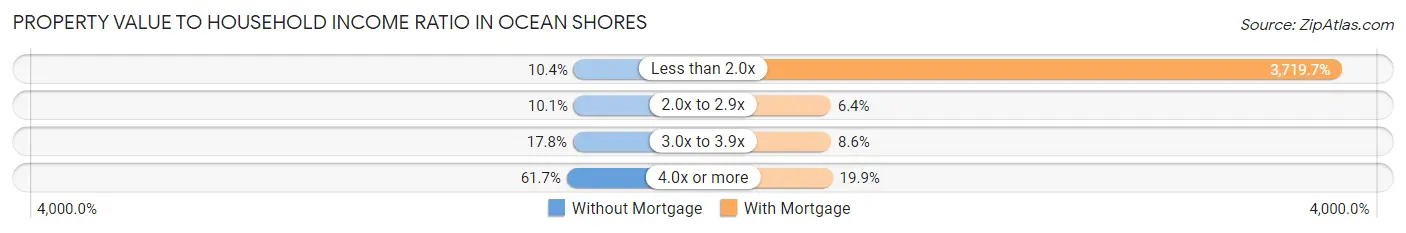
| Value-to-Income Ratio | Without Mortgage | With Mortgage |
| Less than 2.0x | 126 (10.4%) | 62,045 (3,719.7%) |
| 2.0x to 2.9x | 123 (10.1%) | 106 (6.4%) |
| 3.0x to 3.9x | 216 (17.8%) | 144 (8.6%) |
| 4.0x or more | 748 (61.7%) | 332 (19.9%) |
| Total | 1,213 (100.0%) | 1,668 (100.0%) |
Real Estate Taxes by Mortgage Status in Ocean Shores
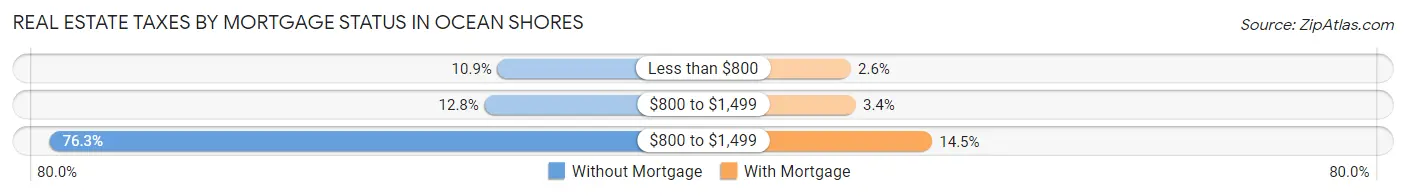
| Property Taxes | Without Mortgage | With Mortgage |
| Less than $800 | 132 (10.9%) | 44 (2.6%) |
| $800 to $1,499 | 155 (12.8%) | 56 (3.4%) |
| $800 to $1,499 | 926 (76.3%) | 242 (14.5%) |
| Total | 1,213 (100.0%) | 1,668 (100.0%) |
Health & Disability in Ocean Shores
Health Insurance Coverage by Age in Ocean Shores
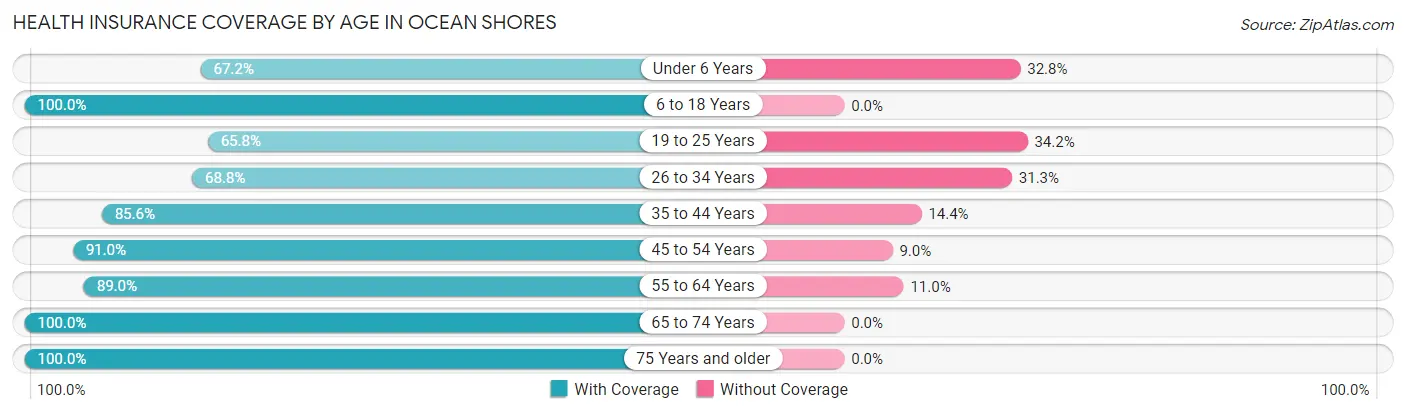
| Age Bracket | With Coverage | Without Coverage |
| Under 6 Years | 131 (67.2%) | 64 (32.8%) |
| 6 to 18 Years | 210 (100.0%) | 0 (0.0%) |
| 19 to 25 Years | 133 (65.8%) | 69 (34.2%) |
| 26 to 34 Years | 297 (68.8%) | 135 (31.2%) |
| 35 to 44 Years | 357 (85.6%) | 60 (14.4%) |
| 45 to 54 Years | 821 (91.0%) | 81 (9.0%) |
| 55 to 64 Years | 1,490 (89.0%) | 185 (11.0%) |
| 65 to 74 Years | 2,087 (100.0%) | 0 (0.0%) |
| 75 Years and older | 718 (100.0%) | 0 (0.0%) |
| Total | 6,244 (91.3%) | 594 (8.7%) |
Health Insurance Coverage by Citizenship Status in Ocean Shores
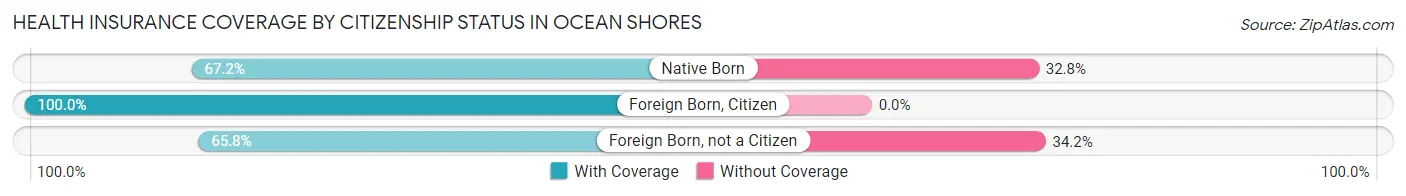
| Citizenship Status | With Coverage | Without Coverage |
| Native Born | 131 (67.2%) | 64 (32.8%) |
| Foreign Born, Citizen | 210 (100.0%) | 0 (0.0%) |
| Foreign Born, not a Citizen | 133 (65.8%) | 69 (34.2%) |
Health Insurance Coverage by Household Income in Ocean Shores
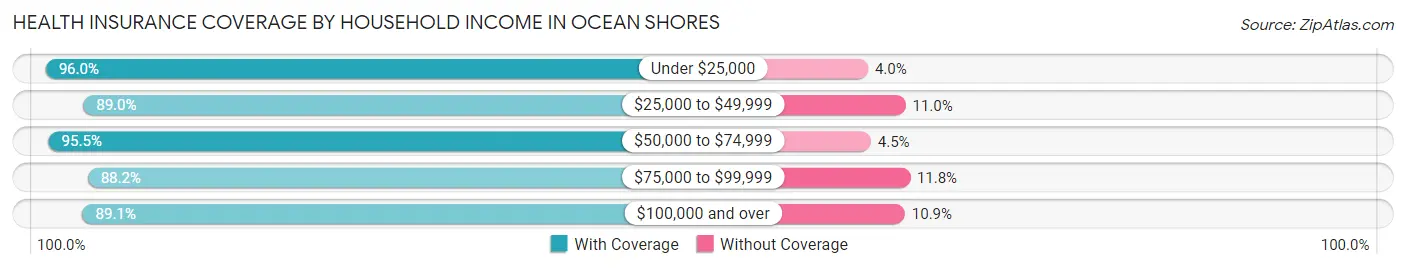
| Household Income | With Coverage | Without Coverage |
| Under $25,000 | 947 (96.0%) | 39 (4.0%) |
| $25,000 to $49,999 | 1,157 (89.0%) | 143 (11.0%) |
| $50,000 to $74,999 | 1,526 (95.5%) | 72 (4.5%) |
| $75,000 to $99,999 | 1,557 (88.2%) | 209 (11.8%) |
| $100,000 and over | 1,040 (89.1%) | 127 (10.9%) |
Public vs Private Health Insurance Coverage by Age in Ocean Shores
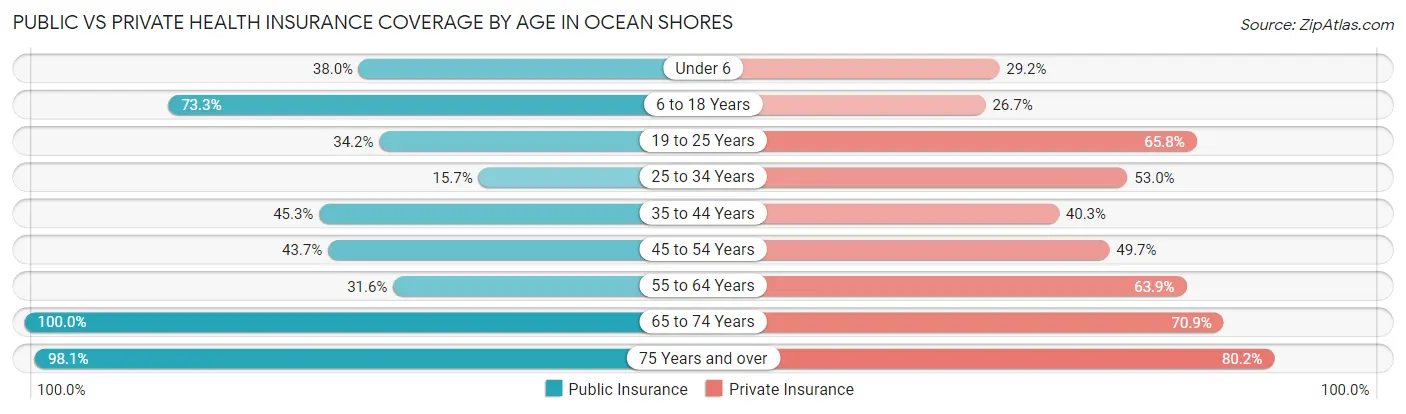
| Age Bracket | Public Insurance | Private Insurance |
| Under 6 | 74 (38.0%) | 57 (29.2%) |
| 6 to 18 Years | 154 (73.3%) | 56 (26.7%) |
| 19 to 25 Years | 69 (34.2%) | 133 (65.8%) |
| 25 to 34 Years | 68 (15.7%) | 229 (53.0%) |
| 35 to 44 Years | 189 (45.3%) | 168 (40.3%) |
| 45 to 54 Years | 394 (43.7%) | 448 (49.7%) |
| 55 to 64 Years | 529 (31.6%) | 1,071 (63.9%) |
| 65 to 74 Years | 2,087 (100.0%) | 1,479 (70.9%) |
| 75 Years and over | 704 (98.1%) | 576 (80.2%) |
| Total | 4,268 (62.4%) | 4,217 (61.7%) |
Disability Status by Sex by Age in Ocean Shores
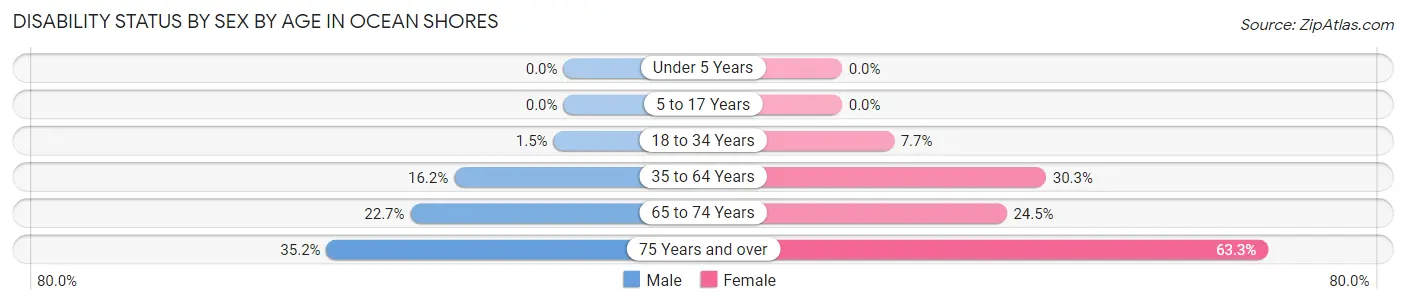
| Age Bracket | Male | Female |
| Under 5 Years | 0 (0.0%) | 0 (0.0%) |
| 5 to 17 Years | 0 (0.0%) | 0 (0.0%) |
| 18 to 34 Years | 3 (1.5%) | 35 (7.7%) |
| 35 to 64 Years | 264 (16.2%) | 414 (30.3%) |
| 65 to 74 Years | 214 (22.7%) | 280 (24.4%) |
| 75 Years and over | 127 (35.2%) | 226 (63.3%) |
Disability Class by Sex by Age in Ocean Shores
Disability Class: Hearing Difficulty
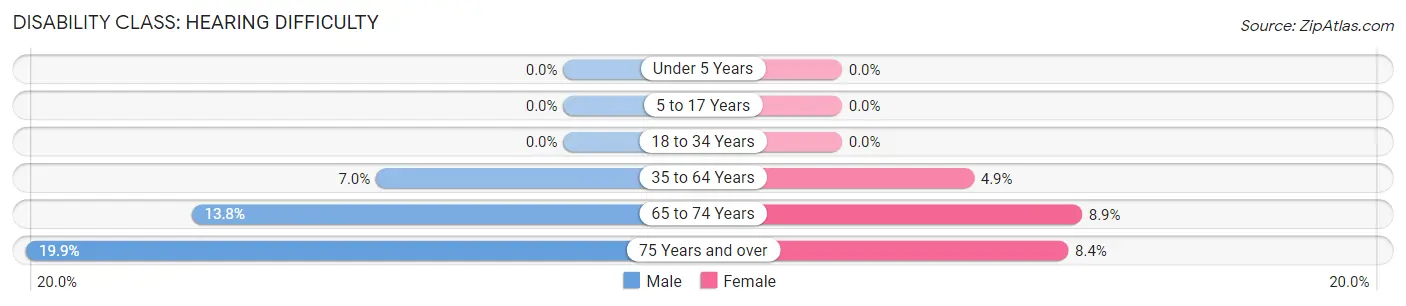
| Age Bracket | Male | Female |
| Under 5 Years | 0 (0.0%) | 0 (0.0%) |
| 5 to 17 Years | 0 (0.0%) | 0 (0.0%) |
| 18 to 34 Years | 0 (0.0%) | 0 (0.0%) |
| 35 to 64 Years | 113 (7.0%) | 67 (4.9%) |
| 65 to 74 Years | 130 (13.8%) | 102 (8.9%) |
| 75 Years and over | 72 (19.9%) | 30 (8.4%) |
Disability Class: Vision Difficulty
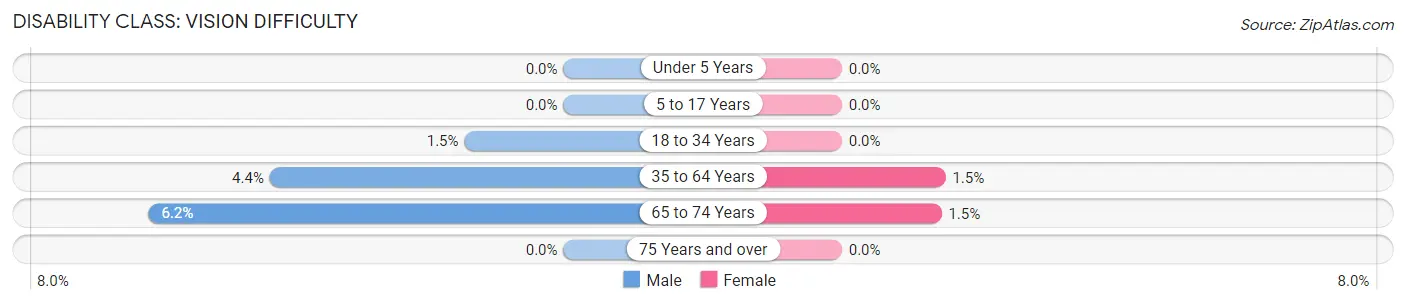
| Age Bracket | Male | Female |
| Under 5 Years | 0 (0.0%) | 0 (0.0%) |
| 5 to 17 Years | 0 (0.0%) | 0 (0.0%) |
| 18 to 34 Years | 3 (1.5%) | 0 (0.0%) |
| 35 to 64 Years | 71 (4.4%) | 21 (1.5%) |
| 65 to 74 Years | 58 (6.2%) | 17 (1.5%) |
| 75 Years and over | 0 (0.0%) | 0 (0.0%) |
Disability Class: Cognitive Difficulty
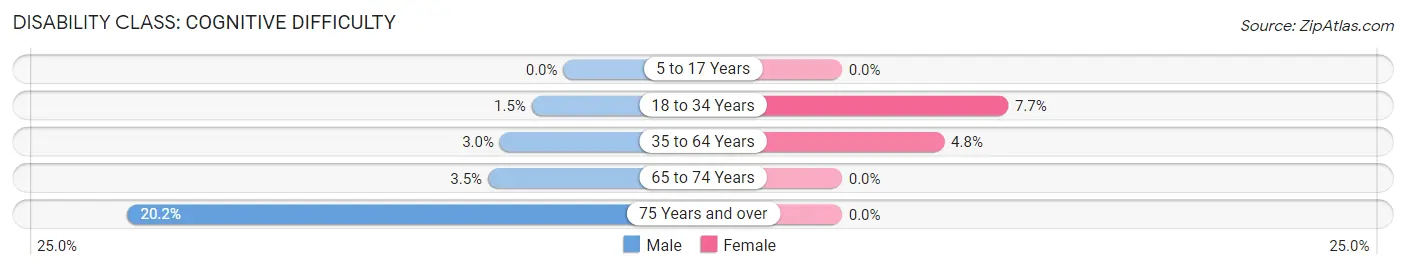
| Age Bracket | Male | Female |
| 5 to 17 Years | 0 (0.0%) | 0 (0.0%) |
| 18 to 34 Years | 3 (1.5%) | 35 (7.7%) |
| 35 to 64 Years | 48 (2.9%) | 65 (4.8%) |
| 65 to 74 Years | 33 (3.5%) | 0 (0.0%) |
| 75 Years and over | 73 (20.2%) | 0 (0.0%) |
Disability Class: Ambulatory Difficulty
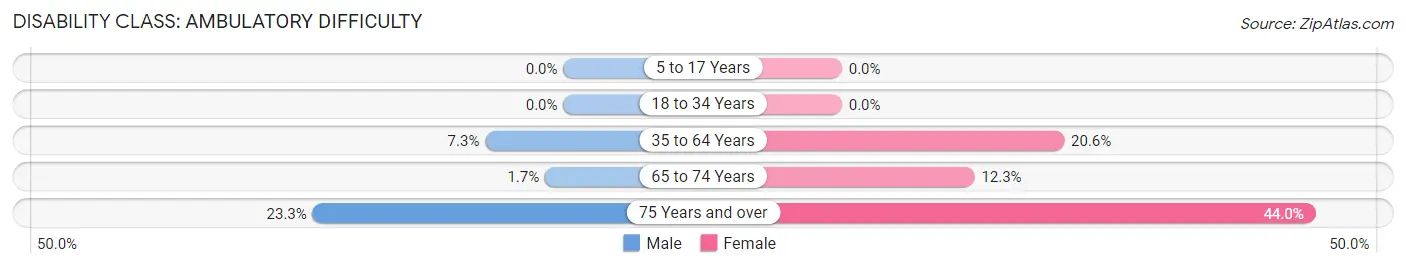
| Age Bracket | Male | Female |
| 5 to 17 Years | 0 (0.0%) | 0 (0.0%) |
| 18 to 34 Years | 0 (0.0%) | 0 (0.0%) |
| 35 to 64 Years | 118 (7.2%) | 282 (20.6%) |
| 65 to 74 Years | 16 (1.7%) | 141 (12.3%) |
| 75 Years and over | 84 (23.3%) | 157 (44.0%) |
Disability Class: Self-Care Difficulty
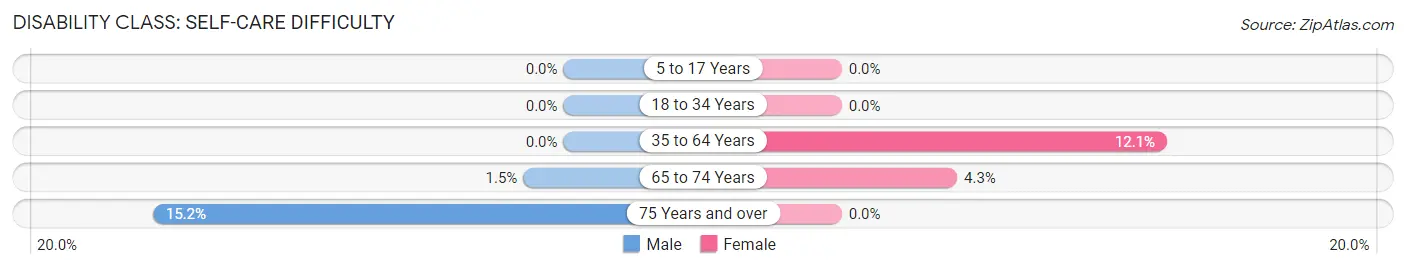
| Age Bracket | Male | Female |
| 5 to 17 Years | 0 (0.0%) | 0 (0.0%) |
| 18 to 34 Years | 0 (0.0%) | 0 (0.0%) |
| 35 to 64 Years | 0 (0.0%) | 165 (12.1%) |
| 65 to 74 Years | 14 (1.5%) | 49 (4.3%) |
| 75 Years and over | 55 (15.2%) | 0 (0.0%) |
Technology Access in Ocean Shores
Computing Device Access in Ocean Shores
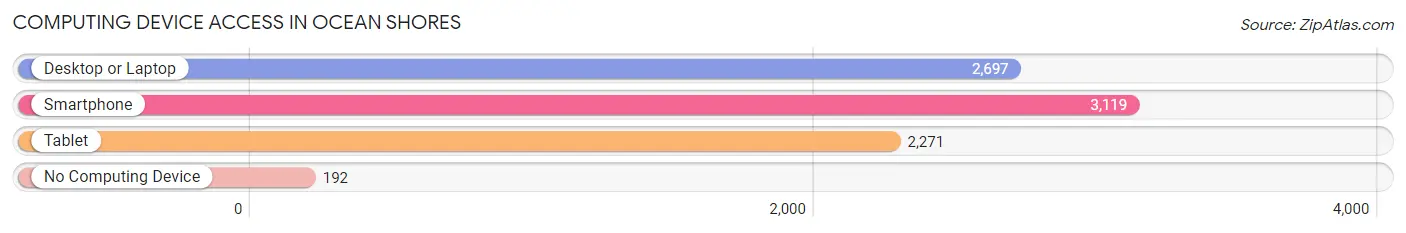
| Device Type | # Households | % Households |
| Desktop or Laptop | 2,697 | 75.2% |
| Smartphone | 3,119 | 87.0% |
| Tablet | 2,271 | 63.3% |
| No Computing Device | 192 | 5.3% |
| Total | 3,587 | 100.0% |
Internet Access in Ocean Shores
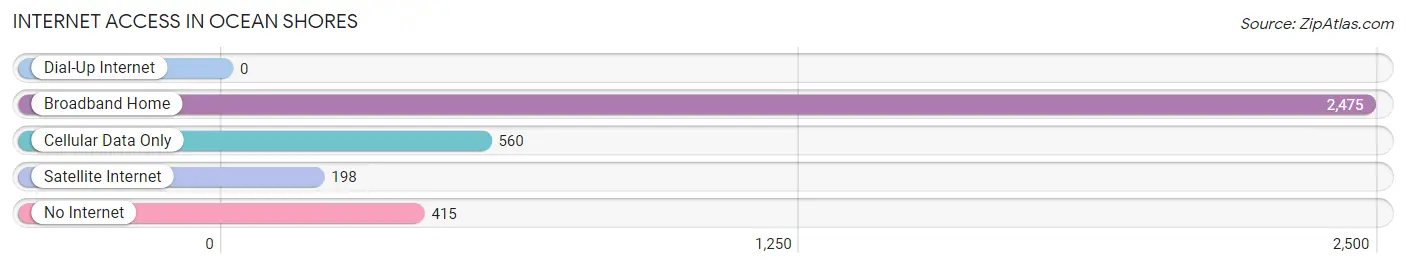
| Internet Type | # Households | % Households |
| Dial-Up Internet | 0 | 0.0% |
| Broadband Home | 2,475 | 69.0% |
| Cellular Data Only | 560 | 15.6% |
| Satellite Internet | 198 | 5.5% |
| No Internet | 415 | 11.6% |
| Total | 3,587 | 100.0% |
Ocean Shores Summary
Ocean Shores, Washington is a small city located on the Pacific Coast of Washington State. It is situated on the northern end of the Olympic Peninsula, approximately two hours west of Seattle. The city was incorporated in 1965 and has a population of approximately 6,500 people.
History
The area that is now Ocean Shores was originally inhabited by the Quinault Indian Nation. The Quinault people were a coastal tribe that lived in the area for thousands of years before the arrival of European settlers. The first Europeans to explore the area were Spanish explorers in the late 1700s.
In the late 1800s, the area was settled by homesteaders and loggers. The first permanent settlement was established in 1891 by a man named John B. Shores. He named the settlement Ocean Shores after the nearby ocean.
In the early 1900s, the area began to attract tourists. The first hotel was built in 1906 and the first boardwalk was constructed in 1910. The boardwalk was a popular destination for tourists and locals alike.
In 1965, the city of Ocean Shores was officially incorporated. The city has since grown to become a popular tourist destination.
Geography
Ocean Shores is located on the northern end of the Olympic Peninsula in Washington State. It is situated on the Pacific Coast, approximately two hours west of Seattle. The city is bordered by the Pacific Ocean to the west, the Quinault Indian Reservation to the north, and Grays Harbor to the east.
The city has a total area of 8.3 square miles, of which 7.9 square miles is land and 0.4 square miles is water. The city is located at an elevation of approximately 20 feet above sea level.
The climate in Ocean Shores is mild and temperate. The average temperature in the summer is around 70 degrees Fahrenheit and the average temperature in the winter is around 45 degrees Fahrenheit. The city receives an average of 40 inches of rain per year.
Economy
The economy of Ocean Shores is largely based on tourism. The city is a popular destination for beachgoers, fishermen, and nature lovers. The city also has a thriving retail sector, with many shops and restaurants located along the boardwalk.
The city is also home to several businesses that provide services to the local community. These include medical and dental offices, banks, and other professional services.
Demographics
As of the 2010 census, the population of Ocean Shores was 6,569. The racial makeup of the city was 91.3% White, 0.7% African American, 0.7% Native American, 0.9% Asian, 0.1% Pacific Islander, 2.2% from other races, and 4.1% from two or more races. Hispanic or Latino of any race were 5.2% of the population.
The median income for a household in the city was $37,917, and the median income for a family was $45,938. The per capita income for the city was $20,945. About 11.2% of families and 14.2% of the population were below the poverty line, including 19.2% of those under age 18 and 8.2% of those age 65 or over.
Common Questions
What is Per Capita Income in Ocean Shores?
Per Capita income in Ocean Shores is $33,662.
What is the Median Family Income in Ocean Shores?
Median Family Income in Ocean Shores is $69,948.
What is the Median Household income in Ocean Shores?
Median Household Income in Ocean Shores is $54,435.
What is Income or Wage Gap in Ocean Shores?
Income or Wage Gap in Ocean Shores is 10.9%.
Women in Ocean Shores earn 89.1 cents for every dollar earned by a man.
What is Inequality or Gini Index in Ocean Shores?
Inequality or Gini Index in Ocean Shores is 0.36.
What is the Total Population of Ocean Shores?
Total Population of Ocean Shores is 6,838.
What is the Total Male Population of Ocean Shores?
Total Male Population of Ocean Shores is 3,311.
What is the Total Female Population of Ocean Shores?
Total Female Population of Ocean Shores is 3,527.
What is the Ratio of Males per 100 Females in Ocean Shores?
There are 93.88 Males per 100 Females in Ocean Shores.
What is the Ratio of Females per 100 Males in Ocean Shores?
There are 106.52 Females per 100 Males in Ocean Shores.
What is the Median Population Age in Ocean Shores?
Median Population Age in Ocean Shores is 62.1 Years.
What is the Average Family Size in Ocean Shores
Average Family Size in Ocean Shores is 2.3 People.
What is the Average Household Size in Ocean Shores
Average Household Size in Ocean Shores is 1.9 People.
How Large is the Labor Force in Ocean Shores?
There are 2,357 People in the Labor Forcein in Ocean Shores.
What is the Percentage of People in the Labor Force in Ocean Shores?
36.5% of People are in the Labor Force in Ocean Shores.
What is the Unemployment Rate in Ocean Shores?
Unemployment Rate in Ocean Shores is 5.3%.