Cities with the Highest Poverty Level in Washington
RELATED REPORTS & OPTIONS
Highest Poverty
Washington
Compare Cities
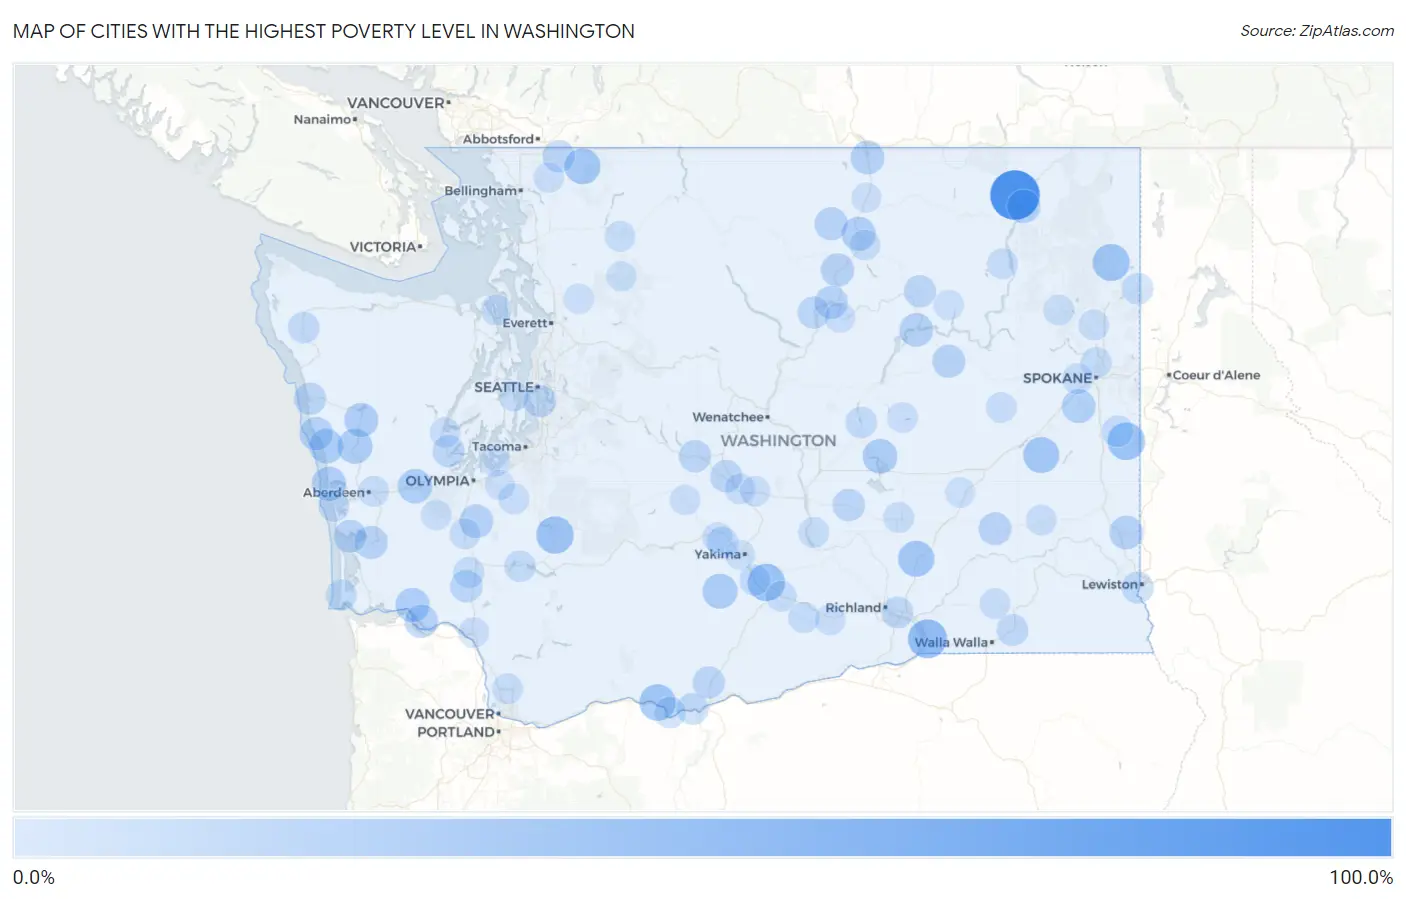
Map of Cities with the Highest Poverty Level in Washington
0.0%
100.0%
Cities with the Highest Poverty Level in Washington
| City | Poverty | vs State | vs National | |
| 1. | Boyds | 100.0% | 9.9%(+90.1)#1 | 12.5%(+87.5)#62 |
| 2. | Wallula | 54.5% | 9.9%(+44.6)#2 | 12.5%(+42.0)#681 |
| 3. | Latah | 48.8% | 9.9%(+38.9)#3 | 12.5%(+36.2)#983 |
| 4. | Buena | 48.4% | 9.9%(+38.5)#4 | 12.5%(+35.9)#1,008 |
| 5. | Mineral | 47.8% | 9.9%(+37.9)#5 | 12.5%(+35.3)#1,035 |
| 6. | Cusick | 46.5% | 9.9%(+36.6)#6 | 12.5%(+34.0)#1,141 |
| 7. | Lyle | 44.5% | 9.9%(+34.6)#7 | 12.5%(+32.0)#1,286 |
| 8. | Mesa | 42.8% | 9.9%(+32.9)#8 | 12.5%(+30.3)#1,436 |
| 9. | Lamont | 42.8% | 9.9%(+32.9)#9 | 12.5%(+30.2)#1,440 |
| 10. | Glacier | 41.9% | 9.9%(+32.0)#10 | 12.5%(+29.4)#1,510 |
| 11. | White Swan | 38.1% | 9.9%(+28.2)#11 | 12.5%(+25.6)#1,889 |
| 12. | Humptulips | 38.0% | 9.9%(+28.1)#12 | 12.5%(+25.4)#1,913 |
| 13. | Moses Lake North | 37.2% | 9.9%(+27.3)#13 | 12.5%(+24.6)#2,032 |
| 14. | Qui Nai Elt Village | 36.7% | 9.9%(+26.8)#14 | 12.5%(+24.2)#2,100 |
| 15. | Elma | 35.7% | 9.9%(+25.8)#15 | 12.5%(+23.2)#2,243 |
| 16. | Oyehut | 35.3% | 9.9%(+25.4)#16 | 12.5%(+22.8)#2,317 |
| 17. | Skamokawa Valley | 34.7% | 9.9%(+24.8)#17 | 12.5%(+22.2)#2,399 |
| 18. | Neilton | 34.5% | 9.9%(+24.6)#18 | 12.5%(+22.0)#2,430 |
| 19. | Riverside | 34.4% | 9.9%(+24.5)#19 | 12.5%(+21.8)#2,461 |
| 20. | Cheney | 33.3% | 9.9%(+23.4)#20 | 12.5%(+20.8)#2,683 |
| 21. | Bucoda | 33.0% | 9.9%(+23.1)#21 | 12.5%(+20.4)#2,743 |
| 22. | Oroville | 32.7% | 9.9%(+22.8)#22 | 12.5%(+20.2)#2,794 |
| 23. | Marcus | 32.4% | 9.9%(+22.5)#23 | 12.5%(+19.9)#2,850 |
| 24. | Taholah | 32.4% | 9.9%(+22.5)#24 | 12.5%(+19.9)#2,858 |
| 25. | Pullman | 32.4% | 9.9%(+22.5)#25 | 12.5%(+19.8)#2,863 |
| 26. | Grand Coulee | 32.4% | 9.9%(+22.5)#26 | 12.5%(+19.8)#2,865 |
| 27. | Malott | 31.5% | 9.9%(+21.6)#27 | 12.5%(+19.0)#3,082 |
| 28. | Conconully | 31.2% | 9.9%(+21.3)#28 | 12.5%(+18.6)#3,154 |
| 29. | East Cathlamet | 31.0% | 9.9%(+21.1)#29 | 12.5%(+18.4)#3,194 |
| 30. | Brewster | 30.8% | 9.9%(+20.9)#30 | 12.5%(+18.3)#3,225 |
| 31. | South Bend | 30.4% | 9.9%(+20.5)#31 | 12.5%(+17.9)#3,303 |
| 32. | Wilbur | 30.4% | 9.9%(+20.5)#32 | 12.5%(+17.8)#3,321 |
| 33. | Washtucna | 29.5% | 9.9%(+19.6)#33 | 12.5%(+17.0)#3,512 |
| 34. | Tokeland | 29.4% | 9.9%(+19.5)#34 | 12.5%(+16.9)#3,553 |
| 35. | South Cle Elum | 28.0% | 9.9%(+18.1)#35 | 12.5%(+15.4)#3,981 |
| 36. | Vader | 27.8% | 9.9%(+17.9)#36 | 12.5%(+15.3)#4,044 |
| 37. | Thorp | 27.8% | 9.9%(+17.9)#37 | 12.5%(+15.2)#4,055 |
| 38. | Royal City | 27.6% | 9.9%(+17.7)#38 | 12.5%(+15.1)#4,097 |
| 39. | Peaceful Valley | 27.5% | 9.9%(+17.6)#39 | 12.5%(+15.0)#4,135 |
| 40. | Goldendale | 27.5% | 9.9%(+17.6)#40 | 12.5%(+15.0)#4,138 |
| 41. | Queets | 27.2% | 9.9%(+17.3)#41 | 12.5%(+14.7)#4,249 |
| 42. | Nespelem | 27.1% | 9.9%(+17.2)#42 | 12.5%(+14.6)#4,289 |
| 43. | Pateros | 27.1% | 9.9%(+17.2)#43 | 12.5%(+14.6)#4,290 |
| 44. | Boulevard Park | 27.0% | 9.9%(+17.1)#44 | 12.5%(+14.5)#4,315 |
| 45. | Shelton | 26.5% | 9.9%(+16.6)#45 | 12.5%(+14.0)#4,484 |
| 46. | Wishram | 25.3% | 9.9%(+15.4)#46 | 12.5%(+12.8)#4,923 |
| 47. | West Pasco | 25.0% | 9.9%(+15.1)#47 | 12.5%(+12.5)#5,033 |
| 48. | West Clarkston Highland | 25.0% | 9.9%(+15.1)#48 | 12.5%(+12.5)#5,035 |
| 49. | Dixie | 25.0% | 9.9%(+15.1)#49 | 12.5%(+12.5)#5,057 |
| 50. | Waverly | 24.7% | 9.9%(+14.8)#50 | 12.5%(+12.2)#5,173 |
| 51. | Forks | 24.6% | 9.9%(+14.7)#51 | 12.5%(+12.0)#5,244 |
| 52. | Dallesport | 24.5% | 9.9%(+14.6)#52 | 12.5%(+11.9)#5,283 |
| 53. | Soap Lake | 23.9% | 9.9%(+14.0)#53 | 12.5%(+11.3)#5,538 |
| 54. | Newport | 23.8% | 9.9%(+13.9)#54 | 12.5%(+11.3)#5,558 |
| 55. | Cowiche | 23.8% | 9.9%(+13.9)#55 | 12.5%(+11.3)#5,560 |
| 56. | Mossyrock | 23.6% | 9.9%(+13.7)#56 | 12.5%(+11.1)#5,659 |
| 57. | Winlock | 22.9% | 9.9%(+13.0)#57 | 12.5%(+10.3)#6,011 |
| 58. | Wapato | 22.5% | 9.9%(+12.6)#58 | 12.5%(+10.00)#6,171 |
| 59. | Long Beach | 22.5% | 9.9%(+12.6)#59 | 12.5%(+9.97)#6,189 |
| 60. | Mabton | 22.4% | 9.9%(+12.5)#60 | 12.5%(+9.86)#6,245 |
| 61. | Country Homes | 22.4% | 9.9%(+12.5)#61 | 12.5%(+9.83)#6,263 |
| 62. | Westport | 22.1% | 9.9%(+12.2)#62 | 12.5%(+9.52)#6,422 |
| 63. | Rockport | 22.0% | 9.9%(+12.1)#63 | 12.5%(+9.50)#6,436 |
| 64. | Mattawa | 21.9% | 9.9%(+12.0)#64 | 12.5%(+9.34)#6,536 |
| 65. | Othello | 21.9% | 9.9%(+12.0)#65 | 12.5%(+9.32)#6,554 |
| 66. | Mckenna | 21.8% | 9.9%(+11.9)#66 | 12.5%(+9.29)#6,575 |
| 67. | Dollars Corner | 21.6% | 9.9%(+11.7)#67 | 12.5%(+9.09)#6,683 |
| 68. | Inchelium | 21.6% | 9.9%(+11.7)#68 | 12.5%(+9.06)#6,701 |
| 69. | Centralia | 21.6% | 9.9%(+11.7)#69 | 12.5%(+9.04)#6,717 |
| 70. | Airway Heights | 21.3% | 9.9%(+11.4)#70 | 12.5%(+8.75)#6,873 |
| 71. | North Omak | 21.3% | 9.9%(+11.4)#71 | 12.5%(+8.73)#6,884 |
| 72. | Marrowstone | 21.2% | 9.9%(+11.3)#72 | 12.5%(+8.67)#6,919 |
| 73. | Deer Park | 21.1% | 9.9%(+11.2)#73 | 12.5%(+8.57)#6,972 |
| 74. | Granger | 21.0% | 9.9%(+11.1)#74 | 12.5%(+8.47)#7,032 |
| 75. | Aberdeen | 21.0% | 9.9%(+11.1)#75 | 12.5%(+8.43)#7,063 |
| 76. | Harrington | 20.9% | 9.9%(+11.0)#76 | 12.5%(+8.35)#7,109 |
| 77. | Ellensburg | 20.9% | 9.9%(+11.0)#77 | 12.5%(+8.35)#7,115 |
| 78. | Lacrosse | 20.9% | 9.9%(+11.0)#78 | 12.5%(+8.33)#7,128 |
| 79. | Prescott | 20.9% | 9.9%(+11.0)#79 | 12.5%(+8.33)#7,133 |
| 80. | Tieton | 20.8% | 9.9%(+10.9)#80 | 12.5%(+8.23)#7,177 |
| 81. | Wilson Creek | 20.7% | 9.9%(+10.8)#81 | 12.5%(+8.15)#7,219 |
| 82. | Springdale | 20.6% | 9.9%(+10.7)#82 | 12.5%(+8.06)#7,286 |
| 83. | Prosser | 20.5% | 9.9%(+10.6)#83 | 12.5%(+8.00)#7,319 |
| 84. | Skokomish | 20.5% | 9.9%(+10.6)#84 | 12.5%(+7.96)#7,335 |
| 85. | Deming | 20.4% | 9.9%(+10.5)#85 | 12.5%(+7.84)#7,413 |
| 86. | Oakville | 20.3% | 9.9%(+10.4)#86 | 12.5%(+7.80)#7,437 |
| 87. | Kelso | 20.0% | 9.9%(+10.1)#87 | 12.5%(+7.47)#7,622 |
| 88. | Bridgeport | 20.0% | 9.9%(+10.1)#88 | 12.5%(+7.44)#7,657 |
| 89. | Cliffdell | 19.7% | 9.9%(+9.78)#89 | 12.5%(+7.14)#7,854 |
| 90. | Kittitas | 19.5% | 9.9%(+9.62)#90 | 12.5%(+6.98)#7,945 |
| 91. | Manchester | 19.5% | 9.9%(+9.61)#91 | 12.5%(+6.97)#7,952 |
| 92. | Lind | 19.2% | 9.9%(+9.26)#92 | 12.5%(+6.62)#8,176 |
| 93. | Keller | 19.1% | 9.9%(+9.24)#93 | 12.5%(+6.61)#8,189 |
| 94. | Canyon Creek | 19.1% | 9.9%(+9.21)#94 | 12.5%(+6.57)#8,211 |
| 95. | Yakima | 19.1% | 9.9%(+9.21)#95 | 12.5%(+6.57)#8,212 |
| 96. | Clear Lake Cdp Skagit County | 19.0% | 9.9%(+9.13)#96 | 12.5%(+6.49)#8,272 |
| 97. | Anderson Island | 18.9% | 9.9%(+8.98)#97 | 12.5%(+6.34)#8,362 |
| 98. | Darrington | 18.8% | 9.9%(+8.93)#98 | 12.5%(+6.29)#8,394 |
| 99. | Nisqually Indian Community | 18.8% | 9.9%(+8.92)#99 | 12.5%(+6.28)#8,398 |
| 100. | Tonasket | 18.8% | 9.9%(+8.88)#100 | 12.5%(+6.25)#8,425 |
Common Questions
What are the Top 10 Cities with the Highest Poverty Level in Washington?
Top 10 Cities with the Highest Poverty Level in Washington are:
What city has the Highest Poverty Level in Washington?
Boyds has the Highest Poverty Level in Washington with 100.0%.
What is the Poverty Level in the State of Washington?
Poverty Level in Washington is 9.9%.
What is the Poverty Level in the United States?
Poverty Level in the United States is 12.5%.