Cities with the Most Immigrants from Egypt in Washington
RELATED REPORTS & OPTIONS
Egypt
Washington
Compare Cities
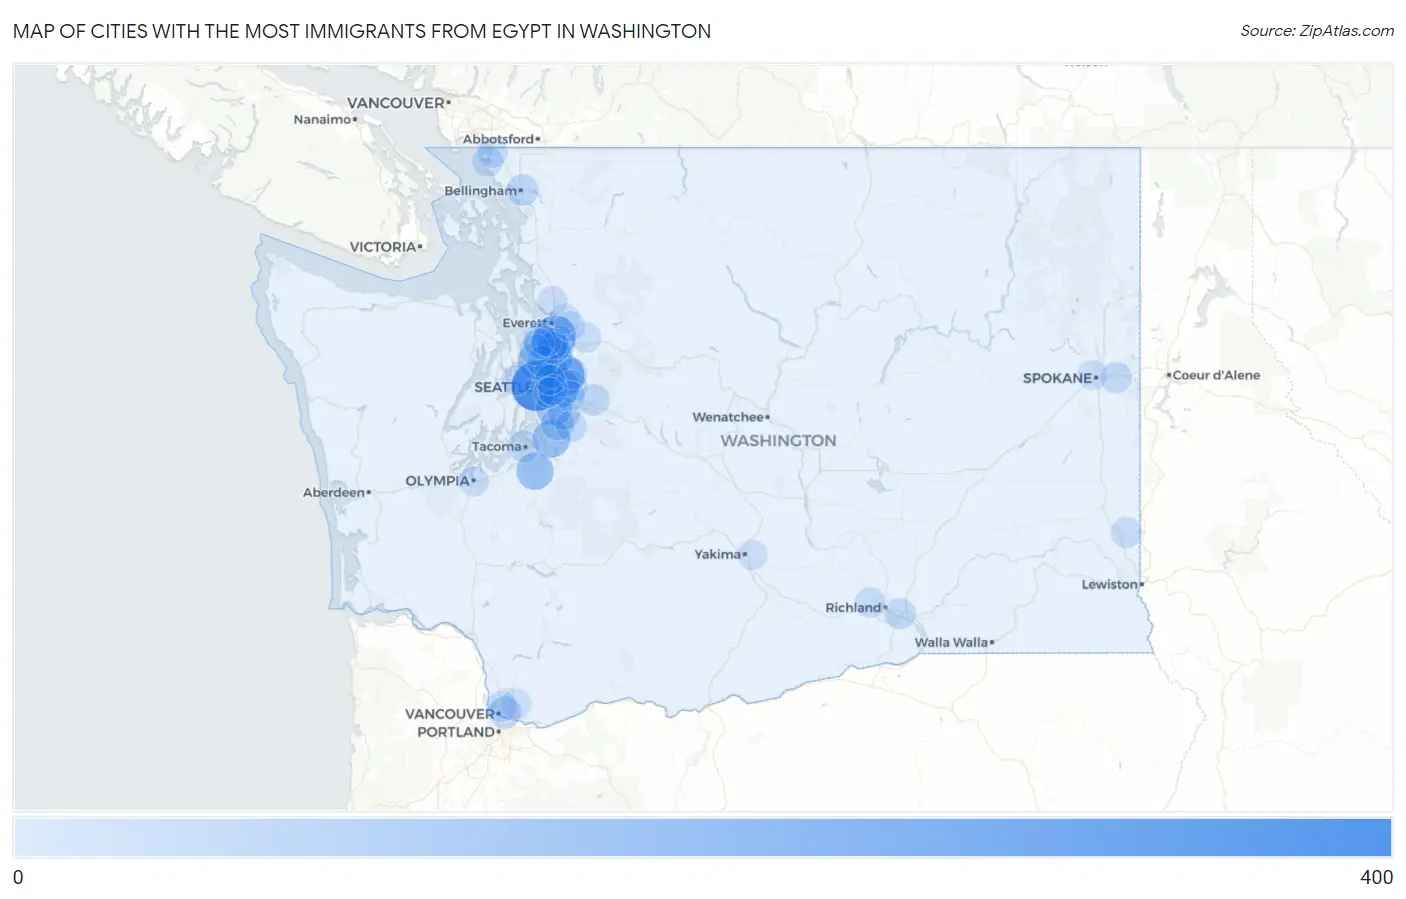
Map of Cities with the Most Immigrants from Egypt in Washington
0
400
Cities with the Most Immigrants from Egypt in Washington
| City | Egypt | vs State | vs National | |
| 1. | Seattle | 384 | 3,083(12.46%)#1 | 221,329(0.17%)#70 |
| 2. | Redmond | 225 | 3,083(7.30%)#2 | 221,329(0.10%)#142 |
| 3. | Eastmont | 225 | 3,083(7.30%)#3 | 221,329(0.10%)#144 |
| 4. | Bellevue | 213 | 3,083(6.91%)#4 | 221,329(0.10%)#153 |
| 5. | Bothell | 184 | 3,083(5.97%)#5 | 221,329(0.08%)#187 |
| 6. | Auburn | 145 | 3,083(4.70%)#6 | 221,329(0.07%)#263 |
| 7. | Shoreline | 137 | 3,083(4.44%)#7 | 221,329(0.06%)#280 |
| 8. | Frederickson | 137 | 3,083(4.44%)#8 | 221,329(0.06%)#281 |
| 9. | Renton | 117 | 3,083(3.80%)#9 | 221,329(0.05%)#330 |
| 10. | Martha Lake | 116 | 3,083(3.76%)#10 | 221,329(0.05%)#334 |
| 11. | Kirkland | 68 | 3,083(2.21%)#11 | 221,329(0.03%)#542 |
| 12. | Picnic Point | 68 | 3,083(2.21%)#12 | 221,329(0.03%)#549 |
| 13. | Kent | 60 | 3,083(1.95%)#13 | 221,329(0.03%)#603 |
| 14. | Silver Firs | 55 | 3,083(1.78%)#14 | 221,329(0.02%)#642 |
| 15. | Vancouver | 45 | 3,083(1.46%)#15 | 221,329(0.02%)#719 |
| 16. | Mill Creek East | 43 | 3,083(1.39%)#16 | 221,329(0.02%)#752 |
| 17. | Maple Heights Lake Desire | 42 | 3,083(1.36%)#17 | 221,329(0.02%)#775 |
| 18. | Sammamish | 40 | 3,083(1.30%)#18 | 221,329(0.02%)#792 |
| 19. | Tacoma | 34 | 3,083(1.10%)#19 | 221,329(0.02%)#883 |
| 20. | Bellingham | 32 | 3,083(1.04%)#20 | 221,329(0.01%)#920 |
| 21. | Snoqualmie | 31 | 3,083(1.01%)#21 | 221,329(0.01%)#942 |
| 22. | Mill Creek | 28 | 3,083(0.91%)#22 | 221,329(0.01%)#988 |
| 23. | Spokane Valley | 25 | 3,083(0.81%)#23 | 221,329(0.01%)#1,031 |
| 24. | Pasco | 23 | 3,083(0.75%)#24 | 221,329(0.01%)#1,070 |
| 25. | Maple Valley | 20 | 3,083(0.65%)#25 | 221,329(0.01%)#1,141 |
| 26. | Lake Forest Park | 19 | 3,083(0.62%)#26 | 221,329(0.01%)#1,180 |
| 27. | Edmonds | 17 | 3,083(0.55%)#27 | 221,329(0.01%)#1,229 |
| 28. | Hazel Dell | 17 | 3,083(0.55%)#28 | 221,329(0.01%)#1,234 |
| 29. | Pullman | 15 | 3,083(0.49%)#29 | 221,329(0.01%)#1,319 |
| 30. | Birch Bay | 13 | 3,083(0.42%)#30 | 221,329(0.01%)#1,403 |
| 31. | Blaine | 12 | 3,083(0.39%)#31 | 221,329(0.01%)#1,451 |
| 32. | Union Hill Novelty Hill | 11 | 3,083(0.36%)#32 | 221,329(0.00%)#1,472 |
| 33. | West Richland | 10 | 3,083(0.32%)#33 | 221,329(0.00%)#1,521 |
| 34. | Bainbridge Island | 9 | 3,083(0.29%)#34 | 221,329(0.00%)#1,570 |
| 35. | Meadowdale | 9 | 3,083(0.29%)#35 | 221,329(0.00%)#1,592 |
| 36. | Mercer Island | 8 | 3,083(0.26%)#36 | 221,329(0.00%)#1,618 |
| 37. | Woods Creek | 8 | 3,083(0.26%)#37 | 221,329(0.00%)#1,638 |
| 38. | Lake Stevens | 7 | 3,083(0.23%)#38 | 221,329(0.00%)#1,665 |
| 39. | Marysville | 6 | 3,083(0.19%)#39 | 221,329(0.00%)#1,713 |
| 40. | Olympia | 6 | 3,083(0.19%)#40 | 221,329(0.00%)#1,717 |
| 41. | Issaquah | 6 | 3,083(0.19%)#41 | 221,329(0.00%)#1,719 |
| 42. | Lake Stickney | 6 | 3,083(0.19%)#42 | 221,329(0.00%)#1,736 |
| 43. | Everett | 5 | 3,083(0.16%)#43 | 221,329(0.00%)#1,761 |
| 44. | Beaux Arts Village | 3 | 3,083(0.10%)#44 | 221,329(0.00%)#1,859 |
| 45. | Orchards | 2 | 3,083(0.06%)#45 | 221,329(0.00%)#1,863 |
| 46. | Yarrow Point | 2 | 3,083(0.06%)#46 | 221,329(0.00%)#1,880 |
| 47. | Spokane | 1 | 3,083(0.03%)#47 | 221,329(0.00%)#1,894 |
| 48. | Terrace Heights | 1 | 3,083(0.03%)#48 | 221,329(0.00%)#1,902 |
Common Questions
What are the Top 10 Cities with the Most Immigrants from Egypt in Washington?
Top 10 Cities with the Most Immigrants from Egypt in Washington are:
#1
384
#2
225
#3
225
#4
213
#5
184
#6
145
#7
137
#8
137
#9
117
#10
116
What city has the Most Immigrants from Egypt in Washington?
Seattle has the Most Immigrants from Egypt in Washington with 384.
What is the Total Immigrants from Egypt in the State of Washington?
Total Immigrants from Egypt in Washington is 3,083.
What is the Total Immigrants from Egypt in the United States?
Total Immigrants from Egypt in the United States is 221,329.