Cities with the Most Immigrants from Canada in Washington
RELATED REPORTS & OPTIONS
Canada
Washington
Compare Cities
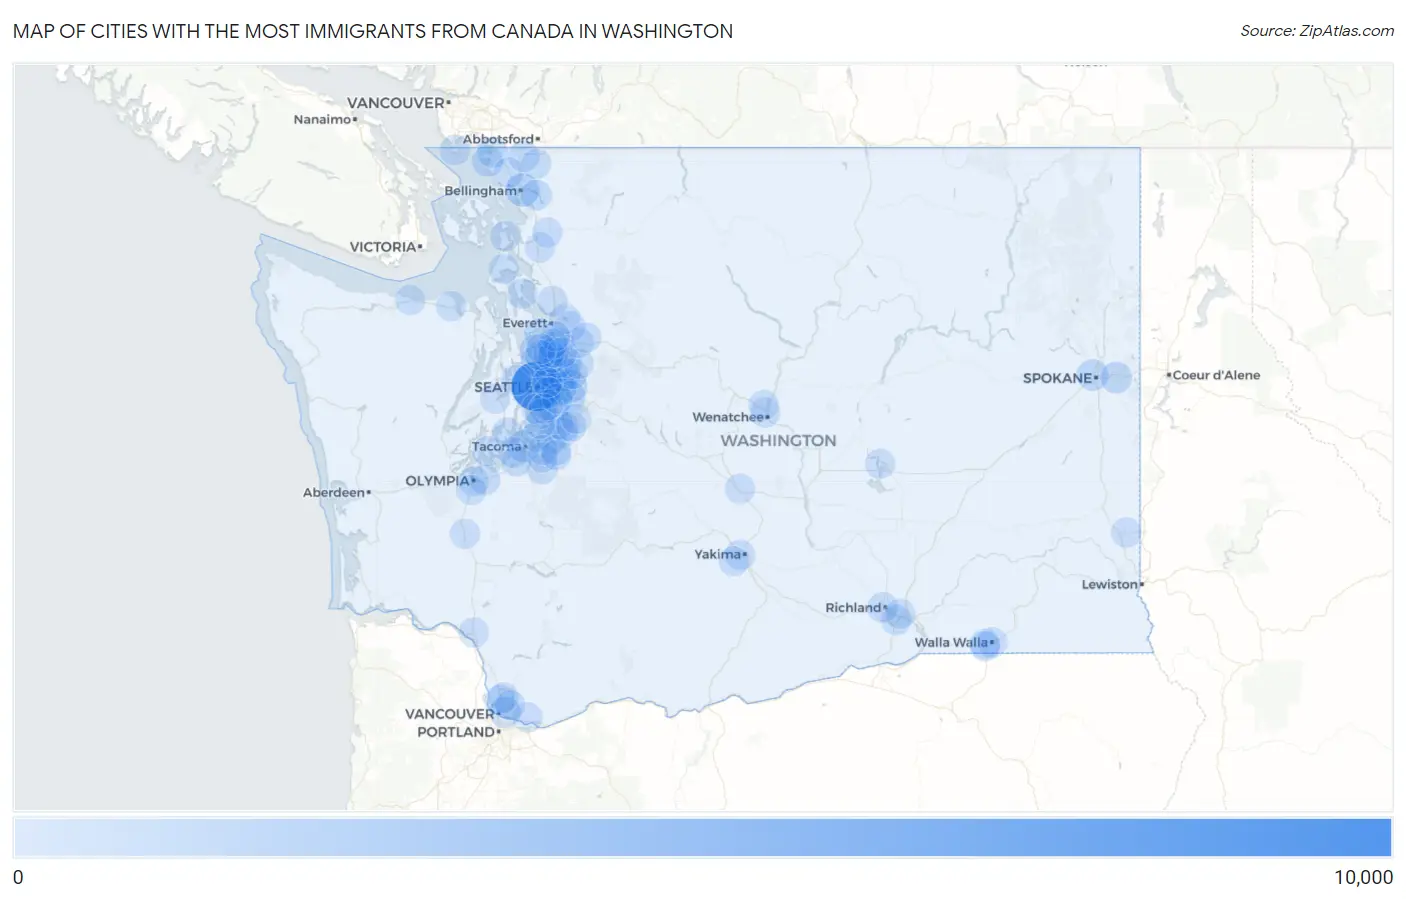
Map of Cities with the Most Immigrants from Canada in Washington
0
10,000
Cities with the Most Immigrants from Canada in Washington
| City | Canada | vs State | vs National | |
| 1. | Seattle | 8,050 | 47,238(17.04%)#1 | 821,792(0.98%)#3 |
| 2. | Bellevue | 1,968 | 47,238(4.17%)#2 | 821,792(0.24%)#21 |
| 3. | Bellingham | 1,324 | 47,238(2.80%)#3 | 821,792(0.16%)#40 |
| 4. | Kirkland | 1,191 | 47,238(2.52%)#4 | 821,792(0.14%)#51 |
| 5. | Redmond | 1,120 | 47,238(2.37%)#5 | 821,792(0.14%)#60 |
| 6. | Sammamish | 1,037 | 47,238(2.20%)#6 | 821,792(0.13%)#67 |
| 7. | Tacoma | 889 | 47,238(1.88%)#7 | 821,792(0.11%)#89 |
| 8. | Spokane | 722 | 47,238(1.53%)#8 | 821,792(0.09%)#129 |
| 9. | Spokane Valley | 666 | 47,238(1.41%)#9 | 821,792(0.08%)#144 |
| 10. | Shoreline | 603 | 47,238(1.28%)#10 | 821,792(0.07%)#164 |
| 11. | Birch Bay | 560 | 47,238(1.19%)#11 | 821,792(0.07%)#182 |
| 12. | Vancouver | 557 | 47,238(1.18%)#12 | 821,792(0.07%)#183 |
| 13. | Mukilteo | 519 | 47,238(1.10%)#13 | 821,792(0.06%)#203 |
| 14. | Lynden | 491 | 47,238(1.04%)#14 | 821,792(0.06%)#216 |
| 15. | Renton | 471 | 47,238(1.00%)#15 | 821,792(0.06%)#235 |
| 16. | Edmonds | 456 | 47,238(0.97%)#16 | 821,792(0.06%)#242 |
| 17. | Blaine | 430 | 47,238(0.91%)#17 | 821,792(0.05%)#266 |
| 18. | Issaquah | 424 | 47,238(0.90%)#18 | 821,792(0.05%)#270 |
| 19. | Cottage Lake | 371 | 47,238(0.79%)#19 | 821,792(0.05%)#312 |
| 20. | Kent | 361 | 47,238(0.76%)#20 | 821,792(0.04%)#328 |
| 21. | Mill Creek East | 358 | 47,238(0.76%)#21 | 821,792(0.04%)#334 |
| 22. | Sudden Valley | 355 | 47,238(0.75%)#22 | 821,792(0.04%)#335 |
| 23. | Federal Way | 354 | 47,238(0.75%)#23 | 821,792(0.04%)#336 |
| 24. | Mercer Island | 352 | 47,238(0.75%)#24 | 821,792(0.04%)#340 |
| 25. | South Hill | 318 | 47,238(0.67%)#25 | 821,792(0.04%)#380 |
| 26. | Point Roberts | 303 | 47,238(0.64%)#26 | 821,792(0.04%)#404 |
| 27. | Kennewick | 301 | 47,238(0.64%)#27 | 821,792(0.04%)#408 |
| 28. | Kenmore | 297 | 47,238(0.63%)#28 | 821,792(0.04%)#417 |
| 29. | Everett | 293 | 47,238(0.62%)#29 | 821,792(0.04%)#425 |
| 30. | Bothell West | 291 | 47,238(0.62%)#30 | 821,792(0.04%)#430 |
| 31. | Silver Firs | 279 | 47,238(0.59%)#31 | 821,792(0.03%)#443 |
| 32. | Richland | 277 | 47,238(0.59%)#32 | 821,792(0.03%)#445 |
| 33. | Bainbridge Island | 260 | 47,238(0.55%)#33 | 821,792(0.03%)#485 |
| 34. | Woodinville | 255 | 47,238(0.54%)#34 | 821,792(0.03%)#494 |
| 35. | University Place | 253 | 47,238(0.54%)#35 | 821,792(0.03%)#500 |
| 36. | Marysville | 247 | 47,238(0.52%)#36 | 821,792(0.03%)#515 |
| 37. | Auburn | 243 | 47,238(0.51%)#37 | 821,792(0.03%)#524 |
| 38. | Lacey | 240 | 47,238(0.51%)#38 | 821,792(0.03%)#534 |
| 39. | Union Hill Novelty Hill | 222 | 47,238(0.47%)#39 | 821,792(0.03%)#590 |
| 40. | Lakewood | 205 | 47,238(0.43%)#40 | 821,792(0.02%)#639 |
| 41. | Yakima | 203 | 47,238(0.43%)#41 | 821,792(0.02%)#644 |
| 42. | Anacortes | 179 | 47,238(0.38%)#42 | 821,792(0.02%)#725 |
| 43. | Bothell | 178 | 47,238(0.38%)#43 | 821,792(0.02%)#730 |
| 44. | Monroe | 177 | 47,238(0.37%)#44 | 821,792(0.02%)#733 |
| 45. | Salmon Creek | 175 | 47,238(0.37%)#45 | 821,792(0.02%)#740 |
| 46. | Bothell East | 173 | 47,238(0.37%)#46 | 821,792(0.02%)#745 |
| 47. | Port Angeles | 169 | 47,238(0.36%)#47 | 821,792(0.02%)#759 |
| 48. | Camano | 168 | 47,238(0.36%)#48 | 821,792(0.02%)#766 |
| 49. | Camas | 157 | 47,238(0.33%)#49 | 821,792(0.02%)#816 |
| 50. | Lake Morton Berrydale | 155 | 47,238(0.33%)#50 | 821,792(0.02%)#836 |
| 51. | Ferndale | 153 | 47,238(0.32%)#51 | 821,792(0.02%)#850 |
| 52. | Lake Stevens | 151 | 47,238(0.32%)#52 | 821,792(0.02%)#856 |
| 53. | Lake Tapps | 150 | 47,238(0.32%)#53 | 821,792(0.02%)#866 |
| 54. | Pullman | 143 | 47,238(0.30%)#54 | 821,792(0.02%)#907 |
| 55. | Wenatchee | 142 | 47,238(0.30%)#55 | 821,792(0.02%)#917 |
| 56. | Fairwood Cdp King County | 137 | 47,238(0.29%)#56 | 821,792(0.02%)#944 |
| 57. | Olympia | 135 | 47,238(0.29%)#57 | 821,792(0.02%)#957 |
| 58. | Mount Vernon | 134 | 47,238(0.28%)#58 | 821,792(0.02%)#967 |
| 59. | Covington | 133 | 47,238(0.28%)#59 | 821,792(0.02%)#969 |
| 60. | Garrett | 133 | 47,238(0.28%)#60 | 821,792(0.02%)#971 |
| 61. | Pasco | 132 | 47,238(0.28%)#61 | 821,792(0.02%)#974 |
| 62. | Cascade Valley | 130 | 47,238(0.28%)#62 | 821,792(0.02%)#990 |
| 63. | Mill Creek | 128 | 47,238(0.27%)#63 | 821,792(0.02%)#1,007 |
| 64. | Maple Valley | 126 | 47,238(0.27%)#64 | 821,792(0.02%)#1,018 |
| 65. | Puyallup | 124 | 47,238(0.26%)#65 | 821,792(0.02%)#1,033 |
| 66. | Seatac | 123 | 47,238(0.26%)#66 | 821,792(0.01%)#1,041 |
| 67. | Oak Harbor | 122 | 47,238(0.26%)#67 | 821,792(0.01%)#1,048 |
| 68. | Bremerton | 120 | 47,238(0.25%)#68 | 821,792(0.01%)#1,062 |
| 69. | Burien | 117 | 47,238(0.25%)#69 | 821,792(0.01%)#1,093 |
| 70. | Bryn Mawr Skyway | 115 | 47,238(0.24%)#70 | 821,792(0.01%)#1,120 |
| 71. | Tumwater | 114 | 47,238(0.24%)#71 | 821,792(0.01%)#1,127 |
| 72. | Edgewood | 114 | 47,238(0.24%)#72 | 821,792(0.01%)#1,131 |
| 73. | Duvall | 112 | 47,238(0.24%)#73 | 821,792(0.01%)#1,148 |
| 74. | Fairwood Cdp Spokane County | 110 | 47,238(0.23%)#74 | 821,792(0.01%)#1,162 |
| 75. | Longbranch | 110 | 47,238(0.23%)#75 | 821,792(0.01%)#1,163 |
| 76. | Bonney Lake | 107 | 47,238(0.23%)#76 | 821,792(0.01%)#1,192 |
| 77. | Maltby | 107 | 47,238(0.23%)#77 | 821,792(0.01%)#1,197 |
| 78. | Woods Creek | 107 | 47,238(0.23%)#78 | 821,792(0.01%)#1,201 |
| 79. | Sunnyslope | 106 | 47,238(0.22%)#79 | 821,792(0.01%)#1,210 |
| 80. | Ellensburg | 102 | 47,238(0.22%)#80 | 821,792(0.01%)#1,247 |
| 81. | Mount Vista | 102 | 47,238(0.22%)#81 | 821,792(0.01%)#1,248 |
| 82. | Five Corners | 101 | 47,238(0.21%)#82 | 821,792(0.01%)#1,257 |
| 83. | Newcastle | 99 | 47,238(0.21%)#83 | 821,792(0.01%)#1,287 |
| 84. | Gig Harbor | 98 | 47,238(0.21%)#84 | 821,792(0.01%)#1,298 |
| 85. | Sedro Woolley | 94 | 47,238(0.20%)#85 | 821,792(0.01%)#1,332 |
| 86. | Tukwila | 92 | 47,238(0.19%)#86 | 821,792(0.01%)#1,356 |
| 87. | Des Moines | 91 | 47,238(0.19%)#87 | 821,792(0.01%)#1,369 |
| 88. | Eastmont | 88 | 47,238(0.19%)#88 | 821,792(0.01%)#1,409 |
| 89. | Mountlake Terrace | 88 | 47,238(0.19%)#89 | 821,792(0.01%)#1,410 |
| 90. | Sequim | 87 | 47,238(0.18%)#90 | 821,792(0.01%)#1,426 |
| 91. | Walla Walla | 86 | 47,238(0.18%)#91 | 821,792(0.01%)#1,434 |
| 92. | Hobart | 86 | 47,238(0.18%)#92 | 821,792(0.01%)#1,439 |
| 93. | Kelso | 83 | 47,238(0.18%)#93 | 821,792(0.01%)#1,482 |
| 94. | Medina | 83 | 47,238(0.18%)#94 | 821,792(0.01%)#1,487 |
| 95. | Everson | 82 | 47,238(0.17%)#95 | 821,792(0.01%)#1,499 |
| 96. | College Place | 81 | 47,238(0.17%)#96 | 821,792(0.01%)#1,514 |
| 97. | Ahtanum | 81 | 47,238(0.17%)#97 | 821,792(0.01%)#1,519 |
| 98. | Centralia | 79 | 47,238(0.17%)#98 | 821,792(0.01%)#1,548 |
| 99. | Lynnwood | 76 | 47,238(0.16%)#99 | 821,792(0.01%)#1,596 |
| 100. | Tehaleh | 76 | 47,238(0.16%)#100 | 821,792(0.01%)#1,606 |
Common Questions
What are the Top 10 Cities with the Most Immigrants from Canada in Washington?
Top 10 Cities with the Most Immigrants from Canada in Washington are:
#1
8,050
#2
1,968
#3
1,324
#4
1,191
#5
1,120
#6
1,037
#7
889
#8
722
#9
666
#10
603
What city has the Most Immigrants from Canada in Washington?
Seattle has the Most Immigrants from Canada in Washington with 8,050.
What is the Total Immigrants from Canada in the State of Washington?
Total Immigrants from Canada in Washington is 47,238.
What is the Total Immigrants from Canada in the United States?
Total Immigrants from Canada in the United States is 821,792.