Cities with the Most Immigrants from Dominican Republic in Washington
RELATED REPORTS & OPTIONS
Dominican Republic
Washington
Compare Cities
Map of Cities with the Most Immigrants from Dominican Republic in Washington
0
200
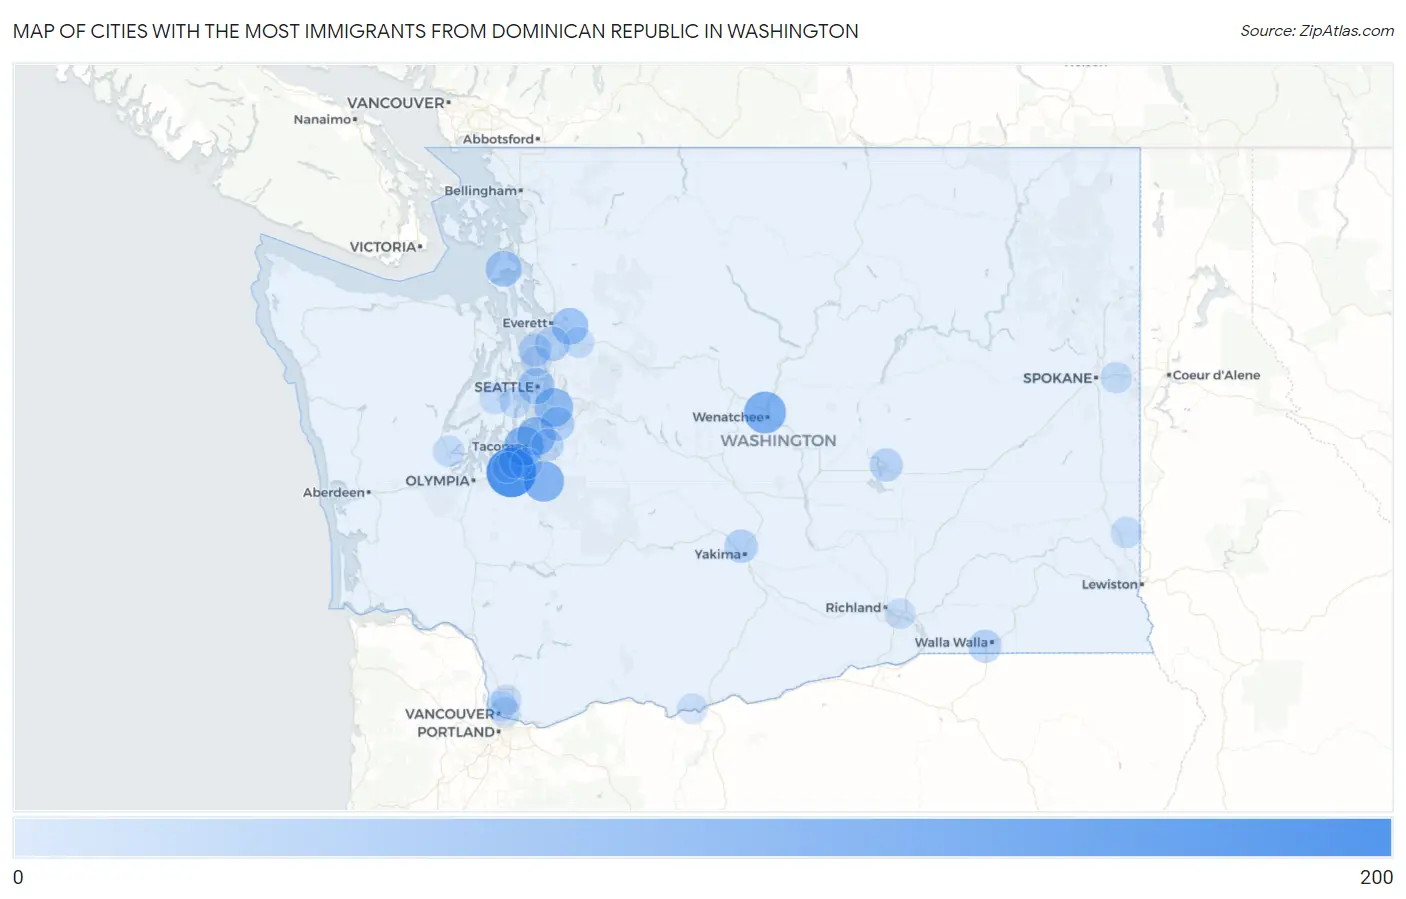
Cities with the Most Immigrants from Dominican Republic in Washington
| City | Dominican Republic | vs State | vs National | |
| 1. | Fort Lewis | 172 | 1,313(13.10%)#1 | 1,223,316(0.01%)#516 |
| 2. | Wenatchee | 104 | 1,313(7.92%)#2 | 1,223,316(0.01%)#714 |
| 3. | Graham | 93 | 1,313(7.08%)#3 | 1,223,316(0.01%)#777 |
| 4. | Tacoma | 83 | 1,313(6.32%)#4 | 1,223,316(0.01%)#843 |
| 5. | Renton | 77 | 1,313(5.86%)#5 | 1,223,316(0.01%)#891 |
| 6. | Federal Way | 73 | 1,313(5.56%)#6 | 1,223,316(0.01%)#931 |
| 7. | Everett | 56 | 1,313(4.27%)#7 | 1,223,316(0.00%)#1,086 |
| 8. | Seattle | 53 | 1,313(4.04%)#8 | 1,223,316(0.00%)#1,108 |
| 9. | Oak Harbor | 51 | 1,313(3.88%)#9 | 1,223,316(0.00%)#1,138 |
| 10. | Mill Creek | 38 | 1,313(2.89%)#10 | 1,223,316(0.00%)#1,325 |
| 11. | Lakewood | 36 | 1,313(2.74%)#11 | 1,223,316(0.00%)#1,359 |
| 12. | Kent | 32 | 1,313(2.44%)#12 | 1,223,316(0.00%)#1,447 |
| 13. | Selah | 30 | 1,313(2.28%)#13 | 1,223,316(0.00%)#1,494 |
| 14. | Moses Lake | 26 | 1,313(1.98%)#14 | 1,223,316(0.00%)#1,599 |
| 15. | College Place | 26 | 1,313(1.98%)#15 | 1,223,316(0.00%)#1,611 |
| 16. | Edmonds | 25 | 1,313(1.90%)#16 | 1,223,316(0.00%)#1,627 |
| 17. | Pacific | 20 | 1,313(1.52%)#17 | 1,223,316(0.00%)#1,797 |
| 18. | Parkland | 14 | 1,313(1.07%)#18 | 1,223,316(0.00%)#2,029 |
| 19. | Spokane Valley | 12 | 1,313(0.91%)#19 | 1,223,316(0.00%)#2,108 |
| 20. | Shelton | 12 | 1,313(0.91%)#20 | 1,223,316(0.00%)#2,127 |
| 21. | Pullman | 11 | 1,313(0.84%)#21 | 1,223,316(0.00%)#2,162 |
| 22. | Monroe | 10 | 1,313(0.76%)#22 | 1,223,316(0.00%)#2,223 |
| 23. | Bremerton | 9 | 1,313(0.69%)#23 | 1,223,316(0.00%)#2,265 |
| 24. | Vancouver | 8 | 1,313(0.61%)#24 | 1,223,316(0.00%)#2,323 |
| 25. | Southworth | 8 | 1,313(0.61%)#25 | 1,223,316(0.00%)#2,360 |
| 26. | Hazel Dell | 7 | 1,313(0.53%)#26 | 1,223,316(0.00%)#2,380 |
| 27. | North Fort Lewis | 7 | 1,313(0.53%)#27 | 1,223,316(0.00%)#2,404 |
| 28. | Pasco | 5 | 1,313(0.38%)#28 | 1,223,316(0.00%)#2,495 |
| 29. | Barberton | 5 | 1,313(0.38%)#29 | 1,223,316(0.00%)#2,523 |
| 30. | Wishram | 5 | 1,313(0.38%)#30 | 1,223,316(0.00%)#2,558 |
| 31. | Shoreline | 4 | 1,313(0.30%)#31 | 1,223,316(0.00%)#2,566 |
Common Questions
What are the Top 10 Cities with the Most Immigrants from Dominican Republic in Washington?
Top 10 Cities with the Most Immigrants from Dominican Republic in Washington are:
#1
172
#2
104
#3
93
#4
83
#5
77
#6
73
#7
56
#8
53
#9
51
#10
38
What city has the Most Immigrants from Dominican Republic in Washington?
Fort Lewis has the Most Immigrants from Dominican Republic in Washington with 172.
What is the Total Immigrants from Dominican Republic in the State of Washington?
Total Immigrants from Dominican Republic in Washington is 1,313.
What is the Total Immigrants from Dominican Republic in the United States?
Total Immigrants from Dominican Republic in the United States is 1,223,316.