Cities with the Highest Percentage of Iranian Population in Washington
RELATED REPORTS & OPTIONS
Iranian
Washington
Compare Cities
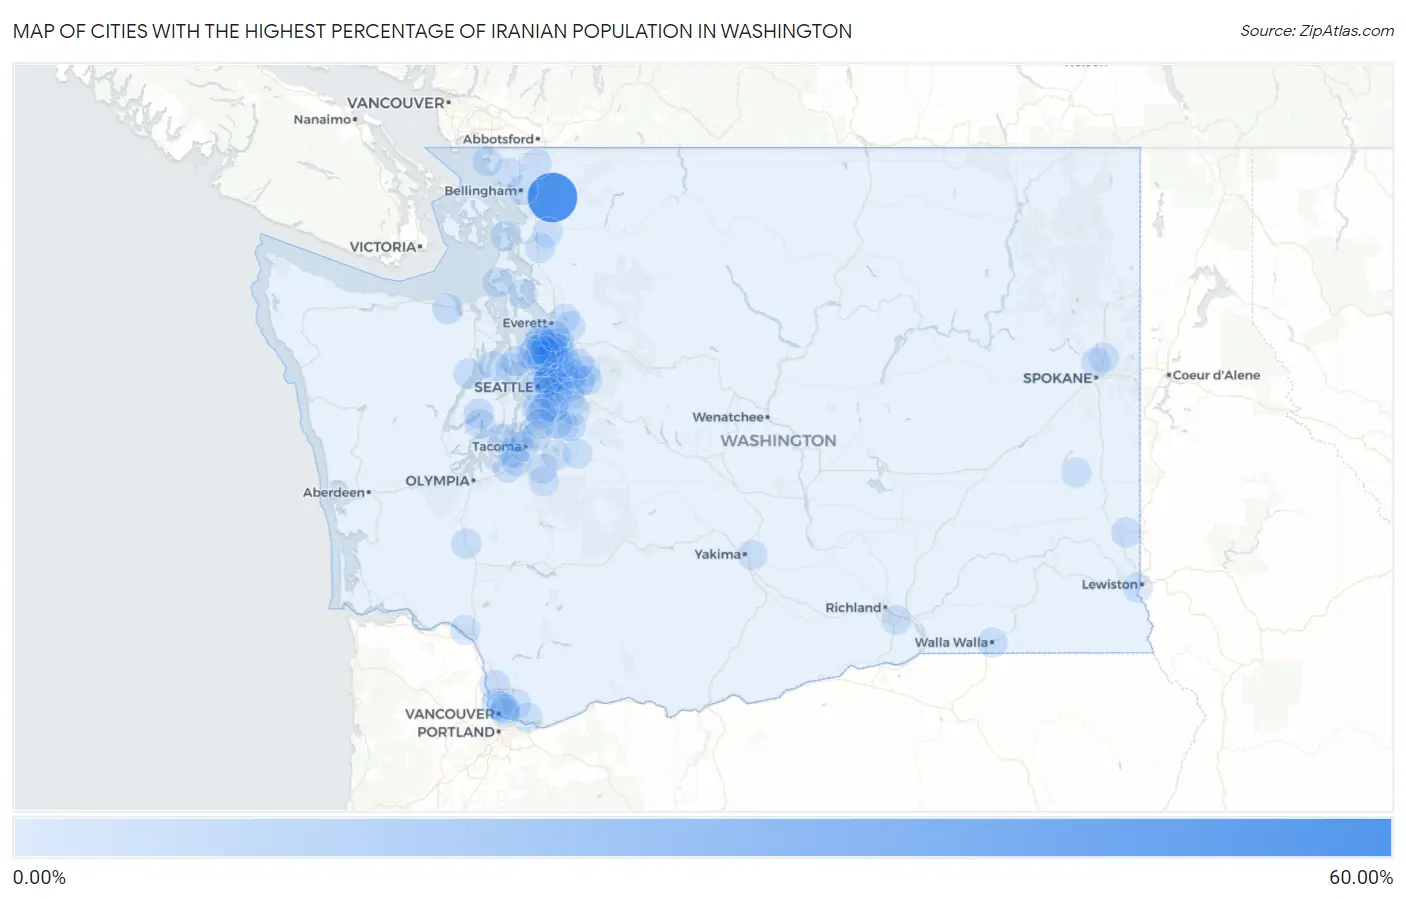
Map of Cities with the Highest Percentage of Iranian Population in Washington
0.00%
60.00%
Cities with the Highest Percentage of Iranian Population in Washington
| City | Iranian | vs State | vs National | |
| 1. | Acme | 52.21% | 0.20%(+52.0)#1 | 0.15%(+52.1)#1 |
| 2. | Clyde Hill | 5.41% | 0.20%(+5.21)#2 | 0.15%(+5.26)#28 |
| 3. | Ames Lake | 4.60% | 0.20%(+4.41)#3 | 0.15%(+4.46)#40 |
| 4. | Yarrow Point | 2.73% | 0.20%(+2.54)#4 | 0.15%(+2.59)#91 |
| 5. | River Road | 1.75% | 0.20%(+1.55)#5 | 0.15%(+1.60)#171 |
| 6. | Kirkland | 1.53% | 0.20%(+1.34)#6 | 0.15%(+1.39)#222 |
| 7. | Brinnon | 1.49% | 0.20%(+1.29)#7 | 0.15%(+1.34)#231 |
| 8. | Woodinville | 1.20% | 0.20%(+1.01)#8 | 0.15%(+1.06)#307 |
| 9. | Kenmore | 1.15% | 0.20%(+0.957)#9 | 0.15%(+1.00)#338 |
| 10. | Lake Marcel Stillwater | 1.15% | 0.20%(+0.951)#10 | 0.15%(+0.999)#342 |
| 11. | Bothell | 1.06% | 0.20%(+0.865)#11 | 0.15%(+0.913)#371 |
| 12. | Maltby | 0.94% | 0.20%(+0.748)#12 | 0.15%(+0.796)#413 |
| 13. | Belfair | 0.91% | 0.20%(+0.715)#13 | 0.15%(+0.763)#425 |
| 14. | Lake Shore | 0.90% | 0.20%(+0.700)#14 | 0.15%(+0.749)#432 |
| 15. | Coupeville | 0.88% | 0.20%(+0.687)#15 | 0.15%(+0.735)#437 |
| 16. | Sammamish | 0.84% | 0.20%(+0.647)#16 | 0.15%(+0.695)#455 |
| 17. | University Place | 0.76% | 0.20%(+0.566)#17 | 0.15%(+0.614)#493 |
| 18. | Ridgefield | 0.66% | 0.20%(+0.466)#18 | 0.15%(+0.515)#575 |
| 19. | Hunts Point | 0.62% | 0.20%(+0.424)#19 | 0.15%(+0.472)#616 |
| 20. | Silver Firs | 0.61% | 0.20%(+0.412)#20 | 0.15%(+0.460)#632 |
| 21. | Martha Lake | 0.60% | 0.20%(+0.407)#21 | 0.15%(+0.455)#639 |
| 22. | Covington | 0.59% | 0.20%(+0.396)#22 | 0.15%(+0.444)#648 |
| 23. | Bellevue | 0.58% | 0.20%(+0.387)#23 | 0.15%(+0.435)#661 |
| 24. | Mukilteo | 0.57% | 0.20%(+0.376)#24 | 0.15%(+0.424)#675 |
| 25. | Redmond | 0.55% | 0.20%(+0.354)#25 | 0.15%(+0.402)#698 |
| 26. | Seattle | 0.55% | 0.20%(+0.351)#26 | 0.15%(+0.399)#702 |
| 27. | Bothell West | 0.53% | 0.20%(+0.336)#27 | 0.15%(+0.384)#722 |
| 28. | Mercer Island | 0.53% | 0.20%(+0.335)#28 | 0.15%(+0.383)#724 |
| 29. | Bangor Base | 0.53% | 0.20%(+0.334)#29 | 0.15%(+0.382)#725 |
| 30. | Chehalis | 0.51% | 0.20%(+0.311)#30 | 0.15%(+0.359)#755 |
| 31. | Pullman | 0.50% | 0.20%(+0.302)#31 | 0.15%(+0.350)#762 |
| 32. | North Lynnwood | 0.49% | 0.20%(+0.292)#32 | 0.15%(+0.340)#779 |
| 33. | Ferndale | 0.45% | 0.20%(+0.254)#33 | 0.15%(+0.302)#832 |
| 34. | Medina | 0.44% | 0.20%(+0.249)#34 | 0.15%(+0.298)#839 |
| 35. | Bryn Mawr Skyway | 0.43% | 0.20%(+0.232)#35 | 0.15%(+0.280)#861 |
| 36. | Bothell East | 0.41% | 0.20%(+0.213)#36 | 0.15%(+0.262)#887 |
| 37. | Everson | 0.41% | 0.20%(+0.210)#37 | 0.15%(+0.258)#891 |
| 38. | Ruston | 0.39% | 0.20%(+0.198)#38 | 0.15%(+0.247)#912 |
| 39. | Artondale | 0.38% | 0.20%(+0.187)#39 | 0.15%(+0.235)#935 |
| 40. | Lake Stickney | 0.37% | 0.20%(+0.173)#40 | 0.15%(+0.221)#968 |
| 41. | Union Hill Novelty Hill | 0.37% | 0.20%(+0.172)#41 | 0.15%(+0.220)#972 |
| 42. | North Fort Lewis | 0.35% | 0.20%(+0.153)#42 | 0.15%(+0.202)#1,018 |
| 43. | Mill Creek East | 0.33% | 0.20%(+0.137)#43 | 0.15%(+0.185)#1,058 |
| 44. | St John | 0.33% | 0.20%(+0.132)#44 | 0.15%(+0.180)#1,072 |
| 45. | Kennewick | 0.32% | 0.20%(+0.124)#45 | 0.15%(+0.173)#1,094 |
| 46. | Clearview | 0.32% | 0.20%(+0.124)#46 | 0.15%(+0.172)#1,096 |
| 47. | Mill Creek | 0.31% | 0.20%(+0.112)#47 | 0.15%(+0.161)#1,128 |
| 48. | Terrace Heights | 0.30% | 0.20%(+0.101)#48 | 0.15%(+0.149)#1,164 |
| 49. | Shoreline | 0.28% | 0.20%(+0.083)#49 | 0.15%(+0.131)#1,210 |
| 50. | Tehaleh | 0.27% | 0.20%(+0.078)#50 | 0.15%(+0.127)#1,220 |
| 51. | Cottage Lake | 0.27% | 0.20%(+0.076)#51 | 0.15%(+0.124)#1,232 |
| 52. | Newcastle | 0.27% | 0.20%(+0.075)#52 | 0.15%(+0.124)#1,234 |
| 53. | Woodway | 0.27% | 0.20%(+0.073)#53 | 0.15%(+0.121)#1,243 |
| 54. | Mountlake Terrace | 0.26% | 0.20%(+0.067)#54 | 0.15%(+0.115)#1,259 |
| 55. | Everett | 0.26% | 0.20%(+0.065)#55 | 0.15%(+0.114)#1,264 |
| 56. | Issaquah | 0.26% | 0.20%(+0.064)#56 | 0.15%(+0.112)#1,272 |
| 57. | Lynnwood | 0.26% | 0.20%(+0.063)#57 | 0.15%(+0.111)#1,273 |
| 58. | Mirrormont | 0.24% | 0.20%(+0.048)#58 | 0.15%(+0.097)#1,330 |
| 59. | Picnic Point | 0.24% | 0.20%(+0.046)#59 | 0.15%(+0.094)#1,340 |
| 60. | Lake Forest Park | 0.24% | 0.20%(+0.042)#60 | 0.15%(+0.091)#1,349 |
| 61. | Suquamish | 0.23% | 0.20%(+0.036)#61 | 0.15%(+0.084)#1,375 |
| 62. | Burien | 0.23% | 0.20%(+0.030)#62 | 0.15%(+0.078)#1,391 |
| 63. | Maple Valley | 0.22% | 0.20%(+0.027)#63 | 0.15%(+0.075)#1,402 |
| 64. | Hazel Dell | 0.22% | 0.20%(+0.020)#64 | 0.15%(+0.069)#1,430 |
| 65. | Bellingham | 0.20% | 0.20%(+0.004)#65 | 0.15%(+0.052)#1,492 |
| 66. | Graham | 0.20% | 0.20%(+0.003)#66 | 0.15%(+0.051)#1,494 |
| 67. | Sedro Woolley | 0.18% | 0.20%(-0.011)#67 | 0.15%(+0.037)#1,543 |
| 68. | Kent | 0.18% | 0.20%(-0.013)#68 | 0.15%(+0.035)#1,551 |
| 69. | Alderwood Manor | 0.17% | 0.20%(-0.024)#69 | 0.15%(+0.024)#1,612 |
| 70. | Orchards | 0.16% | 0.20%(-0.031)#70 | 0.15%(+0.017)#1,648 |
| 71. | Tacoma | 0.16% | 0.20%(-0.037)#71 | 0.15%(+0.011)#1,674 |
| 72. | Mead | 0.15% | 0.20%(-0.042)#72 | 0.15%(+0.006)#1,703 |
| 73. | Renton | 0.15% | 0.20%(-0.042)#73 | 0.15%(+0.006)#1,710 |
| 74. | Edmonds | 0.15% | 0.20%(-0.043)#74 | 0.15%(+0.005)#1,714 |
| 75. | Eastmont | 0.14% | 0.20%(-0.053)#75 | 0.15%(-0.005)#1,775 |
| 76. | Anacortes | 0.14% | 0.20%(-0.054)#76 | 0.15%(-0.006)#1,776 |
| 77. | Indianola | 0.14% | 0.20%(-0.055)#77 | 0.15%(-0.006)#1,782 |
| 78. | Vancouver | 0.14% | 0.20%(-0.060)#78 | 0.15%(-0.012)#1,818 |
| 79. | Allyn | 0.13% | 0.20%(-0.062)#79 | 0.15%(-0.014)#1,825 |
| 80. | Tukwila | 0.12% | 0.20%(-0.075)#80 | 0.15%(-0.027)#1,901 |
| 81. | Carnation | 0.12% | 0.20%(-0.076)#81 | 0.15%(-0.028)#1,911 |
| 82. | West Clarkston Highland | 0.12% | 0.20%(-0.080)#82 | 0.15%(-0.032)#1,943 |
| 83. | Duvall | 0.11% | 0.20%(-0.085)#83 | 0.15%(-0.036)#1,966 |
| 84. | South Hill | 0.11% | 0.20%(-0.089)#84 | 0.15%(-0.041)#2,003 |
| 85. | Lake Stevens | 0.10% | 0.20%(-0.092)#85 | 0.15%(-0.044)#2,025 |
| 86. | Country Homes | 0.096% | 0.20%(-0.099)#86 | 0.15%(-0.051)#2,081 |
| 87. | Minnehaha | 0.095% | 0.20%(-0.100)#87 | 0.15%(-0.052)#2,088 |
| 88. | Camas | 0.091% | 0.20%(-0.104)#88 | 0.15%(-0.056)#2,126 |
| 89. | Birch Bay | 0.090% | 0.20%(-0.106)#89 | 0.15%(-0.057)#2,130 |
| 90. | Bonney Lake | 0.089% | 0.20%(-0.107)#90 | 0.15%(-0.059)#2,137 |
| 91. | Seatac | 0.087% | 0.20%(-0.108)#91 | 0.15%(-0.060)#2,144 |
| 92. | Federal Way | 0.074% | 0.20%(-0.121)#92 | 0.15%(-0.073)#2,256 |
| 93. | Enumclaw | 0.071% | 0.20%(-0.124)#93 | 0.15%(-0.076)#2,296 |
| 94. | Longview | 0.066% | 0.20%(-0.129)#94 | 0.15%(-0.081)#2,344 |
| 95. | Fairwood Cdp King County | 0.064% | 0.20%(-0.131)#95 | 0.15%(-0.083)#2,358 |
| 96. | Camano | 0.051% | 0.20%(-0.144)#96 | 0.15%(-0.096)#2,474 |
| 97. | Mount Vernon | 0.048% | 0.20%(-0.147)#97 | 0.15%(-0.099)#2,501 |
| 98. | Des Moines | 0.046% | 0.20%(-0.149)#98 | 0.15%(-0.101)#2,530 |
| 99. | Walla Walla | 0.044% | 0.20%(-0.151)#99 | 0.15%(-0.103)#2,551 |
| 100. | Lakewood | 0.043% | 0.20%(-0.153)#100 | 0.15%(-0.104)#2,570 |
Common Questions
What are the Top 10 Cities with the Highest Percentage of Iranian Population in Washington?
Top 10 Cities with the Highest Percentage of Iranian Population in Washington are:
#1
52.21%
#2
5.41%
#3
4.60%
#4
2.73%
#5
1.75%
#6
1.53%
#7
1.49%
#8
1.20%
#9
1.15%
#10
1.15%
What city has the Highest Percentage of Iranian Population in Washington?
Acme has the Highest Percentage of Iranian Population in Washington with 52.21%.
What is the Percentage of Iranian Population in the State of Washington?
Percentage of Iranian Population in Washington is 0.20%.
What is the Percentage of Iranian Population in the United States?
Percentage of Iranian Population in the United States is 0.15%.