Cities with the Highest Percentage of Population Employed in Construction & Extraction in Washington
RELATED REPORTS & OPTIONS
Construction & Extraction
Washington
Compare Cities
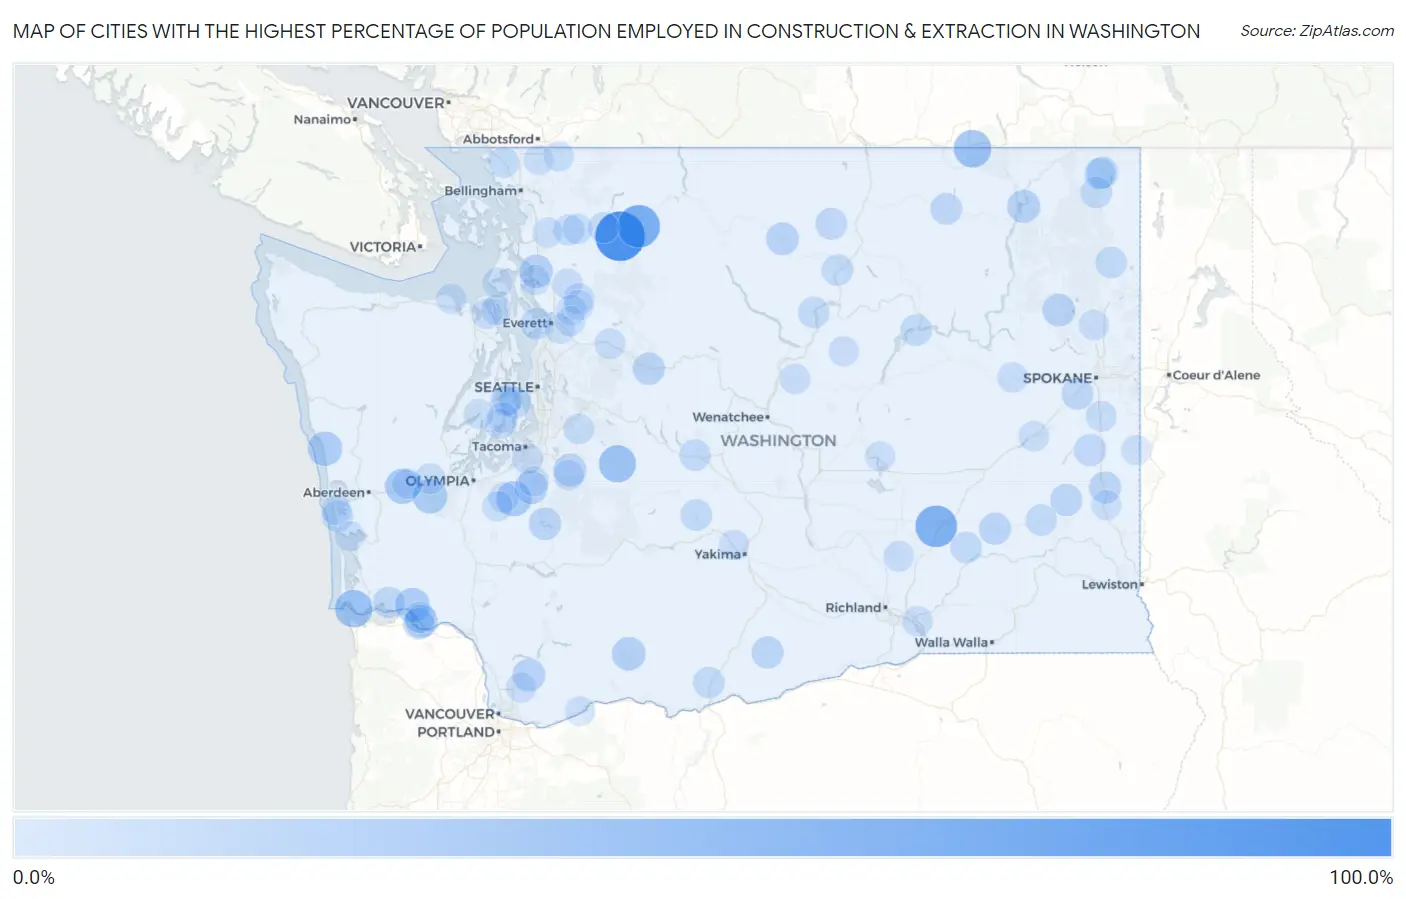
Map of Cities with the Highest Percentage of Population Employed in Construction & Extraction in Washington
0.0%
100.0%
Cities with the Highest Percentage of Population Employed in Construction & Extraction in Washington
| City | % Employed | vs State | vs National | |
| 1. | Rockport | 100.0% | 4.9%(+95.1)#1 | 5.0%(+95.0)#18 |
| 2. | Cougar | 100.0% | 4.9%(+95.1)#2 | 5.0%(+95.0)#25 |
| 3. | Marblemount | 66.7% | 4.9%(+61.7)#3 | 5.0%(+61.7)#72 |
| 4. | Hatton | 62.1% | 4.9%(+57.2)#4 | 5.0%(+57.1)#86 |
| 5. | Danville | 43.5% | 4.9%(+38.6)#5 | 5.0%(+38.5)#233 |
| 6. | Chinook | 43.0% | 4.9%(+38.1)#6 | 5.0%(+38.0)#241 |
| 7. | Greenwater | 41.4% | 4.9%(+36.5)#7 | 5.0%(+36.4)#260 |
| 8. | Mckenna | 32.5% | 4.9%(+27.6)#8 | 5.0%(+27.5)#453 |
| 9. | Brady | 32.3% | 4.9%(+27.4)#9 | 5.0%(+27.3)#462 |
| 10. | Porter | 30.0% | 4.9%(+25.1)#10 | 5.0%(+25.0)#548 |
| 11. | Moclips | 29.5% | 4.9%(+24.6)#11 | 5.0%(+24.5)#566 |
| 12. | Skamokawa Valley | 29.4% | 4.9%(+24.5)#12 | 5.0%(+24.4)#569 |
| 13. | Trout Lake | 25.8% | 4.9%(+20.9)#13 | 5.0%(+20.8)#783 |
| 14. | Lake Ketchum | 24.3% | 4.9%(+19.4)#14 | 5.0%(+19.3)#890 |
| 15. | South Creek | 24.0% | 4.9%(+19.1)#15 | 5.0%(+19.0)#913 |
| 16. | Marcus | 23.4% | 4.9%(+18.5)#16 | 5.0%(+18.4)#972 |
| 17. | East Cathlamet | 22.8% | 4.9%(+17.8)#17 | 5.0%(+17.8)#1,037 |
| 18. | Yacolt | 22.3% | 4.9%(+17.4)#18 | 5.0%(+17.3)#1,088 |
| 19. | Wilkeson | 22.3% | 4.9%(+17.4)#19 | 5.0%(+17.3)#1,090 |
| 20. | Winthrop | 21.9% | 4.9%(+17.0)#20 | 5.0%(+16.9)#1,143 |
| 21. | Springdale | 21.8% | 4.9%(+16.9)#21 | 5.0%(+16.8)#1,151 |
| 22. | Skykomish | 20.8% | 4.9%(+15.9)#22 | 5.0%(+15.8)#1,267 |
| 23. | Alder | 20.5% | 4.9%(+15.5)#23 | 5.0%(+15.5)#1,314 |
| 24. | Endicott | 19.4% | 4.9%(+14.4)#24 | 5.0%(+14.4)#1,476 |
| 25. | Steptoe | 18.8% | 4.9%(+13.8)#25 | 5.0%(+13.8)#1,587 |
| 26. | Bickleton | 18.8% | 4.9%(+13.8)#26 | 5.0%(+13.8)#1,590 |
| 27. | Washtucna | 18.6% | 4.9%(+13.7)#27 | 5.0%(+13.6)#1,604 |
| 28. | Malden | 18.6% | 4.9%(+13.7)#28 | 5.0%(+13.6)#1,610 |
| 29. | Conconully | 17.9% | 4.9%(+13.0)#29 | 5.0%(+12.9)#1,756 |
| 30. | Four Lakes | 17.8% | 4.9%(+12.9)#30 | 5.0%(+12.8)#1,776 |
| 31. | Republic | 17.7% | 4.9%(+12.8)#31 | 5.0%(+12.7)#1,806 |
| 32. | Southworth | 17.7% | 4.9%(+12.8)#32 | 5.0%(+12.7)#1,809 |
| 33. | Metaline Falls | 17.4% | 4.9%(+12.5)#33 | 5.0%(+12.4)#1,874 |
| 34. | Rosburg | 17.1% | 4.9%(+12.2)#34 | 5.0%(+12.1)#1,920 |
| 35. | Cle Elum | 16.9% | 4.9%(+12.0)#35 | 5.0%(+12.0)#1,972 |
| 36. | Ione | 16.9% | 4.9%(+12.0)#36 | 5.0%(+12.0)#1,975 |
| 37. | Kahlotus | 16.9% | 4.9%(+12.0)#37 | 5.0%(+12.0)#1,976 |
| 38. | Goldendale | 16.8% | 4.9%(+11.9)#38 | 5.0%(+11.8)#2,002 |
| 39. | Malott | 16.8% | 4.9%(+11.9)#39 | 5.0%(+11.8)#2,007 |
| 40. | Clinton | 16.8% | 4.9%(+11.9)#40 | 5.0%(+11.8)#2,009 |
| 41. | Grand Coulee | 16.8% | 4.9%(+11.8)#41 | 5.0%(+11.8)#2,010 |
| 42. | Nile | 16.7% | 4.9%(+11.7)#42 | 5.0%(+11.7)#2,054 |
| 43. | Lacrosse | 16.5% | 4.9%(+11.6)#43 | 5.0%(+11.5)#2,104 |
| 44. | Cusick | 16.4% | 4.9%(+11.4)#44 | 5.0%(+11.4)#2,135 |
| 45. | Metaline | 16.0% | 4.9%(+11.1)#45 | 5.0%(+11.0)#2,233 |
| 46. | Pateros | 16.0% | 4.9%(+11.1)#46 | 5.0%(+11.0)#2,239 |
| 47. | Grayland | 15.9% | 4.9%(+10.9)#47 | 5.0%(+10.9)#2,281 |
| 48. | Puget Island | 15.8% | 4.9%(+10.9)#48 | 5.0%(+10.8)#2,302 |
| 49. | Lower Elochoman | 14.9% | 4.9%(+10.0)#49 | 5.0%(+9.94)#2,573 |
| 50. | Lyman | 14.6% | 4.9%(+9.71)#50 | 5.0%(+9.63)#2,701 |
| 51. | Custer | 14.2% | 4.9%(+9.29)#51 | 5.0%(+9.21)#2,848 |
| 52. | Clear Lake Cdp Pierce County | 14.0% | 4.9%(+9.08)#52 | 5.0%(+9.01)#2,923 |
| 53. | Midland | 13.8% | 4.9%(+8.84)#53 | 5.0%(+8.77)#3,031 |
| 54. | Concrete | 13.7% | 4.9%(+8.81)#54 | 5.0%(+8.73)#3,042 |
| 55. | Ravensdale | 13.4% | 4.9%(+8.52)#55 | 5.0%(+8.44)#3,172 |
| 56. | Gold Bar | 13.3% | 4.9%(+8.40)#56 | 5.0%(+8.33)#3,231 |
| 57. | Lexington | 13.1% | 4.9%(+8.22)#57 | 5.0%(+8.15)#3,318 |
| 58. | Spangle | 13.1% | 4.9%(+8.19)#58 | 5.0%(+8.11)#3,335 |
| 59. | Mccleary | 13.1% | 4.9%(+8.17)#59 | 5.0%(+8.09)#3,341 |
| 60. | Canyon Creek | 12.7% | 4.9%(+7.80)#60 | 5.0%(+7.73)#3,529 |
| 61. | Basin City | 12.7% | 4.9%(+7.74)#61 | 5.0%(+7.66)#3,554 |
| 62. | East Port Orchard | 12.4% | 4.9%(+7.52)#62 | 5.0%(+7.45)#3,682 |
| 63. | Port Hadlock Irondale | 12.3% | 4.9%(+7.42)#63 | 5.0%(+7.34)#3,731 |
| 64. | Waterville | 12.3% | 4.9%(+7.37)#64 | 5.0%(+7.29)#3,757 |
| 65. | Arlington Heights | 12.2% | 4.9%(+7.32)#65 | 5.0%(+7.24)#3,785 |
| 66. | Burbank | 12.2% | 4.9%(+7.28)#66 | 5.0%(+7.20)#3,808 |
| 67. | Parkwood | 12.1% | 4.9%(+7.21)#67 | 5.0%(+7.14)#3,845 |
| 68. | Wauna | 12.1% | 4.9%(+7.19)#68 | 5.0%(+7.11)#3,871 |
| 69. | Kitsap Lake | 11.8% | 4.9%(+6.91)#69 | 5.0%(+6.84)#4,038 |
| 70. | Gleed | 11.8% | 4.9%(+6.91)#70 | 5.0%(+6.83)#4,039 |
| 71. | Jamestown | 11.8% | 4.9%(+6.85)#71 | 5.0%(+6.77)#4,084 |
| 72. | Deer Park | 11.8% | 4.9%(+6.84)#72 | 5.0%(+6.77)#4,107 |
| 73. | Burley | 11.7% | 4.9%(+6.83)#73 | 5.0%(+6.75)#4,115 |
| 74. | Sprague | 11.7% | 4.9%(+6.82)#74 | 5.0%(+6.75)#4,117 |
| 75. | Davenport | 11.7% | 4.9%(+6.74)#75 | 5.0%(+6.67)#4,166 |
| 76. | Mansfield | 11.6% | 4.9%(+6.66)#76 | 5.0%(+6.58)#4,216 |
| 77. | Satsop | 11.6% | 4.9%(+6.65)#77 | 5.0%(+6.57)#4,221 |
| 78. | Carbonado | 11.5% | 4.9%(+6.59)#78 | 5.0%(+6.52)#4,260 |
| 79. | Marrowstone | 11.4% | 4.9%(+6.49)#79 | 5.0%(+6.41)#4,335 |
| 80. | Yelm | 11.4% | 4.9%(+6.45)#80 | 5.0%(+6.37)#4,358 |
| 81. | Peaceful Valley | 11.3% | 4.9%(+6.36)#81 | 5.0%(+6.29)#4,432 |
| 82. | Hamilton | 11.3% | 4.9%(+6.35)#82 | 5.0%(+6.27)#4,441 |
| 83. | Venersborg | 11.2% | 4.9%(+6.25)#83 | 5.0%(+6.17)#4,523 |
| 84. | Rainier | 11.1% | 4.9%(+6.21)#84 | 5.0%(+6.14)#4,551 |
| 85. | Lochsloy | 11.1% | 4.9%(+6.19)#85 | 5.0%(+6.11)#4,613 |
| 86. | Nooksack | 11.0% | 4.9%(+6.05)#86 | 5.0%(+5.97)#4,683 |
| 87. | Coupeville | 10.9% | 4.9%(+6.01)#87 | 5.0%(+5.94)#4,717 |
| 88. | Cohassett Beach | 10.9% | 4.9%(+6.00)#88 | 5.0%(+5.93)#4,726 |
| 89. | Fobes Hill | 10.9% | 4.9%(+5.98)#89 | 5.0%(+5.90)#4,747 |
| 90. | Sedro Woolley | 10.9% | 4.9%(+5.96)#90 | 5.0%(+5.89)#4,758 |
| 91. | Machias | 10.8% | 4.9%(+5.90)#91 | 5.0%(+5.83)#4,800 |
| 92. | Elk Plain | 10.8% | 4.9%(+5.89)#92 | 5.0%(+5.81)#4,813 |
| 93. | Granite Falls | 10.7% | 4.9%(+5.82)#93 | 5.0%(+5.75)#4,868 |
| 94. | Belfair | 10.5% | 4.9%(+5.61)#94 | 5.0%(+5.54)#5,034 |
| 95. | Stanwood | 10.5% | 4.9%(+5.61)#95 | 5.0%(+5.53)#5,035 |
| 96. | Tokeland | 10.5% | 4.9%(+5.61)#96 | 5.0%(+5.53)#5,057 |
| 97. | Colfax | 10.4% | 4.9%(+5.52)#97 | 5.0%(+5.45)#5,122 |
| 98. | Tekoa | 10.4% | 4.9%(+5.48)#98 | 5.0%(+5.40)#5,157 |
| 99. | Moses Lake North | 10.4% | 4.9%(+5.47)#99 | 5.0%(+5.39)#5,170 |
| 100. | North Bonneville | 10.4% | 4.9%(+5.45)#100 | 5.0%(+5.37)#5,186 |
Common Questions
What are the Top 10 Cities with the Highest Percentage of Population Employed in Construction & Extraction in Washington?
Top 10 Cities with the Highest Percentage of Population Employed in Construction & Extraction in Washington are:
#1
100.0%
#2
66.7%
#3
62.1%
#4
43.5%
#5
43.0%
#6
41.4%
#7
32.5%
#8
32.3%
#9
30.0%
#10
29.5%
What city has the Highest Percentage of Population Employed in Construction & Extraction in Washington?
Rockport has the Highest Percentage of Population Employed in Construction & Extraction in Washington with 100.0%.
What is the Percentage of Population Employed in Construction & Extraction in the State of Washington?
Percentage of Population Employed in Construction & Extraction in Washington is 4.9%.
What is the Percentage of Population Employed in Construction & Extraction in the United States?
Percentage of Population Employed in Construction & Extraction in the United States is 5.0%.