Cities with the Most Immigrants from South Africa in Washington
RELATED REPORTS & OPTIONS
South Africa
Washington
Compare Cities
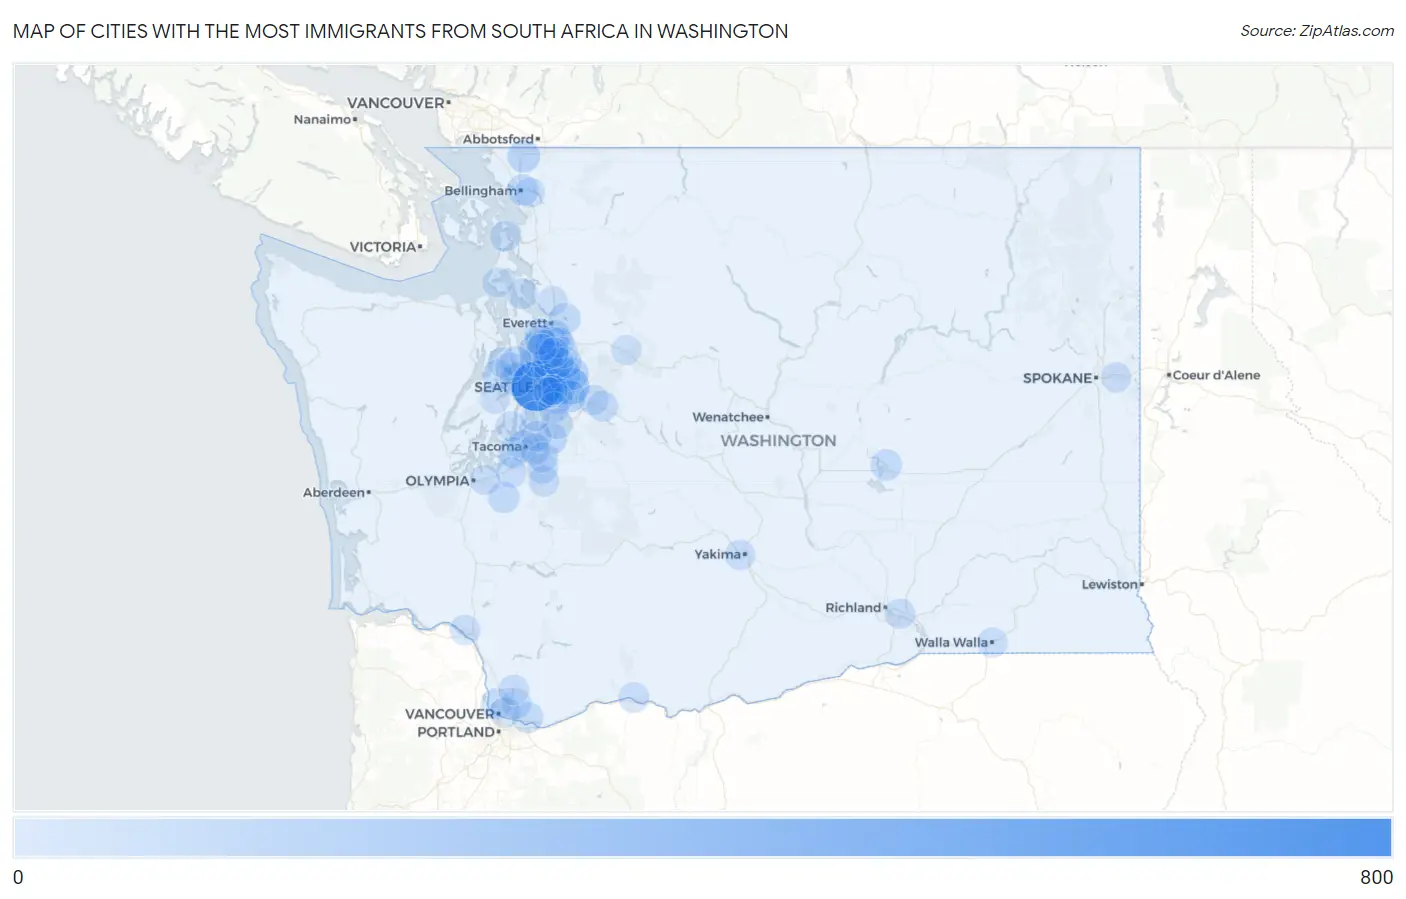
Map of Cities with the Most Immigrants from South Africa in Washington
0
800
Cities with the Most Immigrants from South Africa in Washington
| City | South Africa | vs State | vs National | |
| 1. | Seattle | 710 | 3,373(21.05%)#1 | 117,055(0.61%)#11 |
| 2. | Sammamish | 218 | 3,373(6.46%)#2 | 117,055(0.19%)#60 |
| 3. | Kirkland | 143 | 3,373(4.24%)#3 | 117,055(0.12%)#106 |
| 4. | Bellevue | 128 | 3,373(3.79%)#4 | 117,055(0.11%)#118 |
| 5. | Redmond | 119 | 3,373(3.53%)#5 | 117,055(0.10%)#132 |
| 6. | Mill Creek | 103 | 3,373(3.05%)#6 | 117,055(0.09%)#170 |
| 7. | Bothell | 102 | 3,373(3.02%)#7 | 117,055(0.09%)#174 |
| 8. | Bainbridge Island | 98 | 3,373(2.91%)#8 | 117,055(0.08%)#184 |
| 9. | Union Hill Novelty Hill | 85 | 3,373(2.52%)#9 | 117,055(0.07%)#229 |
| 10. | Lynden | 83 | 3,373(2.46%)#10 | 117,055(0.07%)#238 |
| 11. | Shoreline | 81 | 3,373(2.40%)#11 | 117,055(0.07%)#250 |
| 12. | Edmonds | 72 | 3,373(2.13%)#12 | 117,055(0.06%)#292 |
| 13. | Issaquah | 65 | 3,373(1.93%)#13 | 117,055(0.06%)#328 |
| 14. | Auburn | 63 | 3,373(1.87%)#14 | 117,055(0.05%)#340 |
| 15. | Eastmont | 61 | 3,373(1.81%)#15 | 117,055(0.05%)#363 |
| 16. | Tacoma | 55 | 3,373(1.63%)#16 | 117,055(0.05%)#400 |
| 17. | Camas | 45 | 3,373(1.33%)#17 | 117,055(0.04%)#501 |
| 18. | Maltby | 45 | 3,373(1.33%)#18 | 117,055(0.04%)#504 |
| 19. | Bellingham | 43 | 3,373(1.27%)#19 | 117,055(0.04%)#516 |
| 20. | Lake Stevens | 43 | 3,373(1.27%)#20 | 117,055(0.04%)#520 |
| 21. | Yelm | 43 | 3,373(1.27%)#21 | 117,055(0.04%)#525 |
| 22. | Moses Lake | 41 | 3,373(1.22%)#22 | 117,055(0.04%)#544 |
| 23. | Riverpoint | 40 | 3,373(1.19%)#23 | 117,055(0.03%)#565 |
| 24. | Mukilteo | 36 | 3,373(1.07%)#24 | 117,055(0.03%)#620 |
| 25. | Newcastle | 34 | 3,373(1.01%)#25 | 117,055(0.03%)#659 |
| 26. | University Place | 33 | 3,373(0.98%)#26 | 117,055(0.03%)#679 |
| 27. | Kenmore | 27 | 3,373(0.80%)#27 | 117,055(0.02%)#801 |
| 28. | Cottage Lake | 27 | 3,373(0.80%)#28 | 117,055(0.02%)#802 |
| 29. | Lake Shore | 25 | 3,373(0.74%)#29 | 117,055(0.02%)#852 |
| 30. | Camano | 24 | 3,373(0.71%)#30 | 117,055(0.02%)#871 |
| 31. | Fife | 24 | 3,373(0.71%)#31 | 117,055(0.02%)#875 |
| 32. | North Bend | 24 | 3,373(0.71%)#32 | 117,055(0.02%)#878 |
| 33. | Renton | 22 | 3,373(0.65%)#33 | 117,055(0.02%)#905 |
| 34. | Graham | 20 | 3,373(0.59%)#34 | 117,055(0.02%)#967 |
| 35. | Vancouver | 19 | 3,373(0.56%)#35 | 117,055(0.02%)#987 |
| 36. | Kent | 19 | 3,373(0.56%)#36 | 117,055(0.02%)#988 |
| 37. | Longview | 17 | 3,373(0.50%)#37 | 117,055(0.01%)#1,083 |
| 38. | Pasco | 16 | 3,373(0.47%)#38 | 117,055(0.01%)#1,118 |
| 39. | South Hill | 16 | 3,373(0.47%)#39 | 117,055(0.01%)#1,119 |
| 40. | Bothell West | 16 | 3,373(0.47%)#40 | 117,055(0.01%)#1,132 |
| 41. | White Salmon | 16 | 3,373(0.47%)#41 | 117,055(0.01%)#1,154 |
| 42. | Mercer Island | 14 | 3,373(0.42%)#42 | 117,055(0.01%)#1,221 |
| 43. | Silver Firs | 14 | 3,373(0.42%)#43 | 117,055(0.01%)#1,223 |
| 44. | Silverdale | 14 | 3,373(0.42%)#44 | 117,055(0.01%)#1,226 |
| 45. | Fort Lewis | 14 | 3,373(0.42%)#45 | 117,055(0.01%)#1,233 |
| 46. | Federal Way | 13 | 3,373(0.39%)#46 | 117,055(0.01%)#1,271 |
| 47. | Yakima | 13 | 3,373(0.39%)#47 | 117,055(0.01%)#1,274 |
| 48. | Orchards | 13 | 3,373(0.39%)#48 | 117,055(0.01%)#1,293 |
| 49. | Battle Ground | 13 | 3,373(0.39%)#49 | 117,055(0.01%)#1,301 |
| 50. | Puyallup | 12 | 3,373(0.36%)#50 | 117,055(0.01%)#1,340 |
| 51. | Anacortes | 11 | 3,373(0.33%)#51 | 117,055(0.01%)#1,411 |
| 52. | Woodinville | 11 | 3,373(0.33%)#52 | 117,055(0.01%)#1,417 |
| 53. | Maplewood | 11 | 3,373(0.33%)#53 | 117,055(0.01%)#1,427 |
| 54. | Spokane Valley | 10 | 3,373(0.30%)#54 | 117,055(0.01%)#1,443 |
| 55. | Bremerton | 10 | 3,373(0.30%)#55 | 117,055(0.01%)#1,449 |
| 56. | Poulsbo | 10 | 3,373(0.30%)#56 | 117,055(0.01%)#1,465 |
| 57. | North Lynnwood | 9 | 3,373(0.27%)#57 | 117,055(0.01%)#1,509 |
| 58. | Lacey | 8 | 3,373(0.24%)#58 | 117,055(0.01%)#1,566 |
| 59. | Picnic Point | 8 | 3,373(0.24%)#59 | 117,055(0.01%)#1,598 |
| 60. | Snoqualmie | 7 | 3,373(0.21%)#60 | 117,055(0.01%)#1,648 |
| 61. | Marysville | 5 | 3,373(0.15%)#61 | 117,055(0.00%)#1,759 |
| 62. | Tehaleh | 5 | 3,373(0.15%)#62 | 117,055(0.00%)#1,788 |
| 63. | Index | 5 | 3,373(0.15%)#63 | 117,055(0.00%)#1,823 |
| 64. | Lynnwood | 4 | 3,373(0.12%)#64 | 117,055(0.00%)#1,832 |
| 65. | Bothell East | 4 | 3,373(0.12%)#65 | 117,055(0.00%)#1,842 |
| 66. | Normandy Park | 4 | 3,373(0.12%)#66 | 117,055(0.00%)#1,852 |
| 67. | Coupeville | 4 | 3,373(0.12%)#67 | 117,055(0.00%)#1,866 |
| 68. | Beaux Arts Village | 4 | 3,373(0.12%)#68 | 117,055(0.00%)#1,894 |
| 69. | Indianola | 3 | 3,373(0.09%)#69 | 117,055(0.00%)#1,908 |
| 70. | Walla Walla | 2 | 3,373(0.06%)#70 | 117,055(0.00%)#1,953 |
| 71. | Suquamish | 2 | 3,373(0.06%)#71 | 117,055(0.00%)#1,961 |
| 72. | Geneva | 1 | 3,373(0.03%)#72 | 117,055(0.00%)#2,020 |
Common Questions
What are the Top 10 Cities with the Most Immigrants from South Africa in Washington?
Top 10 Cities with the Most Immigrants from South Africa in Washington are:
#1
710
#2
218
#3
143
#4
128
#5
119
#6
103
#7
102
#8
98
#9
85
#10
83
What city has the Most Immigrants from South Africa in Washington?
Seattle has the Most Immigrants from South Africa in Washington with 710.
What is the Total Immigrants from South Africa in the State of Washington?
Total Immigrants from South Africa in Washington is 3,373.
What is the Total Immigrants from South Africa in the United States?
Total Immigrants from South Africa in the United States is 117,055.