Cities with the Most Immigrants from Fiji in Washington
RELATED REPORTS & OPTIONS
Fiji
Washington
Compare Cities
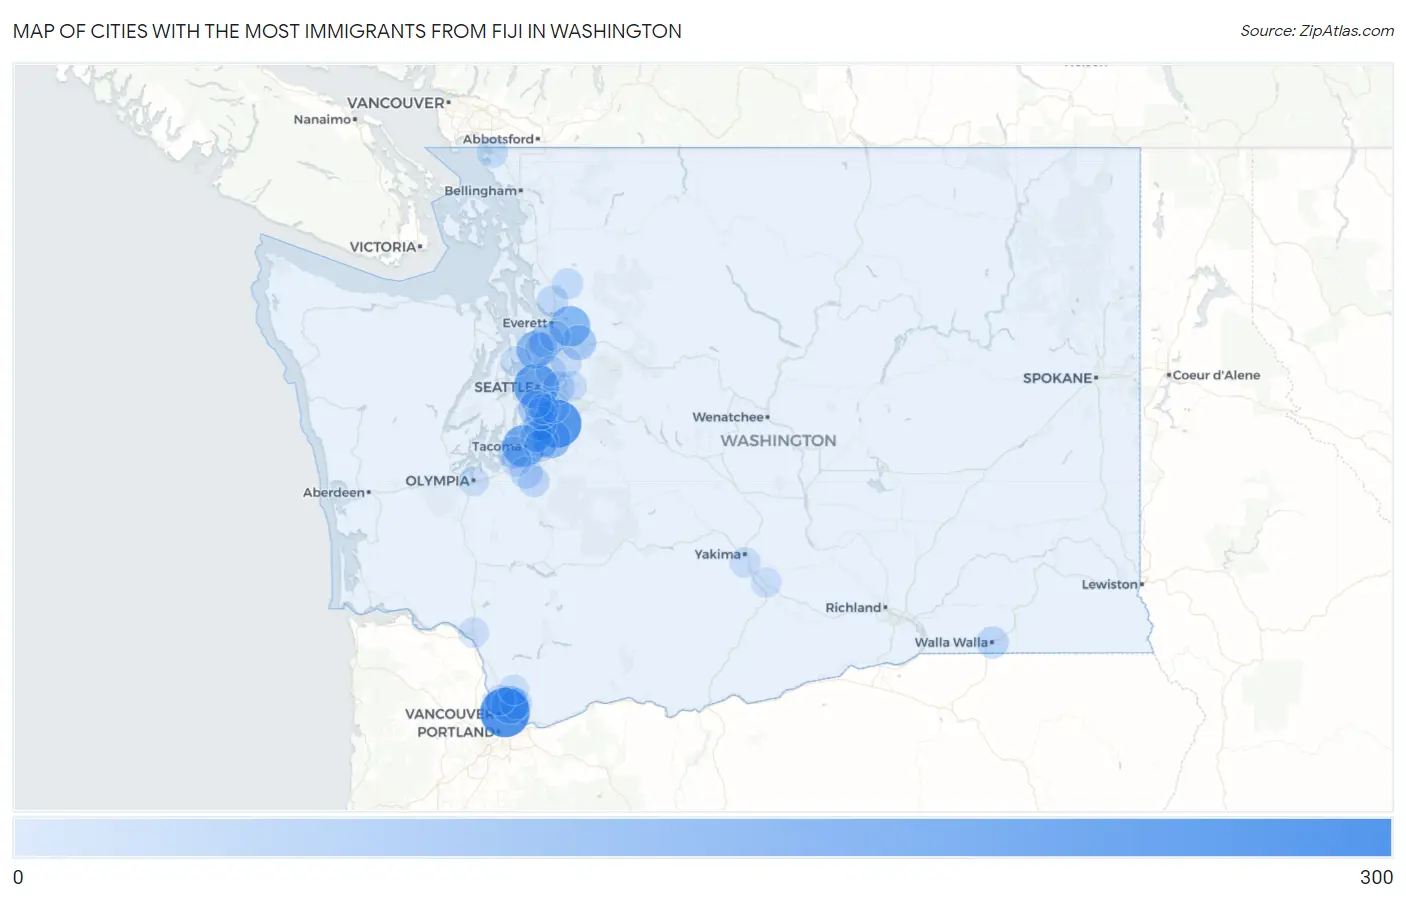
Map of Cities with the Most Immigrants from Fiji in Washington
0
300
Cities with the Most Immigrants from Fiji in Washington
| City | Fiji | vs State | vs National | |
| 1. | Vancouver | 265 | 2,314(11.45%)#1 | 43,247(0.61%)#28 |
| 2. | Kent | 242 | 2,314(10.46%)#2 | 43,247(0.56%)#32 |
| 3. | Seattle | 199 | 2,314(8.60%)#3 | 43,247(0.46%)#38 |
| 4. | Tacoma | 166 | 2,314(7.17%)#4 | 43,247(0.38%)#51 |
| 5. | Everett | 139 | 2,314(6.01%)#5 | 43,247(0.32%)#58 |
| 6. | Auburn | 114 | 2,314(4.93%)#6 | 43,247(0.26%)#76 |
| 7. | Edmonds | 100 | 2,314(4.32%)#7 | 43,247(0.23%)#86 |
| 8. | Five Corners | 100 | 2,314(4.32%)#8 | 43,247(0.23%)#87 |
| 9. | Burien | 76 | 2,314(3.28%)#9 | 43,247(0.18%)#108 |
| 10. | Monroe | 65 | 2,314(2.81%)#10 | 43,247(0.15%)#123 |
| 11. | Lake Stickney | 61 | 2,314(2.64%)#11 | 43,247(0.14%)#133 |
| 12. | Des Moines | 45 | 2,314(1.94%)#12 | 43,247(0.10%)#161 |
| 13. | Lynnwood | 39 | 2,314(1.69%)#13 | 43,247(0.09%)#174 |
| 14. | Bellevue | 29 | 2,314(1.25%)#14 | 43,247(0.07%)#208 |
| 15. | University Place | 28 | 2,314(1.21%)#15 | 43,247(0.06%)#215 |
| 16. | Spanaway | 28 | 2,314(1.21%)#16 | 43,247(0.06%)#216 |
| 17. | Walla Walla | 26 | 2,314(1.12%)#17 | 43,247(0.06%)#224 |
| 18. | Lakeland South | 26 | 2,314(1.12%)#18 | 43,247(0.06%)#226 |
| 19. | Federal Way | 25 | 2,314(1.08%)#19 | 43,247(0.06%)#227 |
| 20. | Milton | 23 | 2,314(0.99%)#20 | 43,247(0.05%)#244 |
| 21. | Seatac | 22 | 2,314(0.95%)#21 | 43,247(0.05%)#248 |
| 22. | Marysville | 21 | 2,314(0.91%)#22 | 43,247(0.05%)#251 |
| 23. | Elk Plain | 20 | 2,314(0.86%)#23 | 43,247(0.05%)#266 |
| 24. | Orchards | 17 | 2,314(0.73%)#24 | 43,247(0.04%)#280 |
| 25. | Renton | 16 | 2,314(0.69%)#25 | 43,247(0.04%)#283 |
| 26. | Arlington Heights | 14 | 2,314(0.61%)#26 | 43,247(0.03%)#306 |
| 27. | Blaine | 13 | 2,314(0.56%)#27 | 43,247(0.03%)#311 |
| 28. | Lakewood | 11 | 2,314(0.48%)#28 | 43,247(0.03%)#324 |
| 29. | Eastmont | 11 | 2,314(0.48%)#29 | 43,247(0.03%)#328 |
| 30. | Tukwila | 11 | 2,314(0.48%)#30 | 43,247(0.03%)#329 |
| 31. | Salmon Creek | 9 | 2,314(0.39%)#31 | 43,247(0.02%)#358 |
| 32. | Union Gap | 9 | 2,314(0.39%)#32 | 43,247(0.02%)#362 |
| 33. | Sammamish | 8 | 2,314(0.35%)#33 | 43,247(0.02%)#366 |
| 34. | Cottage Lake | 8 | 2,314(0.35%)#34 | 43,247(0.02%)#370 |
| 35. | Kirkland | 7 | 2,314(0.30%)#35 | 43,247(0.02%)#380 |
| 36. | Battle Ground | 5 | 2,314(0.22%)#36 | 43,247(0.01%)#412 |
| 37. | Buena | 4 | 2,314(0.17%)#37 | 43,247(0.01%)#423 |
| 38. | White Center | 3 | 2,314(0.13%)#38 | 43,247(0.01%)#426 |
| 39. | Kelso | 3 | 2,314(0.13%)#39 | 43,247(0.01%)#428 |
| 40. | Indianola | 3 | 2,314(0.13%)#40 | 43,247(0.01%)#429 |
| 41. | Olympia | 1 | 2,314(0.04%)#41 | 43,247(0.00%)#438 |
Common Questions
What are the Top 10 Cities with the Most Immigrants from Fiji in Washington?
Top 10 Cities with the Most Immigrants from Fiji in Washington are:
What city has the Most Immigrants from Fiji in Washington?
Vancouver has the Most Immigrants from Fiji in Washington with 265.
What is the Total Immigrants from Fiji in the State of Washington?
Total Immigrants from Fiji in Washington is 2,314.
What is the Total Immigrants from Fiji in the United States?
Total Immigrants from Fiji in the United States is 43,247.