Cities with the Most Immigrants from Moldova in Washington
RELATED REPORTS & OPTIONS
Moldova
Washington
Compare Cities
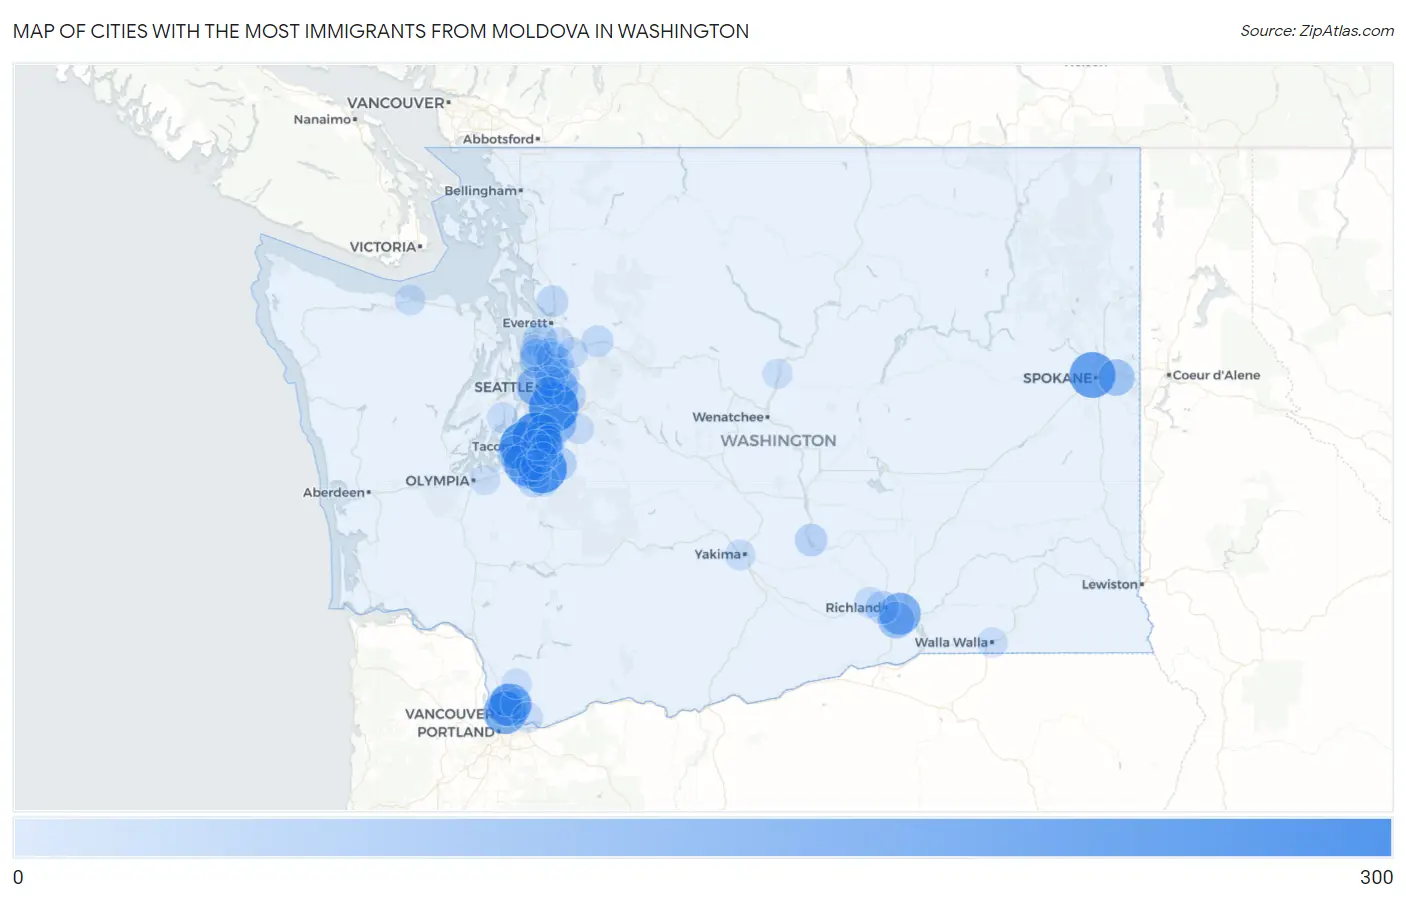
Map of Cities with the Most Immigrants from Moldova in Washington
0
300
Cities with the Most Immigrants from Moldova in Washington
| City | Moldova | vs State | vs National | |
| 1. | Renton | 296 | 4,536(6.53%)#1 | 53,673(0.55%)#19 |
| 2. | South Hill | 281 | 4,536(6.19%)#2 | 53,673(0.52%)#20 |
| 3. | Tacoma | 279 | 4,536(6.15%)#3 | 53,673(0.52%)#21 |
| 4. | Federal Way | 272 | 4,536(6.00%)#4 | 53,673(0.51%)#23 |
| 5. | Fairwood Cdp King County | 240 | 4,536(5.29%)#5 | 53,673(0.45%)#28 |
| 6. | Spokane | 239 | 4,536(5.27%)#6 | 53,673(0.45%)#29 |
| 7. | Parkland | 215 | 4,536(4.74%)#7 | 53,673(0.40%)#37 |
| 8. | Vancouver | 197 | 4,536(4.34%)#8 | 53,673(0.37%)#45 |
| 9. | Five Corners | 191 | 4,536(4.21%)#9 | 53,673(0.36%)#48 |
| 10. | Pasco | 174 | 4,536(3.84%)#10 | 53,673(0.32%)#56 |
| 11. | Seattle | 138 | 4,536(3.04%)#11 | 53,673(0.26%)#68 |
| 12. | Bellevue | 127 | 4,536(2.80%)#12 | 53,673(0.24%)#73 |
| 13. | Lakeland South | 127 | 4,536(2.80%)#13 | 53,673(0.24%)#76 |
| 14. | Kent | 113 | 4,536(2.49%)#14 | 53,673(0.21%)#87 |
| 15. | Kennewick | 100 | 4,536(2.20%)#15 | 53,673(0.19%)#96 |
| 16. | Spokane Valley | 94 | 4,536(2.07%)#16 | 53,673(0.18%)#100 |
| 17. | Kirkland | 91 | 4,536(2.01%)#17 | 53,673(0.17%)#107 |
| 18. | Minnehaha | 71 | 4,536(1.57%)#18 | 53,673(0.13%)#143 |
| 19. | Picnic Point | 61 | 4,536(1.34%)#19 | 53,673(0.11%)#169 |
| 20. | Shoreline | 56 | 4,536(1.23%)#20 | 53,673(0.10%)#185 |
| 21. | Lakeland North | 49 | 4,536(1.08%)#21 | 53,673(0.09%)#199 |
| 22. | University Place | 47 | 4,536(1.04%)#22 | 53,673(0.09%)#209 |
| 23. | Richland | 45 | 4,536(0.99%)#23 | 53,673(0.08%)#222 |
| 24. | Prairie Ridge | 45 | 4,536(0.99%)#24 | 53,673(0.08%)#224 |
| 25. | Spanaway | 44 | 4,536(0.97%)#25 | 53,673(0.08%)#226 |
| 26. | Esperance | 37 | 4,536(0.82%)#26 | 53,673(0.07%)#261 |
| 27. | Desert Aire | 37 | 4,536(0.82%)#27 | 53,673(0.07%)#262 |
| 28. | Barberton | 36 | 4,536(0.79%)#28 | 53,673(0.07%)#263 |
| 29. | Elk Plain | 32 | 4,536(0.71%)#29 | 53,673(0.06%)#286 |
| 30. | Issaquah | 29 | 4,536(0.64%)#30 | 53,673(0.05%)#312 |
| 31. | Frederickson | 29 | 4,536(0.64%)#31 | 53,673(0.05%)#314 |
| 32. | Bothell West | 27 | 4,536(0.60%)#32 | 53,673(0.05%)#326 |
| 33. | Marysville | 24 | 4,536(0.53%)#33 | 53,673(0.04%)#353 |
| 34. | Bothell | 24 | 4,536(0.53%)#34 | 53,673(0.04%)#354 |
| 35. | Redmond | 23 | 4,536(0.51%)#35 | 53,673(0.04%)#363 |
| 36. | Sumner | 23 | 4,536(0.51%)#36 | 53,673(0.04%)#372 |
| 37. | Sultan | 23 | 4,536(0.51%)#37 | 53,673(0.04%)#373 |
| 38. | Mercer Island | 18 | 4,536(0.40%)#38 | 53,673(0.03%)#419 |
| 39. | Orchards | 17 | 4,536(0.37%)#39 | 53,673(0.03%)#433 |
| 40. | Algona | 17 | 4,536(0.37%)#40 | 53,673(0.03%)#445 |
| 41. | Graham | 16 | 4,536(0.35%)#41 | 53,673(0.03%)#447 |
| 42. | Pacific | 16 | 4,536(0.35%)#42 | 53,673(0.03%)#458 |
| 43. | Clover Creek | 15 | 4,536(0.33%)#43 | 53,673(0.03%)#477 |
| 44. | West Richland | 14 | 4,536(0.31%)#44 | 53,673(0.03%)#502 |
| 45. | Woodinville | 14 | 4,536(0.31%)#45 | 53,673(0.03%)#506 |
| 46. | Edgewood | 14 | 4,536(0.31%)#46 | 53,673(0.03%)#508 |
| 47. | Edmonds | 13 | 4,536(0.29%)#47 | 53,673(0.02%)#521 |
| 48. | Lakewood | 12 | 4,536(0.26%)#48 | 53,673(0.02%)#539 |
| 49. | Camas | 12 | 4,536(0.26%)#49 | 53,673(0.02%)#548 |
| 50. | Burley | 12 | 4,536(0.26%)#50 | 53,673(0.02%)#559 |
| 51. | Silver Firs | 11 | 4,536(0.24%)#51 | 53,673(0.02%)#572 |
| 52. | Port Angeles | 11 | 4,536(0.24%)#52 | 53,673(0.02%)#575 |
| 53. | High Bridge | 11 | 4,536(0.24%)#53 | 53,673(0.02%)#582 |
| 54. | Yakima | 10 | 4,536(0.22%)#54 | 53,673(0.02%)#590 |
| 55. | Auburn | 9 | 4,536(0.20%)#55 | 53,673(0.02%)#630 |
| 56. | Ravensdale | 9 | 4,536(0.20%)#56 | 53,673(0.02%)#650 |
| 57. | Fairwood Cdp Spokane County | 8 | 4,536(0.18%)#57 | 53,673(0.01%)#676 |
| 58. | Summit View | 8 | 4,536(0.18%)#58 | 53,673(0.01%)#677 |
| 59. | Clyde Hill | 6 | 4,536(0.13%)#59 | 53,673(0.01%)#716 |
| 60. | Lewisville | 6 | 4,536(0.13%)#60 | 53,673(0.01%)#717 |
| 61. | Fife Heights | 6 | 4,536(0.13%)#61 | 53,673(0.01%)#718 |
| 62. | Puyallup | 5 | 4,536(0.11%)#62 | 53,673(0.01%)#724 |
| 63. | Walla Walla | 5 | 4,536(0.11%)#63 | 53,673(0.01%)#726 |
| 64. | Lacey | 2 | 4,536(0.04%)#64 | 53,673(0.00%)#759 |
| 65. | Entiat | 2 | 4,536(0.04%)#65 | 53,673(0.00%)#765 |
Common Questions
What are the Top 10 Cities with the Most Immigrants from Moldova in Washington?
Top 10 Cities with the Most Immigrants from Moldova in Washington are:
#1
296
#2
281
#3
279
#4
272
#5
239
#6
215
#7
197
#8
191
#9
174
#10
138
What city has the Most Immigrants from Moldova in Washington?
Renton has the Most Immigrants from Moldova in Washington with 296.
What is the Total Immigrants from Moldova in the State of Washington?
Total Immigrants from Moldova in Washington is 4,536.
What is the Total Immigrants from Moldova in the United States?
Total Immigrants from Moldova in the United States is 53,673.