Cities with the Highest Percentage of Population with a Degree in Communications in Washington
RELATED REPORTS & OPTIONS
Communications
Washington
Compare Cities
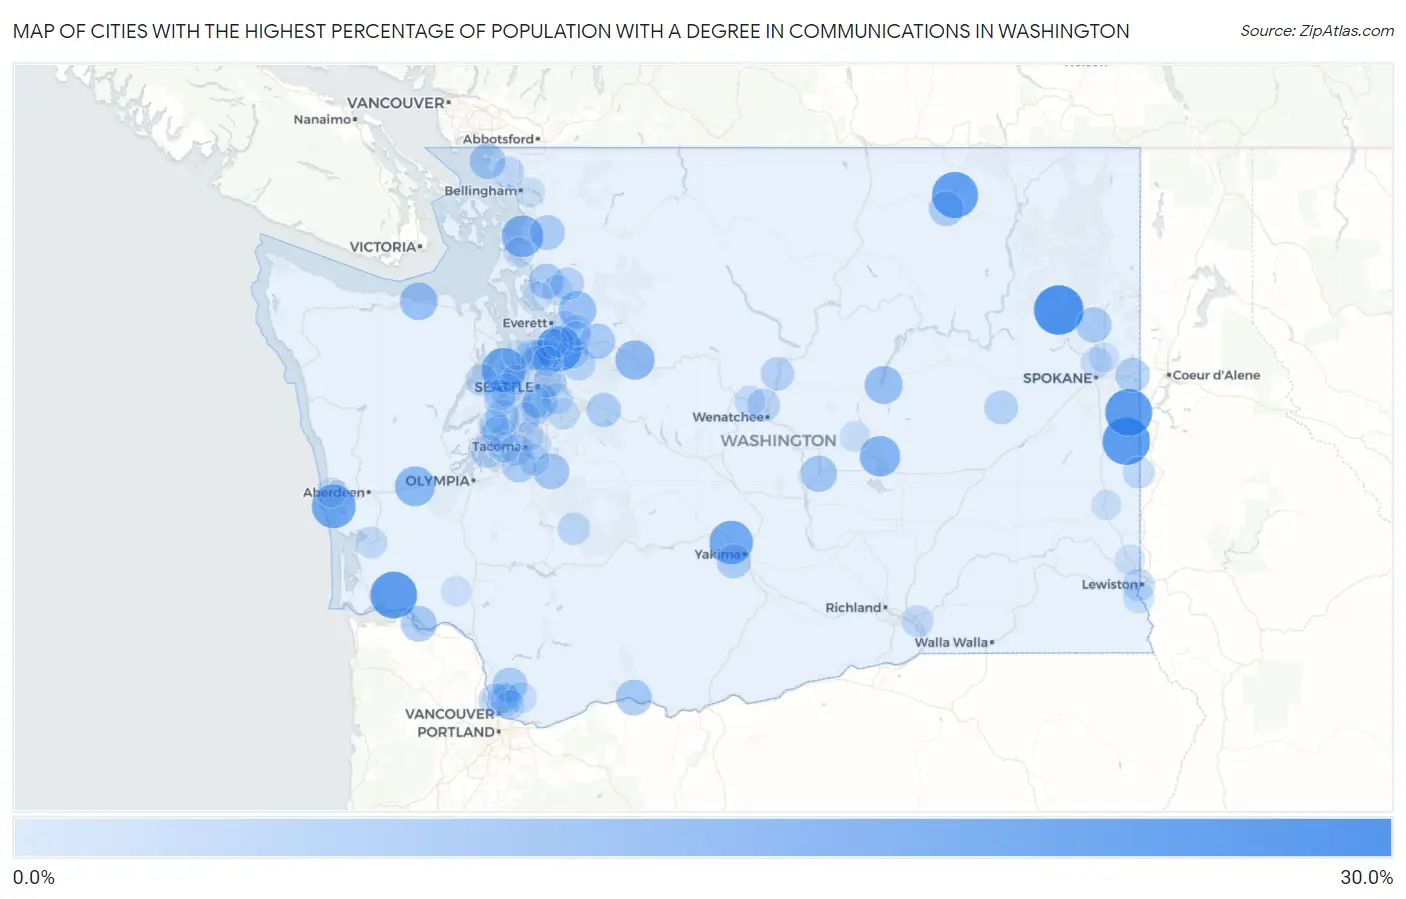
Map of Cities with the Highest Percentage of Population with a Degree in Communications in Washington
0.0%
30.0%
Cities with the Highest Percentage of Population with a Degree in Communications in Washington
| City | % Graduates | vs State | vs National | |
| 1. | Springdale | 26.3% | 3.9%(+22.4)#1 | 4.1%(+22.2)#284 |
| 2. | Latah | 23.8% | 3.9%(+19.9)#2 | 4.1%(+19.7)#343 |
| 3. | Rockford | 23.5% | 3.9%(+19.5)#3 | 4.1%(+19.3)#355 |
| 4. | Grays River | 23.3% | 3.9%(+19.3)#4 | 4.1%(+19.1)#358 |
| 5. | Curlew Lake | 22.5% | 3.9%(+18.6)#5 | 4.1%(+18.4)#368 |
| 6. | Clearview | 21.9% | 3.9%(+17.9)#6 | 4.1%(+17.8)#388 |
| 7. | Keyport | 20.3% | 3.9%(+16.4)#7 | 4.1%(+16.2)#438 |
| 8. | Westport | 20.0% | 3.9%(+16.1)#8 | 4.1%(+15.9)#450 |
| 9. | Eschbach | 19.7% | 3.9%(+15.8)#9 | 4.1%(+15.6)#482 |
| 10. | Bay View | 17.5% | 3.9%(+13.6)#10 | 4.1%(+13.4)#566 |
| 11. | Moses Lake North | 16.3% | 3.9%(+12.4)#11 | 4.1%(+12.2)#650 |
| 12. | Elma | 15.7% | 3.9%(+11.8)#12 | 4.1%(+11.6)#697 |
| 13. | Baring | 15.0% | 3.9%(+11.1)#13 | 4.1%(+10.9)#750 |
| 14. | Coulee City | 13.5% | 3.9%(+9.52)#14 | 4.1%(+9.33)#913 |
| 15. | Port Angeles East | 13.4% | 3.9%(+9.41)#15 | 4.1%(+9.22)#922 |
| 16. | Lake Bosworth | 13.3% | 3.9%(+9.37)#16 | 4.1%(+9.17)#943 |
| 17. | George | 11.8% | 3.9%(+7.82)#17 | 4.1%(+7.63)#1,178 |
| 18. | Orting | 11.4% | 3.9%(+7.41)#18 | 4.1%(+7.22)#1,254 |
| 19. | White Salmon | 11.3% | 3.9%(+7.33)#19 | 4.1%(+7.14)#1,270 |
| 20. | Puget Island | 11.2% | 3.9%(+7.29)#20 | 4.1%(+7.09)#1,276 |
| 21. | Birch Bay | 11.1% | 3.9%(+7.11)#21 | 4.1%(+6.92)#1,326 |
| 22. | Sultan | 10.9% | 3.9%(+6.95)#22 | 4.1%(+6.76)#1,362 |
| 23. | Deer Park | 10.7% | 3.9%(+6.79)#23 | 4.1%(+6.59)#1,396 |
| 24. | Cherry Grove | 10.3% | 3.9%(+6.36)#24 | 4.1%(+6.17)#1,499 |
| 25. | Sunday Lake | 10.3% | 3.9%(+6.36)#25 | 4.1%(+6.17)#1,500 |
| 26. | Republic | 10.2% | 3.9%(+6.26)#26 | 4.1%(+6.07)#1,530 |
| 27. | Sedro Woolley | 10.2% | 3.9%(+6.25)#27 | 4.1%(+6.05)#1,532 |
| 28. | Mcchord Afb | 10.1% | 3.9%(+6.19)#28 | 4.1%(+6.00)#1,552 |
| 29. | Burley | 9.9% | 3.9%(+5.94)#29 | 4.1%(+5.74)#1,623 |
| 30. | Boulevard Park | 9.9% | 3.9%(+5.93)#30 | 4.1%(+5.73)#1,631 |
| 31. | Raft Island | 9.7% | 3.9%(+5.77)#31 | 4.1%(+5.58)#1,665 |
| 32. | Ahtanum | 9.7% | 3.9%(+5.74)#32 | 4.1%(+5.54)#1,679 |
| 33. | Liberty Lake | 9.6% | 3.9%(+5.70)#33 | 4.1%(+5.51)#1,696 |
| 34. | Riverbend | 9.6% | 3.9%(+5.67)#34 | 4.1%(+5.47)#1,708 |
| 35. | Crescent Bar | 9.1% | 3.9%(+5.15)#35 | 4.1%(+4.96)#1,885 |
| 36. | Harrington | 8.9% | 3.9%(+4.92)#36 | 4.1%(+4.73)#1,968 |
| 37. | Duvall | 8.8% | 3.9%(+4.88)#37 | 4.1%(+4.68)#1,986 |
| 38. | Entiat | 8.7% | 3.9%(+4.71)#38 | 4.1%(+4.52)#2,057 |
| 39. | Felida | 8.4% | 3.9%(+4.50)#39 | 4.1%(+4.31)#2,148 |
| 40. | Longbranch | 8.4% | 3.9%(+4.47)#40 | 4.1%(+4.27)#2,170 |
| 41. | Arlington Heights | 8.3% | 3.9%(+4.33)#41 | 4.1%(+4.14)#2,230 |
| 42. | Sunnyslope | 8.1% | 3.9%(+4.12)#42 | 4.1%(+3.93)#2,325 |
| 43. | Enetai | 7.9% | 3.9%(+3.99)#43 | 4.1%(+3.79)#2,388 |
| 44. | Ashford | 7.6% | 3.9%(+3.67)#44 | 4.1%(+3.47)#2,587 |
| 45. | Clarkston | 7.5% | 3.9%(+3.59)#45 | 4.1%(+3.40)#2,635 |
| 46. | Barberton | 7.4% | 3.9%(+3.50)#46 | 4.1%(+3.31)#2,683 |
| 47. | High Bridge | 7.4% | 3.9%(+3.45)#47 | 4.1%(+3.26)#2,722 |
| 48. | Clyde Hill | 7.2% | 3.9%(+3.30)#48 | 4.1%(+3.10)#2,839 |
| 49. | Burien | 7.2% | 3.9%(+3.23)#49 | 4.1%(+3.03)#2,892 |
| 50. | Farmington | 7.1% | 3.9%(+3.20)#50 | 4.1%(+3.01)#2,936 |
| 51. | Seabeck | 7.1% | 3.9%(+3.18)#51 | 4.1%(+2.99)#2,943 |
| 52. | Brier | 7.1% | 3.9%(+3.17)#52 | 4.1%(+2.97)#2,950 |
| 53. | South Bend | 7.0% | 3.9%(+3.04)#53 | 4.1%(+2.85)#3,051 |
| 54. | Burbank | 6.9% | 3.9%(+3.00)#54 | 4.1%(+2.80)#3,088 |
| 55. | Port Orchard | 6.9% | 3.9%(+2.93)#55 | 4.1%(+2.74)#3,135 |
| 56. | Ferndale | 6.9% | 3.9%(+2.92)#56 | 4.1%(+2.73)#3,147 |
| 57. | Fircrest | 6.8% | 3.9%(+2.91)#57 | 4.1%(+2.71)#3,160 |
| 58. | Woodway | 6.7% | 3.9%(+2.76)#58 | 4.1%(+2.56)#3,307 |
| 59. | Tehaleh | 6.6% | 3.9%(+2.67)#59 | 4.1%(+2.48)#3,397 |
| 60. | Bunk Foss | 6.6% | 3.9%(+2.64)#60 | 4.1%(+2.44)#3,430 |
| 61. | Summit | 6.5% | 3.9%(+2.57)#61 | 4.1%(+2.38)#3,491 |
| 62. | Esperance | 6.5% | 3.9%(+2.52)#62 | 4.1%(+2.33)#3,529 |
| 63. | Navy Yard City | 6.4% | 3.9%(+2.49)#63 | 4.1%(+2.30)#3,564 |
| 64. | Newcastle | 6.4% | 3.9%(+2.49)#64 | 4.1%(+2.29)#3,573 |
| 65. | Maple Heights Lake Desire | 6.4% | 3.9%(+2.46)#65 | 4.1%(+2.27)#3,595 |
| 66. | Cashmere | 6.4% | 3.9%(+2.46)#66 | 4.1%(+2.26)#3,602 |
| 67. | Mount Vista | 6.4% | 3.9%(+2.42)#67 | 4.1%(+2.23)#3,629 |
| 68. | Asotin | 6.3% | 3.9%(+2.39)#68 | 4.1%(+2.19)#3,662 |
| 69. | Hockinson | 6.2% | 3.9%(+2.30)#69 | 4.1%(+2.10)#3,788 |
| 70. | Three Lakes | 6.2% | 3.9%(+2.22)#70 | 4.1%(+2.03)#3,848 |
| 71. | Country Homes | 6.1% | 3.9%(+2.16)#71 | 4.1%(+1.97)#3,917 |
| 72. | Arlington | 6.1% | 3.9%(+2.15)#72 | 4.1%(+1.95)#3,928 |
| 73. | Stansberry Lake | 6.0% | 3.9%(+2.11)#73 | 4.1%(+1.91)#3,984 |
| 74. | White Center | 6.0% | 3.9%(+2.06)#74 | 4.1%(+1.87)#4,031 |
| 75. | Vashon | 5.9% | 3.9%(+1.93)#75 | 4.1%(+1.74)#4,190 |
| 76. | Mountlake Terrace | 5.9% | 3.9%(+1.92)#76 | 4.1%(+1.73)#4,197 |
| 77. | Ephrata | 5.9% | 3.9%(+1.92)#77 | 4.1%(+1.73)#4,205 |
| 78. | Fox Island | 5.8% | 3.9%(+1.89)#78 | 4.1%(+1.70)#4,236 |
| 79. | Shoreline | 5.8% | 3.9%(+1.88)#79 | 4.1%(+1.69)#4,253 |
| 80. | Roche Harbor | 5.8% | 3.9%(+1.86)#80 | 4.1%(+1.66)#4,287 |
| 81. | Fife Heights | 5.7% | 3.9%(+1.79)#81 | 4.1%(+1.60)#4,361 |
| 82. | Medina | 5.6% | 3.9%(+1.68)#82 | 4.1%(+1.48)#4,514 |
| 83. | Colton | 5.6% | 3.9%(+1.67)#83 | 4.1%(+1.47)#4,531 |
| 84. | Ryderwood | 5.6% | 3.9%(+1.61)#84 | 4.1%(+1.42)#4,611 |
| 85. | La Conner | 5.5% | 3.9%(+1.60)#85 | 4.1%(+1.41)#4,641 |
| 86. | Mead | 5.5% | 3.9%(+1.59)#86 | 4.1%(+1.40)#4,647 |
| 87. | Chain Lake | 5.5% | 3.9%(+1.58)#87 | 4.1%(+1.38)#4,669 |
| 88. | Colfax | 5.4% | 3.9%(+1.51)#88 | 4.1%(+1.31)#4,775 |
| 89. | Bainbridge Island | 5.4% | 3.9%(+1.49)#89 | 4.1%(+1.30)#4,786 |
| 90. | Kingston | 5.4% | 3.9%(+1.46)#90 | 4.1%(+1.26)#4,842 |
| 91. | Mill Creek | 5.4% | 3.9%(+1.44)#91 | 4.1%(+1.25)#4,858 |
| 92. | Fairwood Cdp King County | 5.4% | 3.9%(+1.42)#92 | 4.1%(+1.23)#4,888 |
| 93. | Silver Firs | 5.3% | 3.9%(+1.40)#93 | 4.1%(+1.21)#4,914 |
| 94. | Five Corners | 5.2% | 3.9%(+1.28)#94 | 4.1%(+1.09)#5,105 |
| 95. | Geneva | 5.2% | 3.9%(+1.27)#95 | 4.1%(+1.08)#5,113 |
| 96. | Kayak Point | 5.2% | 3.9%(+1.27)#96 | 4.1%(+1.08)#5,115 |
| 97. | Ocean Shores | 5.2% | 3.9%(+1.22)#97 | 4.1%(+1.03)#5,183 |
| 98. | Fairwood Cdp Spokane County | 5.2% | 3.9%(+1.22)#98 | 4.1%(+1.03)#5,186 |
| 99. | Dash Point | 5.2% | 3.9%(+1.22)#99 | 4.1%(+1.03)#5,189 |
| 100. | Kenmore | 5.2% | 3.9%(+1.21)#100 | 4.1%(+1.02)#5,192 |
Common Questions
What are the Top 10 Cities with the Highest Percentage of Population with a Degree in Communications in Washington?
Top 10 Cities with the Highest Percentage of Population with a Degree in Communications in Washington are:
#1
26.3%
#2
23.8%
#3
23.5%
#4
23.3%
#5
22.5%
#6
21.9%
#7
20.3%
#8
20.0%
#9
19.7%
#10
17.5%
What city has the Highest Percentage of Population with a Degree in Communications in Washington?
Springdale has the Highest Percentage of Population with a Degree in Communications in Washington with 26.3%.
What is the Percentage of Population with a Degree in Communications in the State of Washington?
Percentage of Population with a Degree in Communications in Washington is 3.9%.
What is the Percentage of Population with a Degree in Communications in the United States?
Percentage of Population with a Degree in Communications in the United States is 4.1%.