Cities with the Highest Percentage of Luxembourger Population in Washington

RELATED REPORTS & OPTIONS

Luxembourger
Population
Families and Households
Female Fertility
Female Fertility (Unmarried)
Race (Community Size)
Race (Percentage)
Ancestry (Community Size)
AfghanAfricanAlaska NativeAlaskan AthabascanAlbanianAleutAlsatianAmericanApacheArabArapahoArgentineanArmenianAssyrian / Chaldean / SyriacAustralianAustrianBahamianBangladeshiBarbadianBasqueBelgianBelizeanBermudanBhutaneseBlackfeetBolivianBrazilianBritishBritish West IndianBulgarianBurmeseCajunCambodianCanadianCape VerdeanCarpatho RusynCelticCentral AmericanCentral American IndianCherokeeCheyenneChickasawChileanChineseChippewaChoctawColombianColvilleComancheCosta RicanCreeCreekCroatianCrowCubanCypriotCzechCzechoslovakianDanishDelawareDominicanDutchDutch West IndianEastern EuropeanEcuadorianEgyptianEnglishEstonianEthiopianEuropeanFijianFilipinoFinnishFrenchFrench American IndianFrench CanadianGermanGerman RussianGhanaianGreekGuamanian / ChamorroGuatemalanGuyaneseHaitianHmongHonduranHopiHoumaHungarianIcelanderIndian (Asian)IndonesianInupiatIranianIraqiIrishIroquoisIsraeliItalianJamaicanJapaneseJordanianKenyanKiowaKoreanLaotianLatvianLebaneseLiberianLithuanianLumbeeLuxembourgerMacedonianMalaysianMalteseMarshalleseMenomineeMexicanMexican American IndianMongolianMoroccanNative HawaiianNavajoNepaleseNew ZealanderNicaraguanNigerianNorthern EuropeanNorwegianOkinawanOsageOttawaPaiutePakistaniPalestinianPanamanianParaguayanPennsylvania GermanPeruvianPimaPolishPortuguesePotawatomiPuebloPuerto RicanPuget Sound SalishRomanianRussianSalvadoranSamoanScandinavianScotch-IrishScottishSeminoleSenegaleseSerbianShoshoneSierra LeoneanSiouxSlavicSlovakSloveneSomaliSouth AfricanSouth AmericanSouth American IndianSoviet UnionSpaniardSpanishSpanish AmericanSpanish American IndianSri LankanSubsaharan AfricanSudaneseSwedishSwissSyrianTaiwaneseThaiTlingit-HaidaTohono O'OdhamTonganTrinidadian and TobagonianTsimshianTurkishU.S. Virgin IslanderUgandanUkrainianUruguayanUteVenezuelanVietnameseWelshWest IndianYakamaYaquiYugoslavianYumanYup'ikZimbabwean
Ancestry (Percentage)
AfghanAfricanAlaska NativeAlaskan AthabascanAlbanianAleutAlsatianAmericanApacheArabArapahoArgentineanArmenianAssyrian / Chaldean / SyriacAustralianAustrianBahamianBangladeshiBarbadianBasqueBelgianBelizeanBermudanBhutaneseBlackfeetBolivianBrazilianBritishBritish West IndianBulgarianBurmeseCajunCambodianCanadianCape VerdeanCarpatho RusynCelticCentral AmericanCentral American IndianCherokeeCheyenneChickasawChileanChineseChippewaChoctawColombianColvilleComancheCosta RicanCreeCreekCroatianCrowCubanCypriotCzechCzechoslovakianDanishDelawareDominicanDutchDutch West IndianEastern EuropeanEcuadorianEgyptianEnglishEstonianEthiopianEuropeanFijianFilipinoFinnishFrenchFrench American IndianFrench CanadianGermanGerman RussianGhanaianGreekGuamanian / ChamorroGuatemalanGuyaneseHaitianHmongHonduranHopiHoumaHungarianIcelanderIndian (Asian)IndonesianInupiatIranianIraqiIrishIroquoisIsraeliItalianJamaicanJapaneseJordanianKenyanKiowaKoreanLaotianLatvianLebaneseLiberianLithuanianLumbeeLuxembourgerMacedonianMalaysianMalteseMarshalleseMenomineeMexicanMexican American IndianMongolianMoroccanNative HawaiianNavajoNepaleseNew ZealanderNicaraguanNigerianNorthern EuropeanNorwegianOkinawanOsageOttawaPaiutePakistaniPalestinianPanamanianParaguayanPennsylvania GermanPeruvianPimaPolishPortuguesePotawatomiPuebloPuerto RicanPuget Sound SalishRomanianRussianSalvadoranSamoanScandinavianScotch-IrishScottishSeminoleSenegaleseSerbianShoshoneSierra LeoneanSiouxSlavicSlovakSloveneSomaliSouth AfricanSouth AmericanSouth American IndianSoviet UnionSpaniardSpanishSpanish AmericanSpanish American IndianSri LankanSubsaharan AfricanSudaneseSwedishSwissSyrianTaiwaneseThaiTlingit-HaidaTohono O'OdhamTonganTrinidadian and TobagonianTsimshianTurkishU.S. Virgin IslanderUgandanUkrainianUruguayanUteVenezuelanVietnameseWelshWest IndianYakamaYaquiYugoslavianYumanYup'ikZimbabwean
Immigrant Origin (Total)
AfghanistanAfricaAlbaniaArgentinaArmeniaAsiaAustraliaAustriaAzoresBahamasBangladeshBarbadosBelarusBelgiumBelizeBoliviaBosnia and HerzegovinaBrazilBulgariaBurma / MyanmarCabo VerdeCambodiaCameroonCanadaCaribbeanCentral AmericaChileChinaColombiaCongoCosta RicaCroatiaCubaCzechoslovakiaDenmarkDominicaDominican RepublicEastern AfricaEastern AsiaEastern EuropeEcuadorEgyptEl SalvadorEnglandEritreaEthiopiaEuropeFijiFranceGermanyGhanaGreeceGrenadaGuatemalaGuyanaHaitiHondurasHong KongHungaryIndiaIndonesiaIranIraqIrelandIsraelItalyJamaicaJapanJordanKazakhstanKenyaKoreaKuwaitLaosLatin AmericaLatviaLebanonLiberiaLithuaniaMalaysiaMexicoMicronesiaMiddle AfricaMoldovaMoroccoNepalNetherlandsNicaraguaNigeriaNorth MacedoniaNorthern AfricaNorthern EuropeNorwayOceaniaPakistanPanamaPeruPhilippinesPolandPortugalRomaniaRussiaSaudi ArabiaScotlandSenegalSerbiaSierra LeoneSingaporeSomaliaSouth AfricaSouth AmericaSouth Central AsiaSouth Eastern AsiaSouthern EuropeSpainSri LankaSt. Vincent and the GrenadinesSudanSwedenSwitzerlandSyriaTaiwanThailandTrinidad and TobagoTurkeyUgandaUkraineUruguayUzbekistanVenezuelaVietnamWest IndiesWestern AfricaWestern AsiaWestern EuropeYemenZaireZimbabwe
Immigrant Origin (Percentage)
AfghanistanAfricaAlbaniaArgentinaArmeniaAsiaAustraliaAustriaAzoresBahamasBangladeshBarbadosBelarusBelgiumBelizeBoliviaBosnia and HerzegovinaBrazilBulgariaBurma / MyanmarCabo VerdeCambodiaCameroonCanadaCaribbeanCentral AmericaChileChinaColombiaCongoCosta RicaCroatiaCubaCzechoslovakiaDenmarkDominicaDominican RepublicEastern AfricaEastern AsiaEastern EuropeEcuadorEgyptEl SalvadorEnglandEritreaEthiopiaEuropeFijiFranceGermanyGhanaGreeceGrenadaGuatemalaGuyanaHaitiHondurasHong KongHungaryIndiaIndonesiaIranIraqIrelandIsraelItalyJamaicaJapanJordanKazakhstanKenyaKoreaKuwaitLaosLatin AmericaLatviaLebanonLiberiaLithuaniaMalaysiaMexicoMicronesiaMiddle AfricaMoldovaMoroccoNepalNetherlandsNicaraguaNigeriaNorth MacedoniaNorthern AfricaNorthern EuropeNorwayOceaniaPakistanPanamaPeruPhilippinesPolandPortugalRomaniaRussiaSaudi ArabiaScotlandSenegalSerbiaSierra LeoneSingaporeSomaliaSouth AfricaSouth AmericaSouth Central AsiaSouth Eastern AsiaSouthern EuropeSpainSri LankaSt. Vincent and the GrenadinesSudanSwedenSwitzerlandSyriaTaiwanThailandTrinidad and TobagoTurkeyUgandaUkraineUruguayUzbekistanVenezuelaVietnamWest IndiesWestern AfricaWestern AsiaWestern EuropeYemenZaireZimbabwe
Income
Income (Families)
Income (Households)
Poverty
Poverty (Families)
Unemployment
Employment Occupations
Employment Industries
Employer Class
Commute Time
Commute Means
School Enrollment
Education by Degree Field
Occupancy
Finances
Physical Characteristics
Washington
Compare Cities
Comparison Subject

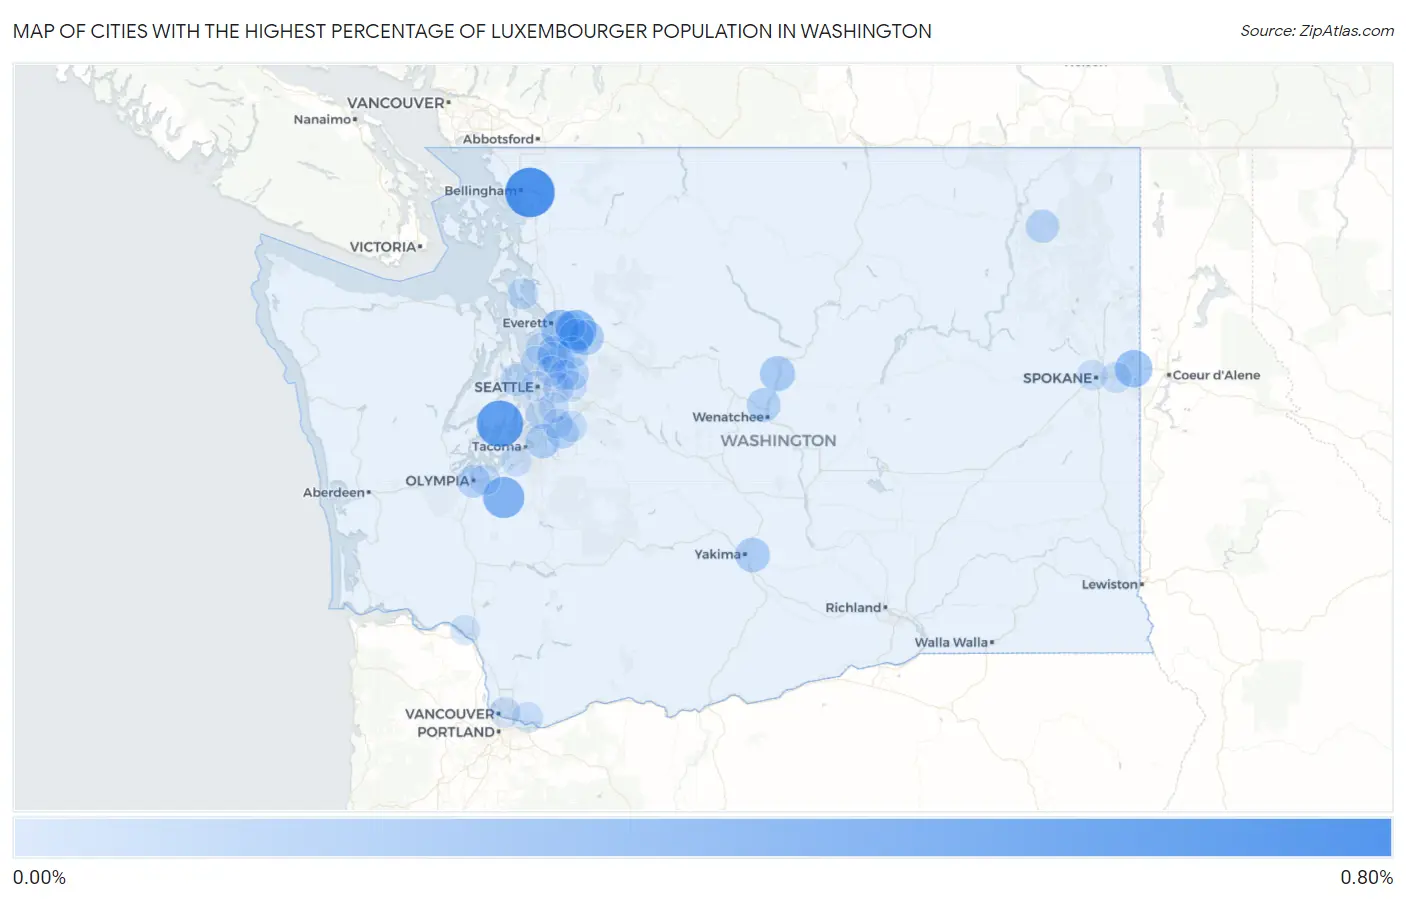
Map of Cities with the Highest Percentage of Luxembourger Population in Washington

0.00%
0.80%
Cities with the Highest Percentage of Luxembourger Population in Washington Map

Cities with the Highest Percentage of Luxembourger Population in Washington

City Luxembourger vs State vs National
1.Geneva0.76%0.012%(+0.752)#10.013%(+0.751)#155
2.Wauna0.64%0.012%(+0.628)#20.013%(+0.627)#190
3.Yelm0.43%0.012%(+0.419)#30.013%(+0.418)#263
4.Three Lakes0.39%0.012%(+0.380)#40.013%(+0.379)#286
5.Fobes Hill0.30%0.012%(+0.293)#50.013%(+0.292)#370
6.Otis Orchards East Farms0.28%0.012%(+0.269)#60.013%(+0.268)#394
7.Entiat0.19%0.012%(+0.181)#70.013%(+0.180)#532
8.Woods Creek0.18%0.012%(+0.173)#80.013%(+0.172)#546
9.Chain Lake0.18%0.012%(+0.164)#90.013%(+0.163)#565
10.Terrace Heights0.17%0.012%(+0.162)#100.013%(+0.161)#567
11.Lakeland South0.16%0.012%(+0.147)#110.013%(+0.146)#594
12.Sunnyslope0.14%0.012%(+0.129)#120.013%(+0.128)#643
13.Colville0.12%0.012%(+0.110)#130.013%(+0.109)#684
14.Olympia0.11%0.012%(+0.099)#140.013%(+0.098)#703
15.Bothell East0.11%0.012%(+0.096)#150.013%(+0.095)#710
16.Union Hill Novelty Hill0.10%0.012%(+0.092)#160.013%(+0.091)#720
17.Fairwood Cdp King County0.097%0.012%(+0.085)#170.013%(+0.084)#741
18.Woodinville0.083%0.012%(+0.071)#180.013%(+0.070)#790
19.Lake Morton Berrydale0.077%0.012%(+0.065)#190.013%(+0.064)#807
20.High Bridge0.070%0.012%(+0.058)#200.013%(+0.057)#833
21.Bainbridge Island0.069%0.012%(+0.057)#210.013%(+0.056)#842
22.Lynnwood0.063%0.012%(+0.051)#220.013%(+0.050)#870
23.Camano0.051%0.012%(+0.039)#230.013%(+0.038)#935
24.Maple Valley0.047%0.012%(+0.035)#240.013%(+0.034)#951
25.Spokane Valley0.031%0.012%(+0.019)#250.013%(+0.018)#1,049
26.Camas0.030%0.012%(+0.019)#260.013%(+0.018)#1,056
27.Lacey0.028%0.012%(+0.017)#270.013%(+0.016)#1,070
28.Everett0.028%0.012%(+0.016)#280.013%(+0.015)#1,074
29.Bothell0.027%0.012%(+0.015)#290.013%(+0.014)#1,083
30.Sammamish0.027%0.012%(+0.015)#300.013%(+0.014)#1,085
31.Vancouver0.026%0.012%(+0.015)#310.013%(+0.014)#1,091
32.Seatac0.026%0.012%(+0.014)#320.013%(+0.013)#1,093
33.Spokane0.022%0.012%(+0.010)#330.013%(+0.009)#1,130
34.Redmond0.018%0.012%(+0.006)#340.013%(+0.005)#1,176
35.Bellevue0.017%0.012%(+0.006)#350.013%(+0.005)#1,180
36.Renton0.017%0.012%(+0.005)#360.013%(+0.004)#1,183
37.Shoreline0.017%0.012%(+0.005)#370.013%(+0.004)#1,185
38.Kirkland0.016%0.012%(+0.005)#380.013%(+0.004)#1,195
39.Lakewood0.013%0.012%(+0.001)#390.013%(-0.000)#1,234
40.Seattle0.0094%0.012%(-0.002)#400.013%(-0.003)#1,280
41.Longview0.0080%0.012%(-0.004)#410.013%(-0.005)#1,298
42.Kent0.0059%0.012%(-0.006)#420.013%(-0.007)#1,319

Common Questions

What are the Top 10 Cities with the Highest Percentage of Luxembourger Population in Washington?
Top 10 Cities with the Highest Percentage of Luxembourger Population in Washington are:
#1
0.76%
#2
0.64%
#3
0.43%
#4
0.39%
#5
0.30%
#6
0.28%
#7
0.19%
#8
0.18%
#9
0.18%
#10
0.17%
What city has the Highest Percentage of Luxembourger Population in Washington?
Geneva has the Highest Percentage of Luxembourger Population in Washington with 0.76%.
What is the Percentage of Luxembourger Population in the State of Washington?
Percentage of Luxembourger Population in Washington is 0.012%.
What is the Percentage of Luxembourger Population in the United States?
Percentage of Luxembourger Population in the United States is 0.013%.