Cities with the Highest Percentage of Immigrants from Peru in Washington
RELATED REPORTS & OPTIONS
Peru
Washington
Compare Cities
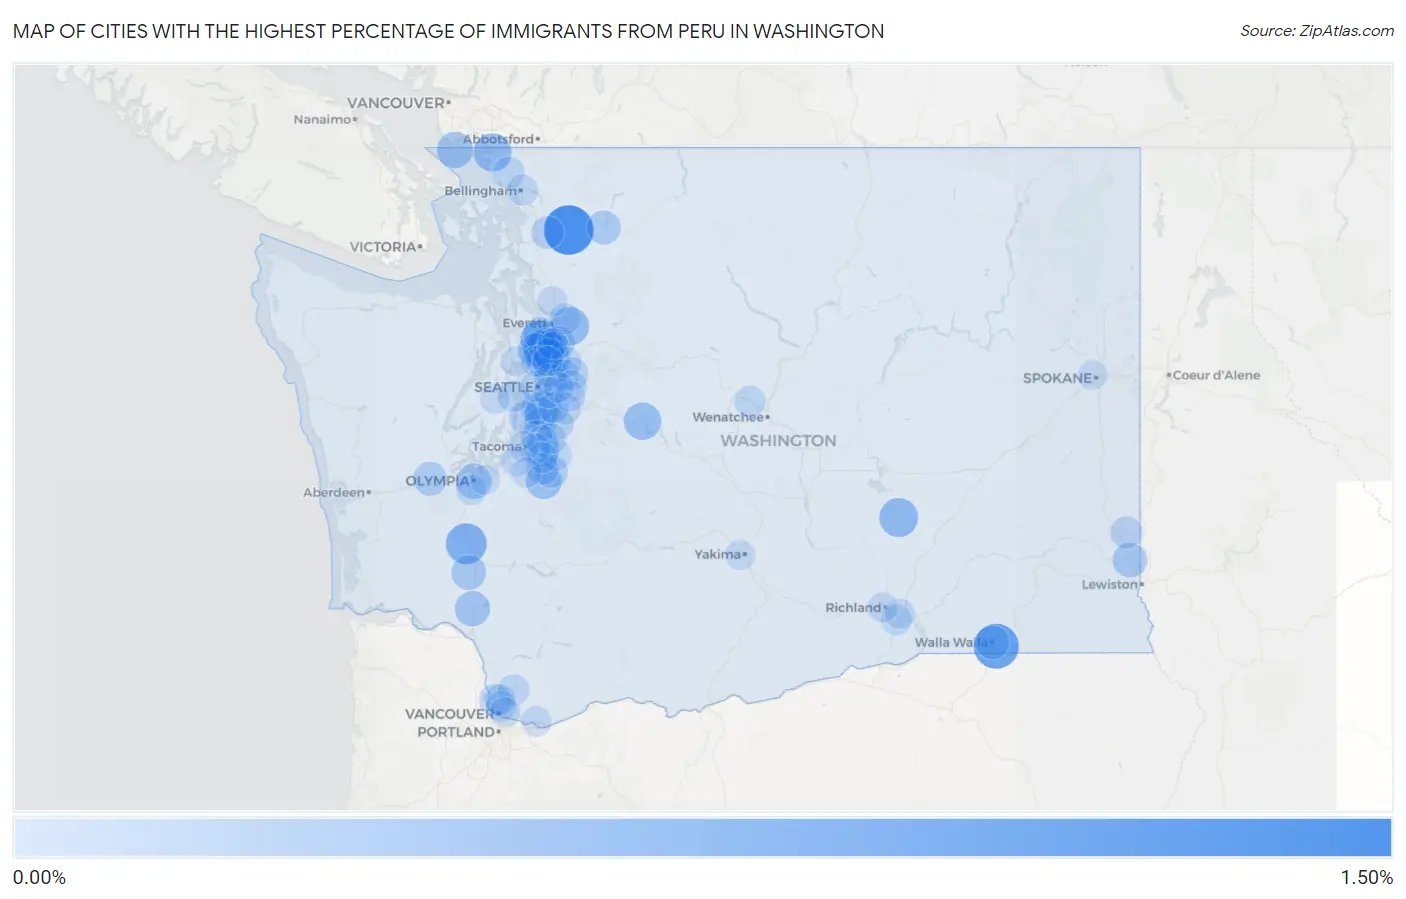
Map of Cities with the Highest Percentage of Immigrants from Peru in Washington
0.00%
1.50%
Cities with the Highest Percentage of Immigrants from Peru in Washington
| City | Peru | vs State | vs National | |
| 1. | Lyman | 1.30% | 0.064%(+1.23)#-1 | 0.14%(+1.16)#0 |
| 2. | Walla Walla East | 0.99% | 0.064%(+0.922)#0 | 0.14%(+0.846)#1 |
| 3. | Chehalis | 0.71% | 0.064%(+0.642)#1 | 0.14%(+0.566)#2 |
| 4. | Alderwood Manor | 0.67% | 0.064%(+0.611)#2 | 0.14%(+0.535)#3 |
| 5. | Picnic Point | 0.60% | 0.064%(+0.539)#3 | 0.14%(+0.464)#4 |
| 6. | Othello | 0.57% | 0.064%(+0.507)#4 | 0.14%(+0.432)#5 |
| 7. | Blaine | 0.53% | 0.064%(+0.465)#5 | 0.14%(+0.389)#6 |
| 8. | Everett | 0.53% | 0.064%(+0.462)#6 | 0.14%(+0.387)#7 |
| 9. | Snoqualmie Pass | 0.48% | 0.064%(+0.412)#7 | 0.14%(+0.337)#8 |
| 10. | Larch Way | 0.45% | 0.064%(+0.391)#8 | 0.14%(+0.315)#9 |
| 11. | Lynnwood | 0.43% | 0.064%(+0.365)#9 | 0.14%(+0.290)#10 |
| 12. | Point Roberts | 0.40% | 0.064%(+0.336)#10 | 0.14%(+0.261)#11 |
| 13. | Graham | 0.39% | 0.064%(+0.321)#35 | 0.14%(+0.246)#1,217 |
| 14. | Olympia | 0.36% | 0.064%(+0.291)#36 | 0.14%(+0.216)#1,218 |
| 15. | Bothell | 0.35% | 0.064%(+0.287)#37 | 0.14%(+0.211)#1,219 |
| 16. | Castle Rock | 0.34% | 0.064%(+0.279)#38 | 0.14%(+0.204)#1,220 |
| 17. | Tukwila | 0.33% | 0.064%(+0.265)#39 | 0.14%(+0.190)#1,221 |
| 18. | Winlock | 0.31% | 0.064%(+0.243)#40 | 0.14%(+0.167)#1,222 |
| 19. | Colton | 0.29% | 0.064%(+0.230)#41 | 0.14%(+0.155)#1,223 |
| 20. | Fairwood Cdp King County | 0.28% | 0.064%(+0.215)#42 | 0.14%(+0.140)#1,224 |
| 21. | Concrete | 0.25% | 0.064%(+0.189)#43 | 0.14%(+0.113)#1,225 |
| 22. | Edgewood | 0.25% | 0.064%(+0.186)#44 | 0.14%(+0.111)#1,436 |
| 23. | Walla Walla | 0.25% | 0.064%(+0.184)#45 | 0.14%(+0.109)#1,437 |
| 24. | Mccleary | 0.25% | 0.064%(+0.183)#46 | 0.14%(+0.108)#1,438 |
| 25. | Edmonds | 0.23% | 0.064%(+0.170)#47 | 0.14%(+0.095)#1,439 |
| 26. | Mukilteo | 0.21% | 0.064%(+0.147)#48 | 0.14%(+0.071)#1,440 |
| 27. | Orting | 0.20% | 0.064%(+0.138)#49 | 0.14%(+0.063)#1,441 |
| 28. | Seatac | 0.20% | 0.064%(+0.133)#50 | 0.14%(+0.058)#1,442 |
| 29. | Kirkland | 0.17% | 0.064%(+0.110)#51 | 0.14%(+0.035)#1,443 |
| 30. | Lake Forest Park | 0.17% | 0.064%(+0.107)#52 | 0.14%(+0.032)#1,444 |
| 31. | Sedro Woolley | 0.17% | 0.064%(+0.104)#53 | 0.14%(+0.029)#1,445 |
| 32. | Silver Firs | 0.17% | 0.064%(+0.103)#54 | 0.14%(+0.027)#1,446 |
| 33. | Yarrow Point | 0.16% | 0.064%(+0.092)#55 | 0.14%(+0.017)#1,447 |
| 34. | Vashon | 0.16% | 0.064%(+0.091)#56 | 0.14%(+0.016)#1,448 |
| 35. | Union Hill Novelty Hill | 0.15% | 0.064%(+0.087)#57 | 0.14%(+0.012)#1,449 |
| 36. | South Hill | 0.14% | 0.064%(+0.081)#58 | 0.14%(+0.005)#1,450 |
| 37. | Des Moines | 0.13% | 0.064%(+0.071)#59 | 0.14%(-0.005)#1,451 |
| 38. | Pullman | 0.13% | 0.064%(+0.071)#60 | 0.14%(-0.005)#1,452 |
| 39. | Felida | 0.13% | 0.064%(+0.069)#61 | 0.14%(-0.006)#1,453 |
| 40. | Kent | 0.13% | 0.064%(+0.063)#62 | 0.14%(-0.013)#1,454 |
| 41. | Mill Creek East | 0.13% | 0.064%(+0.063)#63 | 0.14%(-0.013)#1,455 |
| 42. | Burien | 0.12% | 0.064%(+0.058)#64 | 0.14%(-0.017)#1,456 |
| 43. | Ferndale | 0.11% | 0.064%(+0.048)#65 | 0.14%(-0.027)#1,457 |
| 44. | Federal Way | 0.11% | 0.064%(+0.048)#66 | 0.14%(-0.028)#1,458 |
| 45. | Manchester | 0.099% | 0.064%(+0.036)#67 | 0.14%(-0.040)#1,459 |
| 46. | East Renton Highlands | 0.099% | 0.064%(+0.035)#68 | 0.14%(-0.040)#1,460 |
| 47. | Lakeland South | 0.095% | 0.064%(+0.031)#69 | 0.14%(-0.044)#1,461 |
| 48. | Cashmere | 0.092% | 0.064%(+0.029)#70 | 0.14%(-0.047)#1,462 |
| 49. | Redmond | 0.092% | 0.064%(+0.028)#71 | 0.14%(-0.047)#1,463 |
| 50. | Battle Ground | 0.091% | 0.064%(+0.027)#72 | 0.14%(-0.048)#1,464 |
| 51. | Seattle | 0.088% | 0.064%(+0.024)#73 | 0.14%(-0.052)#1,465 |
| 52. | Sammamish | 0.084% | 0.064%(+0.020)#74 | 0.14%(-0.055)#1,466 |
| 53. | Mercer Island | 0.079% | 0.064%(+0.015)#75 | 0.14%(-0.061)#1,467 |
| 54. | Cottage Lake | 0.077% | 0.064%(+0.014)#76 | 0.14%(-0.062)#1,468 |
| 55. | Lake Stevens | 0.077% | 0.064%(+0.013)#77 | 0.14%(-0.062)#1,469 |
| 56. | Renton | 0.076% | 0.064%(+0.012)#78 | 0.14%(-0.063)#1,470 |
| 57. | Bonney Lake | 0.075% | 0.064%(+0.011)#79 | 0.14%(-0.064)#1,471 |
| 58. | Fife | 0.073% | 0.064%(+0.010)#80 | 0.14%(-0.066)#1,472 |
| 59. | Bellingham | 0.070% | 0.064%(+0.006)#81 | 0.14%(-0.069)#1,473 |
| 60. | Kennewick | 0.067% | 0.064%(+0.003)#82 | 0.14%(-0.073)#1,474 |
| 61. | Hazel Dell | 0.066% | 0.064%(+0.002)#83 | 0.14%(-0.073)#1,475 |
| 62. | Shoreline | 0.060% | 0.064%(-0.004)#84 | 0.14%(-0.080)#1,476 |
| 63. | Auburn | 0.060% | 0.064%(-0.004)#85 | 0.14%(-0.080)#1,477 |
| 64. | Puyallup | 0.059% | 0.064%(-0.005)#86 | 0.14%(-0.081)#1,478 |
| 65. | Bothell West | 0.058% | 0.064%(-0.005)#87 | 0.14%(-0.081)#1,479 |
| 66. | Salmon Creek | 0.054% | 0.064%(-0.010)#88 | 0.14%(-0.085)#1,480 |
| 67. | Tacoma | 0.045% | 0.064%(-0.019)#89 | 0.14%(-0.095)#1,481 |
| 68. | Issaquah | 0.043% | 0.064%(-0.021)#90 | 0.14%(-0.096)#1,482 |
| 69. | Washougal | 0.042% | 0.064%(-0.022)#91 | 0.14%(-0.098)#1,483 |
| 70. | Mill Creek | 0.038% | 0.064%(-0.025)#92 | 0.14%(-0.101)#1,484 |
| 71. | Vancouver | 0.031% | 0.064%(-0.032)#93 | 0.14%(-0.108)#1,602 |
| 72. | Lakewood | 0.029% | 0.064%(-0.035)#94 | 0.14%(-0.111)#1,603 |
| 73. | Marysville | 0.028% | 0.064%(-0.036)#95 | 0.14%(-0.111)#1,604 |
| 74. | Indianola | 0.028% | 0.064%(-0.036)#96 | 0.14%(-0.111)#1,605 |
| 75. | Tumwater | 0.027% | 0.064%(-0.037)#97 | 0.14%(-0.112)#1,606 |
| 76. | Pasco | 0.027% | 0.064%(-0.037)#98 | 0.14%(-0.112)#1,607 |
| 77. | Bellevue | 0.025% | 0.064%(-0.039)#99 | 0.14%(-0.115)#1,608 |
| 78. | Spanaway | 0.024% | 0.064%(-0.040)#100 | 0.14%(-0.116)#1,609 |
| 79. | Richland | 0.015% | 0.064%(-0.049)#101 | 0.14%(-0.125)#1,610 |
| 80. | Bremerton | 0.014% | 0.064%(-0.050)#102 | 0.14%(-0.126)#1,611 |
| 81. | Yakima | 0.013% | 0.064%(-0.050)#103 | 0.14%(-0.126)#1,612 |
| 82. | Kenmore | 0.013% | 0.064%(-0.051)#104 | 0.14%(-0.127)#1,613 |
| 83. | Spokane | 0.0061% | 0.064%(-0.058)#105 | 0.14%(-0.133)#1,614 |
| 84. | Lacey | 0.0036% | 0.064%(-0.060)#106 | 0.14%(-0.136)#1,615 |
Common Questions
What are the Top 10 Cities with the Highest Percentage of Immigrants from Peru in Washington?
Top 10 Cities with the Highest Percentage of Immigrants from Peru in Washington are:
#1
1.30%
#2
0.99%
#3
0.71%
#4
0.67%
#5
0.60%
#6
0.57%
#7
0.53%
#8
0.53%
#9
0.48%
#10
0.45%
What city has the Highest Percentage of Immigrants from Peru in Washington?
Lyman has the Highest Percentage of Immigrants from Peru in Washington with 1.30%.
What is the Percentage of Immigrants from Peru in the State of Washington?
Percentage of Immigrants from Peru in Washington is 0.064%.
What is the Percentage of Immigrants from Peru in the United States?
Percentage of Immigrants from Peru in the United States is 0.14%.