Cities with the Highest Percentage of German Population in Washington
RELATED REPORTS & OPTIONS
German
Washington
Compare Cities
Map of Cities with the Highest Percentage of German Population in Washington
0.00%
100.00%
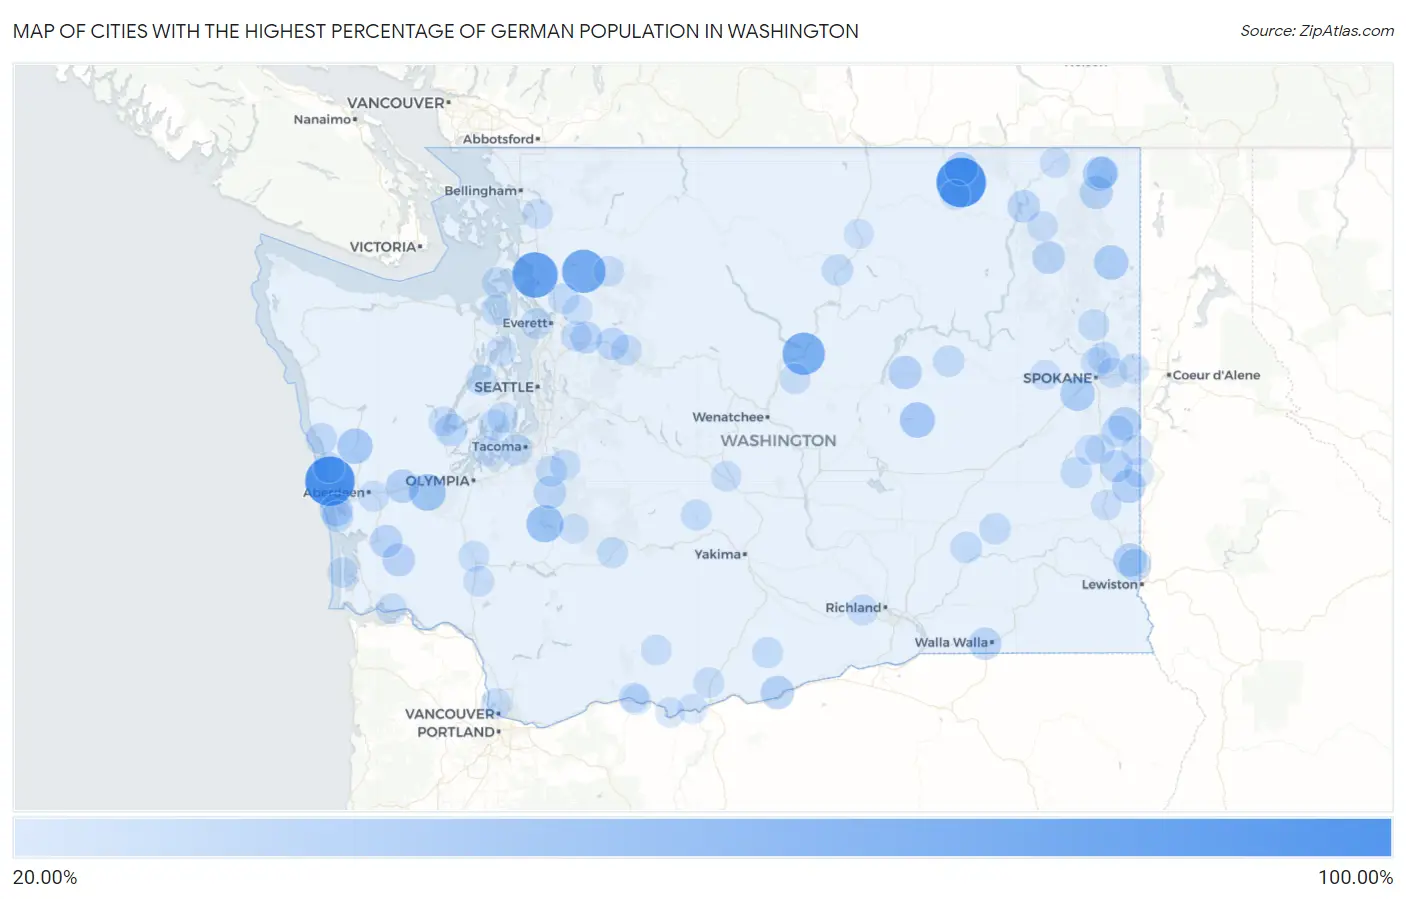
Cities with the Highest Percentage of German Population in Washington
| City | German | vs State | vs National | |
| 1. | Malo | 100.00% | 14.99% (+85.0)#1 | 12.66% (+87.3)#40 |
| 2. | Hogans Corner | 100.00% | 14.99% (+85.0)#2 | 12.66% (+87.3)#81 |
| 3. | Northwest Stanwood | 84.00% | 14.99% (+69.0)#3 | 12.66% (+71.3)#129 |
| 4. | Oso | 75.08% | 14.99% (+60.1)#4 | 12.66% (+62.4)#203 |
| 5. | Chelan Falls | 70.75% | 14.99% (+55.8)#5 | 12.66% (+58.1)#258 |
| 6. | Alder | 50.00% | 14.99% (+35.0)#6 | 12.66% (+37.3)#1,287 |
| 7. | Malone | 47.51% | 14.99% (+32.5)#7 | 12.66% (+34.8)#1,631 |
| 8. | Wheeler | 46.61% | 14.99% (+31.6)#8 | 12.66% (+33.9)#1,773 |
| 9. | Krupp Marlin | 43.59% | 14.99% (+28.6)#9 | 12.66% (+30.9)#2,284 |
| 10. | Humptulips | 43.27% | 14.99% (+28.3)#10 | 12.66% (+30.6)#2,357 |
| 11. | Cusick | 40.00% | 14.99% (+25.0)#11 | 12.66% (+27.3)#3,019 |
| 12. | Four Lakes | 39.54% | 14.99% (+24.5)#12 | 12.66% (+26.9)#3,119 |
| 13. | Metaline | 38.52% | 14.99% (+23.5)#13 | 12.66% (+25.9)#3,368 |
| 14. | Garfield | 36.18% | 14.99% (+21.2)#14 | 12.66% (+23.5)#3,974 |
| 15. | Hartline | 36.14% | 14.99% (+21.1)#15 | 12.66% (+23.5)#3,983 |
| 16. | Brady | 36.07% | 14.99% (+21.1)#16 | 12.66% (+23.4)#4,006 |
| 17. | Roosevelt | 35.94% | 14.99% (+20.9)#17 | 12.66% (+23.3)#4,031 |
| 18. | Colton | 35.88% | 14.99% (+20.9)#18 | 12.66% (+23.2)#4,049 |
| 19. | Fairfield | 35.67% | 14.99% (+20.7)#19 | 12.66% (+23.0)#4,107 |
| 20. | Curlew | 35.19% | 14.99% (+20.2)#20 | 12.66% (+22.5)#4,248 |
| 21. | Ione | 35.09% | 14.99% (+20.1)#21 | 12.66% (+22.4)#4,271 |
| 22. | Cohassett Beach | 34.36% | 14.99% (+19.4)#22 | 12.66% (+21.7)#4,487 |
| 23. | Lebam | 33.93% | 14.99% (+18.9)#23 | 12.66% (+21.3)#4,647 |
| 24. | Addy | 33.33% | 14.99% (+18.3)#24 | 12.66% (+20.7)#4,839 |
| 25. | Willapa | 33.15% | 14.99% (+18.2)#25 | 12.66% (+20.5)#4,896 |
| 26. | Kapowsin | 32.80% | 14.99% (+17.8)#26 | 12.66% (+20.1)#5,008 |
| 27. | Union | 32.76% | 14.99% (+17.8)#27 | 12.66% (+20.1)#5,020 |
| 28. | Garrett | 32.62% | 14.99% (+17.6)#28 | 12.66% (+20.0)#5,079 |
| 29. | Marcus | 32.42% | 14.99% (+17.4)#29 | 12.66% (+19.8)#5,153 |
| 30. | Oakesdale | 32.08% | 14.99% (+17.1)#30 | 12.66% (+19.4)#5,293 |
| 31. | Uniontown | 32.04% | 14.99% (+17.0)#31 | 12.66% (+19.4)#5,311 |
| 32. | Clear Lake Cdp Pierce County | 31.81% | 14.99% (+16.8)#32 | 12.66% (+19.1)#5,401 |
| 33. | May Creek | 31.62% | 14.99% (+16.6)#33 | 12.66% (+19.0)#5,460 |
| 34. | Woods Creek | 30.70% | 14.99% (+15.7)#34 | 12.66% (+18.0)#5,791 |
| 35. | Metaline Falls | 30.38% | 14.99% (+15.4)#35 | 12.66% (+17.7)#5,916 |
| 36. | Sunland Estates | 30.00% | 14.99% (+15.0)#36 | 12.66% (+17.3)#6,059 |
| 37. | Waverly | 29.82% | 14.99% (+14.8)#37 | 12.66% (+17.2)#6,132 |
| 38. | Mead | 29.48% | 14.99% (+14.5)#38 | 12.66% (+16.8)#6,276 |
| 39. | Santiago | 29.33% | 14.99% (+14.3)#39 | 12.66% (+16.7)#6,337 |
| 40. | Kahlotus | 29.10% | 14.99% (+14.1)#40 | 12.66% (+16.4)#6,427 |
| 41. | Wilbur | 29.05% | 14.99% (+14.1)#41 | 12.66% (+16.4)#6,455 |
| 42. | Washtucna | 28.98% | 14.99% (+14.0)#42 | 12.66% (+16.3)#6,483 |
| 43. | Malott | 28.91% | 14.99% (+13.9)#43 | 12.66% (+16.2)#6,516 |
| 44. | Clear Lake Cdp Skagit County | 28.81% | 14.99% (+13.8)#44 | 12.66% (+16.2)#6,562 |
| 45. | Grayland | 28.70% | 14.99% (+13.7)#45 | 12.66% (+16.0)#6,603 |
| 46. | Fircrest | 28.52% | 14.99% (+13.5)#46 | 12.66% (+15.9)#6,709 |
| 47. | Deer Park | 28.45% | 14.99% (+13.5)#47 | 12.66% (+15.8)#6,735 |
| 48. | Lexington | 28.16% | 14.99% (+13.2)#48 | 12.66% (+15.5)#6,849 |
| 49. | St John | 28.10% | 14.99% (+13.1)#49 | 12.66% (+15.4)#6,873 |
| 50. | Stansberry Lake | 27.79% | 14.99% (+12.8)#50 | 12.66% (+15.1)#6,999 |
| 51. | Sisco Heights | 27.19% | 14.99% (+12.2)#51 | 12.66% (+14.5)#7,262 |
| 52. | Seabeck | 27.06% | 14.99% (+12.1)#52 | 12.66% (+14.4)#7,322 |
| 53. | Copalis Beach | 26.96% | 14.99% (+12.0)#53 | 12.66% (+14.3)#7,363 |
| 54. | Nile | 26.96% | 14.99% (+12.0)#54 | 12.66% (+14.3)#7,371 |
| 55. | Bickleton | 26.92% | 14.99% (+11.9)#55 | 12.66% (+14.3)#7,389 |
| 56. | Orting | 26.85% | 14.99% (+11.9)#56 | 12.66% (+14.2)#7,417 |
| 57. | Coupeville | 26.81% | 14.99% (+11.8)#57 | 12.66% (+14.2)#7,429 |
| 58. | Marrowstone | 26.76% | 14.99% (+11.8)#58 | 12.66% (+14.1)#7,450 |
| 59. | Packwood | 26.72% | 14.99% (+11.7)#59 | 12.66% (+14.1)#7,464 |
| 60. | Napavine | 26.71% | 14.99% (+11.7)#60 | 12.66% (+14.0)#7,475 |
| 61. | Clinton | 26.61% | 14.99% (+11.6)#61 | 12.66% (+13.9)#7,529 |
| 62. | Toledo | 26.58% | 14.99% (+11.6)#62 | 12.66% (+13.9)#7,541 |
| 63. | Index | 26.52% | 14.99% (+11.5)#63 | 12.66% (+13.9)#7,563 |
| 64. | Altoona | 26.42% | 14.99% (+11.4)#64 | 12.66% (+13.8)#7,607 |
| 65. | Glenwood | 26.36% | 14.99% (+11.4)#65 | 12.66% (+13.7)#7,629 |
| 66. | Cosmopolis | 26.25% | 14.99% (+11.3)#66 | 12.66% (+13.6)#7,679 |
| 67. | Burley | 26.21% | 14.99% (+11.2)#67 | 12.66% (+13.6)#7,696 |
| 68. | Benton City | 26.13% | 14.99% (+11.1)#68 | 12.66% (+13.5)#7,729 |
| 69. | South Prairie | 26.06% | 14.99% (+11.1)#69 | 12.66% (+13.4)#7,769 |
| 70. | Lake Shore | 25.90% | 14.99% (+10.9)#70 | 12.66% (+13.2)#7,846 |
| 71. | Goldendale | 25.84% | 14.99% (+10.8)#71 | 12.66% (+13.2)#7,875 |
| 72. | Waterville | 25.67% | 14.99% (+10.7)#72 | 12.66% (+13.0)#7,949 |
| 73. | Chain Lake | 25.56% | 14.99% (+10.6)#73 | 12.66% (+12.9)#7,992 |
| 74. | Thorp | 25.56% | 14.99% (+10.6)#74 | 12.66% (+12.9)#7,994 |
| 75. | Swede Heaven | 25.46% | 14.99% (+10.5)#75 | 12.66% (+12.8)#8,047 |
| 76. | Tekoa | 25.42% | 14.99% (+10.4)#76 | 12.66% (+12.8)#8,068 |
| 77. | Ocean Park | 25.34% | 14.99% (+10.3)#77 | 12.66% (+12.7)#8,120 |
| 78. | Hoodsport | 25.31% | 14.99% (+10.3)#78 | 12.66% (+12.6)#8,131 |
| 79. | Malden | 25.26% | 14.99% (+10.3)#79 | 12.66% (+12.6)#8,158 |
| 80. | Country Homes | 25.05% | 14.99% (+10.1)#80 | 12.66% (+12.4)#8,260 |
| 81. | Colfax | 25.04% | 14.99% (+10.1)#81 | 12.66% (+12.4)#8,262 |
| 82. | Colville | 25.03% | 14.99% (+10.0)#82 | 12.66% (+12.4)#8,276 |
| 83. | Alger | 25.00% | 14.99% (+10.0)#83 | 12.66% (+12.3)#8,291 |
| 84. | Lofall | 24.78% | 14.99% (+9.79)#84 | 12.66% (+12.1)#8,427 |
| 85. | Millwood | 24.77% | 14.99% (+9.77)#85 | 12.66% (+12.1)#8,433 |
| 86. | Otis Orchards East Farms | 24.60% | 14.99% (+9.61)#86 | 12.66% (+11.9)#8,503 |
| 87. | Northport | 24.58% | 14.99% (+9.58)#87 | 12.66% (+11.9)#8,517 |
| 88. | Reardan | 24.55% | 14.99% (+9.56)#88 | 12.66% (+11.9)#8,535 |
| 89. | Ocosta | 24.32% | 14.99% (+9.33)#89 | 12.66% (+11.7)#8,650 |
| 90. | Bingen | 23.79% | 14.99% (+8.80)#90 | 12.66% (+11.1)#8,940 |
| 91. | Curlew Lake | 23.76% | 14.99% (+8.77)#91 | 12.66% (+11.1)#8,955 |
| 92. | Wishram | 23.71% | 14.99% (+8.71)#92 | 12.66% (+11.0)#8,996 |
| 93. | Ashford | 23.70% | 14.99% (+8.71)#93 | 12.66% (+11.0)#8,999 |
| 94. | Lake Bosworth | 23.70% | 14.99% (+8.71)#94 | 12.66% (+11.0)#9,001 |
| 95. | Dallesport | 23.63% | 14.99% (+8.64)#95 | 12.66% (+11.0)#9,033 |
| 96. | Farmington | 23.61% | 14.99% (+8.62)#96 | 12.66% (+11.0)#9,043 |
| 97. | Riverside | 23.58% | 14.99% (+8.59)#97 | 12.66% (+10.9)#9,058 |
| 98. | Longbranch | 23.57% | 14.99% (+8.58)#98 | 12.66% (+10.9)#9,065 |
| 99. | White Salmon | 23.55% | 14.99% (+8.56)#99 | 12.66% (+10.9)#9,079 |
| 100. | Rosalia | 23.54% | 14.99% (+8.55)#100 | 12.66% (+10.9)#9,086 |
Common Questions
What are the Top 10 Cities with the Highest Percentage of German Population in Washington?
Top 10 Cities with the Highest Percentage of German Population in Washington are:
#1
100.00%
#2
100.00%
#3
84.00%
#4
75.08%
#5
70.75%
#6
50.00%
#7
47.51%
#8
43.59%
#9
43.27%
#10
40.00%
What city has the Highest Percentage of German Population in Washington?
Malo has the Highest Percentage of German Population in Washington with 100.00%.
What is the Percentage of German Population in the State of Washington?
Percentage of German Population in Washington is 14.99%.
What is the Percentage of German Population in the United States?
Percentage of German Population in the United States is 12.66%.