Cities with the Highest Percentage of Black / African American Population in Washington
RELATED REPORTS & OPTIONS
Black / African American
Washington
Compare Cities
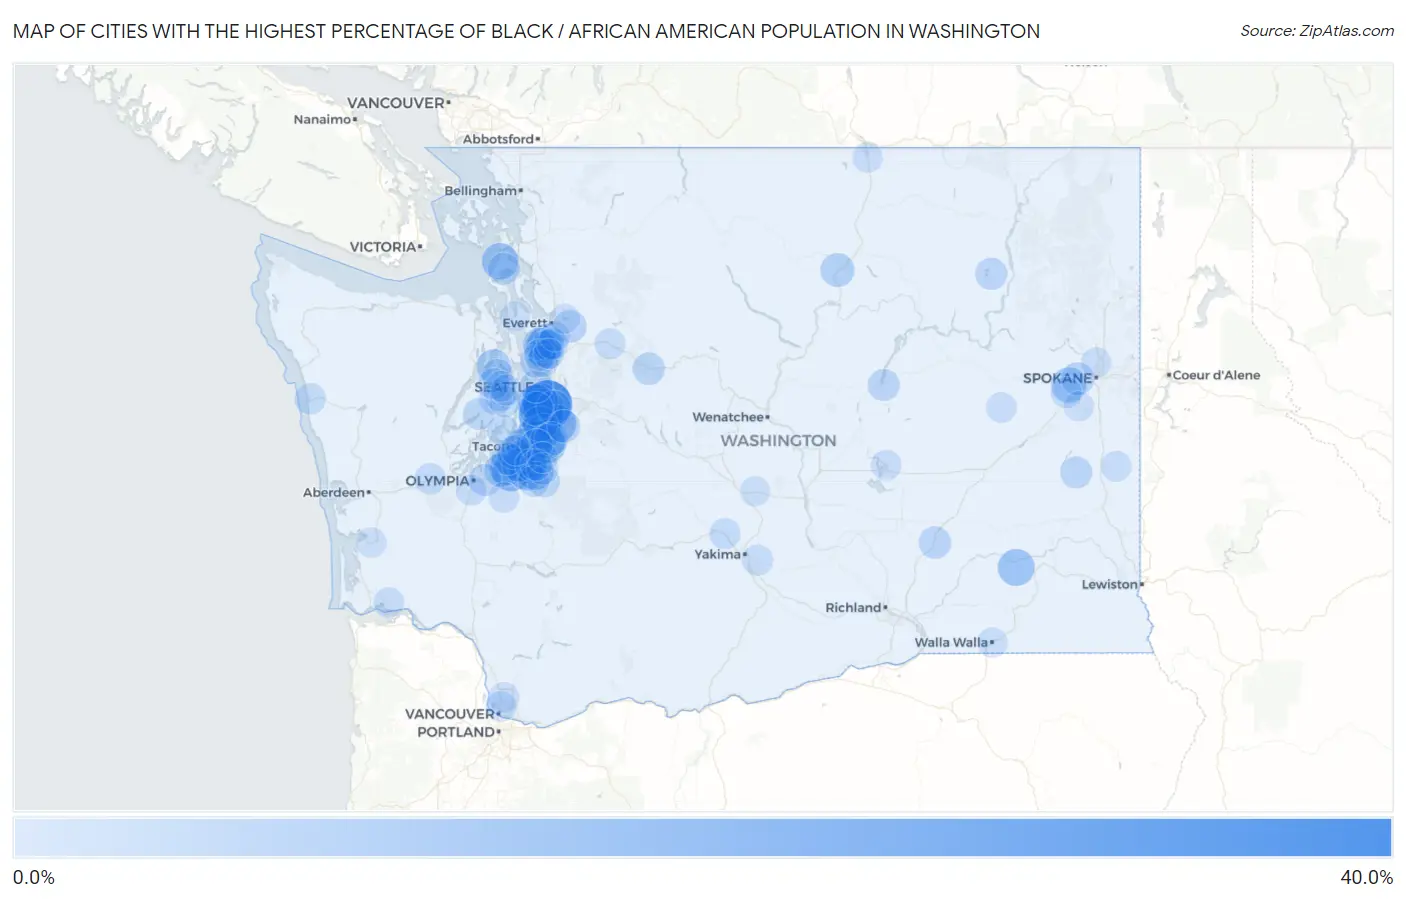
Map of Cities with the Highest Percentage of Black / African American Population in Washington
0.0%
40.0%
Cities with the Highest Percentage of Black / African American Population in Washington
| City | Black / African American | vs State | vs National | |
| 1. | Bryn Mawr Skyway | 30.0% | 3.9%(+26.1)#1 | 12.5%(+17.6)#2,357 |
| 2. | Seatac | 24.3% | 3.9%(+20.4)#2 | 12.5%(+11.8)#2,831 |
| 3. | Tukwila | 17.4% | 3.9%(+13.5)#3 | 12.5%(+4.96)#3,654 |
| 4. | Federal Way | 16.4% | 3.9%(+12.5)#4 | 12.5%(+3.94)#3,830 |
| 5. | Midland | 15.1% | 3.9%(+11.2)#5 | 12.5%(+2.63)#4,080 |
| 6. | Erlands Point | 14.2% | 3.9%(+10.3)#6 | 12.5%(+1.73)#4,261 |
| 7. | Lakewood | 14.2% | 3.9%(+10.2)#7 | 12.5%(+1.69)#4,267 |
| 8. | Parkland | 13.6% | 3.9%(+9.70)#8 | 12.5%(+1.15)#4,369 |
| 9. | Fort Lewis | 13.6% | 3.9%(+9.68)#9 | 12.5%(+1.13)#4,372 |
| 10. | Fife | 13.0% | 3.9%(+9.04)#10 | 12.5%(+0.490)#4,521 |
| 11. | Kent | 12.9% | 3.9%(+9.01)#11 | 12.5%(+0.462)#4,527 |
| 12. | Frederickson | 12.3% | 3.9%(+8.35)#12 | 12.5%(-0.199)#4,692 |
| 13. | Starbuck | 12.0% | 3.9%(+8.08)#13 | 12.5%(-0.470)#4,761 |
| 14. | Pacific | 11.7% | 3.9%(+7.79)#14 | 12.5%(-0.761)#4,827 |
| 15. | Whidbey Island Station | 11.4% | 3.9%(+7.52)#15 | 12.5%(-1.03)#4,891 |
| 16. | Boulevard Park | 11.3% | 3.9%(+7.37)#16 | 12.5%(-1.18)#4,929 |
| 17. | White Center | 11.2% | 3.9%(+7.26)#17 | 12.5%(-1.29)#4,964 |
| 18. | North Fort Lewis | 10.7% | 3.9%(+6.81)#18 | 12.5%(-1.74)#5,097 |
| 19. | Tacoma | 10.6% | 3.9%(+6.72)#19 | 12.5%(-1.83)#5,118 |
| 20. | Spanaway | 10.0% | 3.9%(+6.05)#20 | 12.5%(-2.50)#5,334 |
| 21. | Lakeland North | 9.9% | 3.9%(+5.93)#21 | 12.5%(-2.62)#5,367 |
| 22. | Fairchild Afb | 9.7% | 3.9%(+5.82)#22 | 12.5%(-2.73)#5,410 |
| 23. | Des Moines | 9.6% | 3.9%(+5.70)#23 | 12.5%(-2.85)#5,436 |
| 24. | Algona | 9.6% | 3.9%(+5.67)#24 | 12.5%(-2.88)#5,449 |
| 25. | Lake Stickney | 8.9% | 3.9%(+4.96)#25 | 12.5%(-3.59)#5,691 |
| 26. | Lynnwood | 8.7% | 3.9%(+4.74)#26 | 12.5%(-3.81)#5,777 |
| 27. | Renton | 8.4% | 3.9%(+4.50)#27 | 12.5%(-4.05)#5,873 |
| 28. | North Lynnwood | 8.3% | 3.9%(+4.37)#28 | 12.5%(-4.18)#5,933 |
| 29. | Bangor Base | 8.3% | 3.9%(+4.33)#29 | 12.5%(-4.22)#5,945 |
| 30. | Burien | 8.2% | 3.9%(+4.26)#30 | 12.5%(-4.29)#5,967 |
| 31. | Fairwood Cdp King County | 8.0% | 3.9%(+4.08)#31 | 12.5%(-4.46)#6,043 |
| 32. | Clear Lake Cdp Pierce County | 8.0% | 3.9%(+4.03)#32 | 12.5%(-4.52)#6,073 |
| 33. | Malott | 7.8% | 3.9%(+3.85)#33 | 12.5%(-4.70)#6,157 |
| 34. | Dupont | 7.7% | 3.9%(+3.75)#34 | 12.5%(-4.80)#6,197 |
| 35. | Kitsap Lake | 7.5% | 3.9%(+3.58)#35 | 12.5%(-4.97)#6,276 |
| 36. | Auburn | 7.5% | 3.9%(+3.57)#36 | 12.5%(-4.98)#6,281 |
| 37. | Mcchord Afb | 7.5% | 3.9%(+3.53)#37 | 12.5%(-5.02)#6,300 |
| 38. | University Place | 7.1% | 3.9%(+3.14)#38 | 12.5%(-5.41)#6,478 |
| 39. | Seattle | 6.7% | 3.9%(+2.82)#39 | 12.5%(-5.73)#6,646 |
| 40. | Alderwood Manor | 6.7% | 3.9%(+2.76)#40 | 12.5%(-5.79)#6,677 |
| 41. | Everett | 6.5% | 3.9%(+2.57)#41 | 12.5%(-5.98)#6,773 |
| 42. | Airway Heights | 6.5% | 3.9%(+2.55)#42 | 12.5%(-6.00)#6,781 |
| 43. | Covington | 6.4% | 3.9%(+2.52)#43 | 12.5%(-6.03)#6,806 |
| 44. | Shoreline | 6.1% | 3.9%(+2.22)#44 | 12.5%(-6.32)#6,969 |
| 45. | Skykomish | 6.0% | 3.9%(+2.11)#45 | 12.5%(-6.44)#7,051 |
| 46. | Steilacoom | 5.9% | 3.9%(+1.99)#46 | 12.5%(-6.56)#7,106 |
| 47. | Connell | 5.9% | 3.9%(+1.97)#47 | 12.5%(-6.58)#7,119 |
| 48. | Clover Creek | 5.8% | 3.9%(+1.86)#48 | 12.5%(-6.69)#7,183 |
| 49. | Larch Way | 5.8% | 3.9%(+1.83)#49 | 12.5%(-6.72)#7,202 |
| 50. | Fife Heights | 5.6% | 3.9%(+1.67)#50 | 12.5%(-6.88)#7,314 |
| 51. | Lacey | 5.6% | 3.9%(+1.67)#51 | 12.5%(-6.88)#7,316 |
| 52. | Silverdale | 5.6% | 3.9%(+1.66)#52 | 12.5%(-6.89)#7,325 |
| 53. | Brier | 5.6% | 3.9%(+1.65)#53 | 12.5%(-6.90)#7,339 |
| 54. | Graham | 5.5% | 3.9%(+1.60)#54 | 12.5%(-6.95)#7,357 |
| 55. | Bremerton | 5.5% | 3.9%(+1.57)#55 | 12.5%(-6.98)#7,372 |
| 56. | Navy Yard City | 5.4% | 3.9%(+1.53)#56 | 12.5%(-7.02)#7,395 |
| 57. | Oak Harbor | 5.4% | 3.9%(+1.50)#57 | 12.5%(-7.04)#7,416 |
| 58. | Twin Lakes | 5.4% | 3.9%(+1.48)#58 | 12.5%(-7.06)#7,427 |
| 59. | St John | 5.4% | 3.9%(+1.47)#59 | 12.5%(-7.08)#7,440 |
| 60. | Coulee City | 5.4% | 3.9%(+1.45)#60 | 12.5%(-7.10)#7,460 |
| 61. | Meadowdale | 5.3% | 3.9%(+1.39)#61 | 12.5%(-7.16)#7,496 |
| 62. | Belfair | 4.9% | 3.9%(+1.01)#62 | 12.5%(-7.54)#7,751 |
| 63. | Lake Forest Park | 4.9% | 3.9%(+0.967)#63 | 12.5%(-7.58)#7,784 |
| 64. | Martha Lake | 4.8% | 3.9%(+0.929)#64 | 12.5%(-7.62)#7,810 |
| 65. | Mountlake Terrace | 4.8% | 3.9%(+0.870)#65 | 12.5%(-7.68)#7,861 |
| 66. | South Hill | 4.8% | 3.9%(+0.851)#66 | 12.5%(-7.70)#7,874 |
| 67. | East Port Orchard | 4.7% | 3.9%(+0.769)#67 | 12.5%(-7.78)#7,936 |
| 68. | Mill Creek | 4.6% | 3.9%(+0.709)#68 | 12.5%(-7.84)#7,983 |
| 69. | Rosedale | 4.5% | 3.9%(+0.619)#69 | 12.5%(-7.93)#8,060 |
| 70. | Elk Plain | 4.5% | 3.9%(+0.543)#70 | 12.5%(-8.01)#8,134 |
| 71. | Chico | 4.5% | 3.9%(+0.533)#71 | 12.5%(-8.02)#8,142 |
| 72. | Queets | 4.4% | 3.9%(+0.465)#72 | 12.5%(-8.08)#8,210 |
| 73. | Summit View | 4.3% | 3.9%(+0.377)#73 | 12.5%(-8.17)#8,285 |
| 74. | Medical Lake | 4.3% | 3.9%(+0.357)#74 | 12.5%(-8.19)#8,307 |
| 75. | Mccleary | 4.2% | 3.9%(+0.325)#75 | 12.5%(-8.22)#8,339 |
| 76. | Naches | 4.1% | 3.9%(+0.133)#76 | 12.5%(-8.42)#8,511 |
| 77. | Enetai | 4.0% | 3.9%(+0.038)#77 | 12.5%(-8.51)#8,596 |
| 78. | Fircrest | 4.0% | 3.9%(+0.038)#78 | 12.5%(-8.51)#8,598 |
| 79. | Gold Bar | 3.9% | 3.9%(+0.014)#79 | 12.5%(-8.54)#8,625 |
| 80. | Moxee | 3.9% | 3.9%(-0.022)#80 | 12.5%(-8.57)#8,667 |
| 81. | Puyallup | 3.8% | 3.9%(-0.126)#81 | 12.5%(-8.68)#8,778 |
| 82. | Tracyton | 3.7% | 3.9%(-0.234)#82 | 12.5%(-8.78)#8,873 |
| 83. | Tumwater | 3.6% | 3.9%(-0.318)#83 | 12.5%(-8.87)#8,975 |
| 84. | Oakesdale | 3.5% | 3.9%(-0.408)#84 | 12.5%(-8.96)#9,073 |
| 85. | Yelm | 3.4% | 3.9%(-0.491)#85 | 12.5%(-9.04)#9,150 |
| 86. | Mount Vista | 3.4% | 3.9%(-0.527)#86 | 12.5%(-9.08)#9,193 |
| 87. | Harrington | 3.3% | 3.9%(-0.588)#87 | 12.5%(-9.14)#9,269 |
| 88. | Hazel Dell | 3.3% | 3.9%(-0.597)#88 | 12.5%(-9.15)#9,282 |
| 89. | Rosburg | 3.3% | 3.9%(-0.658)#89 | 12.5%(-9.21)#9,360 |
| 90. | Moses Lake | 3.2% | 3.9%(-0.701)#90 | 12.5%(-9.25)#9,408 |
| 91. | Oroville | 3.1% | 3.9%(-0.784)#91 | 12.5%(-9.33)#9,512 |
| 92. | Eastmont | 3.1% | 3.9%(-0.784)#92 | 12.5%(-9.33)#9,513 |
| 93. | Bothell West | 3.0% | 3.9%(-0.877)#93 | 12.5%(-9.43)#9,624 |
| 94. | Country Homes | 3.0% | 3.9%(-0.880)#94 | 12.5%(-9.43)#9,633 |
| 95. | South Bend | 3.0% | 3.9%(-0.963)#95 | 12.5%(-9.51)#9,743 |
| 96. | Walla Walla | 3.0% | 3.9%(-0.969)#96 | 12.5%(-9.52)#9,752 |
| 97. | Freeland | 2.9% | 3.9%(-1.02)#97 | 12.5%(-9.57)#9,812 |
| 98. | Lake Stevens | 2.9% | 3.9%(-1.05)#98 | 12.5%(-9.60)#9,860 |
| 99. | Cheney | 2.8% | 3.9%(-1.10)#99 | 12.5%(-9.64)#9,915 |
| 100. | Kittitas | 2.8% | 3.9%(-1.11)#100 | 12.5%(-9.66)#9,934 |
Common Questions
What are the Top 10 Cities with the Highest Percentage of Black / African American Population in Washington?
Top 10 Cities with the Highest Percentage of Black / African American Population in Washington are:
#1
30.0%
#2
24.3%
#3
17.4%
#4
16.4%
#5
15.1%
#6
14.2%
#7
13.6%
#8
13.6%
#9
13.0%
#10
12.9%
What city has the Highest Percentage of Black / African American Population in Washington?
Bryn Mawr Skyway has the Highest Percentage of Black / African American Population in Washington with 30.0%.
What is the Percentage of Black / African American Population in the State of Washington?
Percentage of Black / African American Population in Washington is 3.9%.
What is the Percentage of Black / African American Population in the United States?
Percentage of Black / African American Population in the United States is 12.5%.