Cities with the Most Immigrants from Colombia in Washington
RELATED REPORTS & OPTIONS
Colombia
Washington
Compare Cities
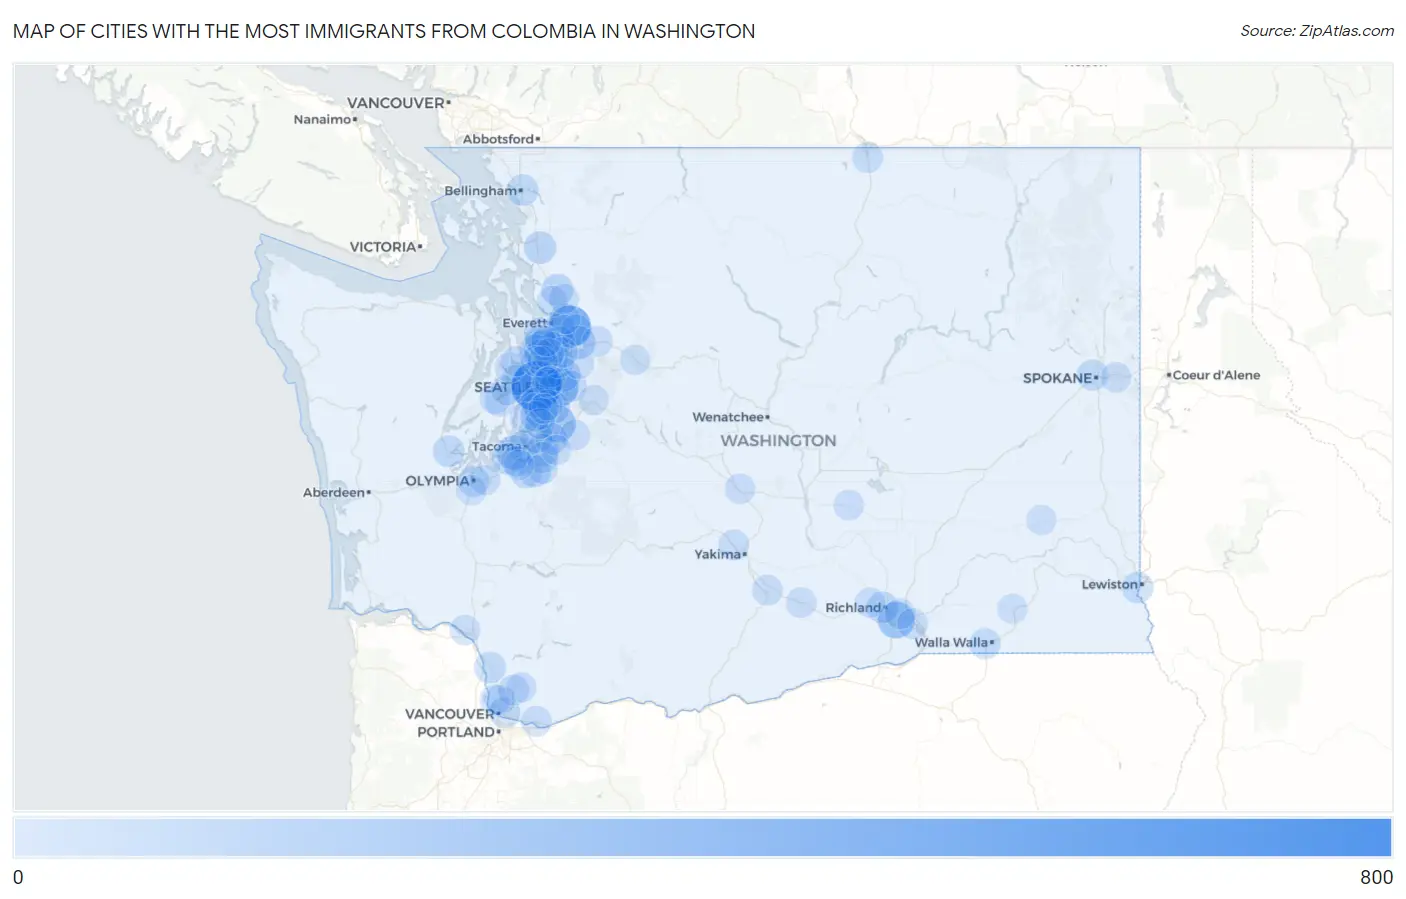
Map of Cities with the Most Immigrants from Colombia in Washington
0
800
Cities with the Most Immigrants from Colombia in Washington
| City | Colombia | vs State | vs National | |
| 1. | Seattle | 756 | 5,640(13.40%)#1 | 860,787(0.09%)#163 |
| 2. | Everett | 439 | 5,640(7.78%)#2 | 860,787(0.05%)#262 |
| 3. | Bellevue | 331 | 5,640(5.87%)#3 | 860,787(0.04%)#355 |
| 4. | Kent | 255 | 5,640(4.52%)#4 | 860,787(0.03%)#464 |
| 5. | Kennewick | 252 | 5,640(4.47%)#5 | 860,787(0.03%)#468 |
| 6. | Lynnwood | 165 | 5,640(2.93%)#6 | 860,787(0.02%)#675 |
| 7. | University Place | 157 | 5,640(2.78%)#7 | 860,787(0.02%)#697 |
| 8. | Monroe | 124 | 5,640(2.20%)#8 | 860,787(0.01%)#855 |
| 9. | Redmond | 119 | 5,640(2.11%)#9 | 860,787(0.01%)#876 |
| 10. | Silver Firs | 92 | 5,640(1.63%)#10 | 860,787(0.01%)#1,073 |
| 11. | Renton | 84 | 5,640(1.49%)#11 | 860,787(0.01%)#1,137 |
| 12. | Federal Way | 84 | 5,640(1.49%)#12 | 860,787(0.01%)#1,138 |
| 13. | Mount Vernon | 81 | 5,640(1.44%)#13 | 860,787(0.01%)#1,170 |
| 14. | Tacoma | 78 | 5,640(1.38%)#14 | 860,787(0.01%)#1,198 |
| 15. | Edgewood | 78 | 5,640(1.38%)#15 | 860,787(0.01%)#1,209 |
| 16. | Auburn | 77 | 5,640(1.37%)#16 | 860,787(0.01%)#1,214 |
| 17. | Mukilteo | 76 | 5,640(1.35%)#17 | 860,787(0.01%)#1,231 |
| 18. | Arlington | 72 | 5,640(1.28%)#18 | 860,787(0.01%)#1,274 |
| 19. | Kirkland | 71 | 5,640(1.26%)#19 | 860,787(0.01%)#1,280 |
| 20. | Bothell | 69 | 5,640(1.22%)#20 | 860,787(0.01%)#1,302 |
| 21. | Richland | 67 | 5,640(1.19%)#21 | 860,787(0.01%)#1,331 |
| 22. | Frederickson | 66 | 5,640(1.17%)#22 | 860,787(0.01%)#1,342 |
| 23. | Burien | 60 | 5,640(1.06%)#23 | 860,787(0.01%)#1,421 |
| 24. | Shelton | 59 | 5,640(1.05%)#24 | 860,787(0.01%)#1,445 |
| 25. | Seatac | 56 | 5,640(0.99%)#25 | 860,787(0.01%)#1,490 |
| 26. | Steilacoom | 55 | 5,640(0.98%)#26 | 860,787(0.01%)#1,507 |
| 27. | Spanaway | 54 | 5,640(0.96%)#27 | 860,787(0.01%)#1,512 |
| 28. | Bellingham | 53 | 5,640(0.94%)#28 | 860,787(0.01%)#1,526 |
| 29. | Woodland | 52 | 5,640(0.92%)#29 | 860,787(0.01%)#1,555 |
| 30. | Olympia | 49 | 5,640(0.87%)#30 | 860,787(0.01%)#1,603 |
| 31. | West Clarkston Highland | 47 | 5,640(0.83%)#31 | 860,787(0.01%)#1,653 |
| 32. | Spokane | 46 | 5,640(0.82%)#32 | 860,787(0.01%)#1,657 |
| 33. | Puyallup | 46 | 5,640(0.82%)#33 | 860,787(0.01%)#1,664 |
| 34. | Woodinville | 44 | 5,640(0.78%)#34 | 860,787(0.01%)#1,723 |
| 35. | Garrett | 43 | 5,640(0.76%)#35 | 860,787(0.00%)#1,753 |
| 36. | Sammamish | 41 | 5,640(0.73%)#36 | 860,787(0.00%)#1,773 |
| 37. | Vancouver | 40 | 5,640(0.71%)#37 | 860,787(0.00%)#1,796 |
| 38. | Edmonds | 39 | 5,640(0.69%)#38 | 860,787(0.00%)#1,819 |
| 39. | Fobes Hill | 37 | 5,640(0.66%)#39 | 860,787(0.00%)#1,889 |
| 40. | Three Lakes | 35 | 5,640(0.62%)#40 | 860,787(0.00%)#1,970 |
| 41. | Mill Creek East | 31 | 5,640(0.55%)#41 | 860,787(0.00%)#2,089 |
| 42. | Port Orchard | 31 | 5,640(0.55%)#42 | 860,787(0.00%)#2,092 |
| 43. | Mountlake Terrace | 30 | 5,640(0.53%)#43 | 860,787(0.00%)#2,120 |
| 44. | Oroville | 30 | 5,640(0.53%)#44 | 860,787(0.00%)#2,145 |
| 45. | North Lynnwood | 28 | 5,640(0.50%)#45 | 860,787(0.00%)#2,204 |
| 46. | Gleed | 28 | 5,640(0.50%)#46 | 860,787(0.00%)#2,225 |
| 47. | Pasco | 25 | 5,640(0.44%)#47 | 860,787(0.00%)#2,301 |
| 48. | Marysville | 24 | 5,640(0.43%)#48 | 860,787(0.00%)#2,331 |
| 49. | Bremerton | 24 | 5,640(0.43%)#49 | 860,787(0.00%)#2,335 |
| 50. | Finley | 23 | 5,640(0.41%)#50 | 860,787(0.00%)#2,406 |
| 51. | Bainbridge Island | 22 | 5,640(0.39%)#51 | 860,787(0.00%)#2,433 |
| 52. | Battle Ground | 22 | 5,640(0.39%)#52 | 860,787(0.00%)#2,434 |
| 53. | Lake Stevens | 21 | 5,640(0.37%)#53 | 860,787(0.00%)#2,478 |
| 54. | Washougal | 21 | 5,640(0.37%)#54 | 860,787(0.00%)#2,492 |
| 55. | Toppenish | 21 | 5,640(0.37%)#55 | 860,787(0.00%)#2,502 |
| 56. | Tehaleh | 18 | 5,640(0.32%)#56 | 860,787(0.00%)#2,651 |
| 57. | Vashon | 17 | 5,640(0.30%)#57 | 860,787(0.00%)#2,712 |
| 58. | Sultan | 17 | 5,640(0.30%)#58 | 860,787(0.00%)#2,724 |
| 59. | Royal City | 17 | 5,640(0.30%)#59 | 860,787(0.00%)#2,736 |
| 60. | Lakewood | 16 | 5,640(0.28%)#60 | 860,787(0.00%)#2,744 |
| 61. | Ellensburg | 16 | 5,640(0.28%)#61 | 860,787(0.00%)#2,762 |
| 62. | Fairwood Cdp King County | 16 | 5,640(0.28%)#62 | 860,787(0.00%)#2,764 |
| 63. | Duvall | 16 | 5,640(0.28%)#63 | 860,787(0.00%)#2,785 |
| 64. | Spokane Valley | 15 | 5,640(0.27%)#64 | 860,787(0.00%)#2,816 |
| 65. | South Hill | 15 | 5,640(0.27%)#65 | 860,787(0.00%)#2,820 |
| 66. | Maltby | 15 | 5,640(0.27%)#66 | 860,787(0.00%)#2,849 |
| 67. | Black Diamond | 14 | 5,640(0.25%)#67 | 860,787(0.00%)#2,935 |
| 68. | White Center | 13 | 5,640(0.23%)#68 | 860,787(0.00%)#2,983 |
| 69. | Salmon Creek | 12 | 5,640(0.21%)#69 | 860,787(0.00%)#3,036 |
| 70. | Sunnyside | 12 | 5,640(0.21%)#70 | 860,787(0.00%)#3,043 |
| 71. | Felida | 12 | 5,640(0.21%)#71 | 860,787(0.00%)#3,051 |
| 72. | Lacey | 11 | 5,640(0.20%)#72 | 860,787(0.00%)#3,101 |
| 73. | Snoqualmie | 11 | 5,640(0.20%)#73 | 860,787(0.00%)#3,121 |
| 74. | Picnic Point | 11 | 5,640(0.20%)#74 | 860,787(0.00%)#3,131 |
| 75. | Normandy Park | 11 | 5,640(0.20%)#75 | 860,787(0.00%)#3,141 |
| 76. | Bothell West | 10 | 5,640(0.18%)#76 | 860,787(0.00%)#3,201 |
| 77. | Bryn Mawr Skyway | 10 | 5,640(0.18%)#77 | 860,787(0.00%)#3,202 |
| 78. | Enetai | 10 | 5,640(0.18%)#78 | 860,787(0.00%)#3,251 |
| 79. | Shoreline | 9 | 5,640(0.16%)#79 | 860,787(0.00%)#3,264 |
| 80. | Longview | 9 | 5,640(0.16%)#80 | 860,787(0.00%)#3,272 |
| 81. | Venersborg | 9 | 5,640(0.16%)#81 | 860,787(0.00%)#3,335 |
| 82. | Sisco Heights | 9 | 5,640(0.16%)#82 | 860,787(0.00%)#3,341 |
| 83. | Lake Forest Park | 8 | 5,640(0.14%)#83 | 860,787(0.00%)#3,403 |
| 84. | Lake Tapps | 8 | 5,640(0.14%)#84 | 860,787(0.00%)#3,407 |
| 85. | Des Moines | 7 | 5,640(0.12%)#85 | 860,787(0.00%)#3,477 |
| 86. | West Richland | 7 | 5,640(0.12%)#86 | 860,787(0.00%)#3,489 |
| 87. | Mcchord Afb | 7 | 5,640(0.12%)#87 | 860,787(0.00%)#3,531 |
| 88. | Tumwater | 6 | 5,640(0.11%)#88 | 860,787(0.00%)#3,577 |
| 89. | Suquamish | 6 | 5,640(0.11%)#89 | 860,787(0.00%)#3,614 |
| 90. | Lacrosse | 6 | 5,640(0.11%)#90 | 860,787(0.00%)#3,647 |
| 91. | Clyde Hill | 5 | 5,640(0.09%)#91 | 860,787(0.00%)#3,694 |
| 92. | Medina | 5 | 5,640(0.09%)#92 | 860,787(0.00%)#3,698 |
| 93. | Waitsburg | 3 | 5,640(0.05%)#93 | 860,787(0.00%)#3,887 |
| 94. | Tukwila | 2 | 5,640(0.04%)#94 | 860,787(0.00%)#3,911 |
| 95. | Indianola | 2 | 5,640(0.04%)#95 | 860,787(0.00%)#3,930 |
| 96. | Baring | 2 | 5,640(0.04%)#96 | 860,787(0.00%)#3,991 |
| 97. | Lake Stickney | 1 | 5,640(0.02%)#97 | 860,787(0.00%)#4,007 |
Common Questions
What are the Top 10 Cities with the Most Immigrants from Colombia in Washington?
Top 10 Cities with the Most Immigrants from Colombia in Washington are:
#1
756
#2
439
#3
331
#4
255
#5
252
#6
165
#7
157
#8
124
#9
119
#10
92
What city has the Most Immigrants from Colombia in Washington?
Seattle has the Most Immigrants from Colombia in Washington with 756.
What is the Total Immigrants from Colombia in the State of Washington?
Total Immigrants from Colombia in Washington is 5,640.
What is the Total Immigrants from Colombia in the United States?
Total Immigrants from Colombia in the United States is 860,787.