Cities with the Most Immigrants from Latin America in Washington
RELATED REPORTS & OPTIONS
Latin America
Washington
Compare Cities
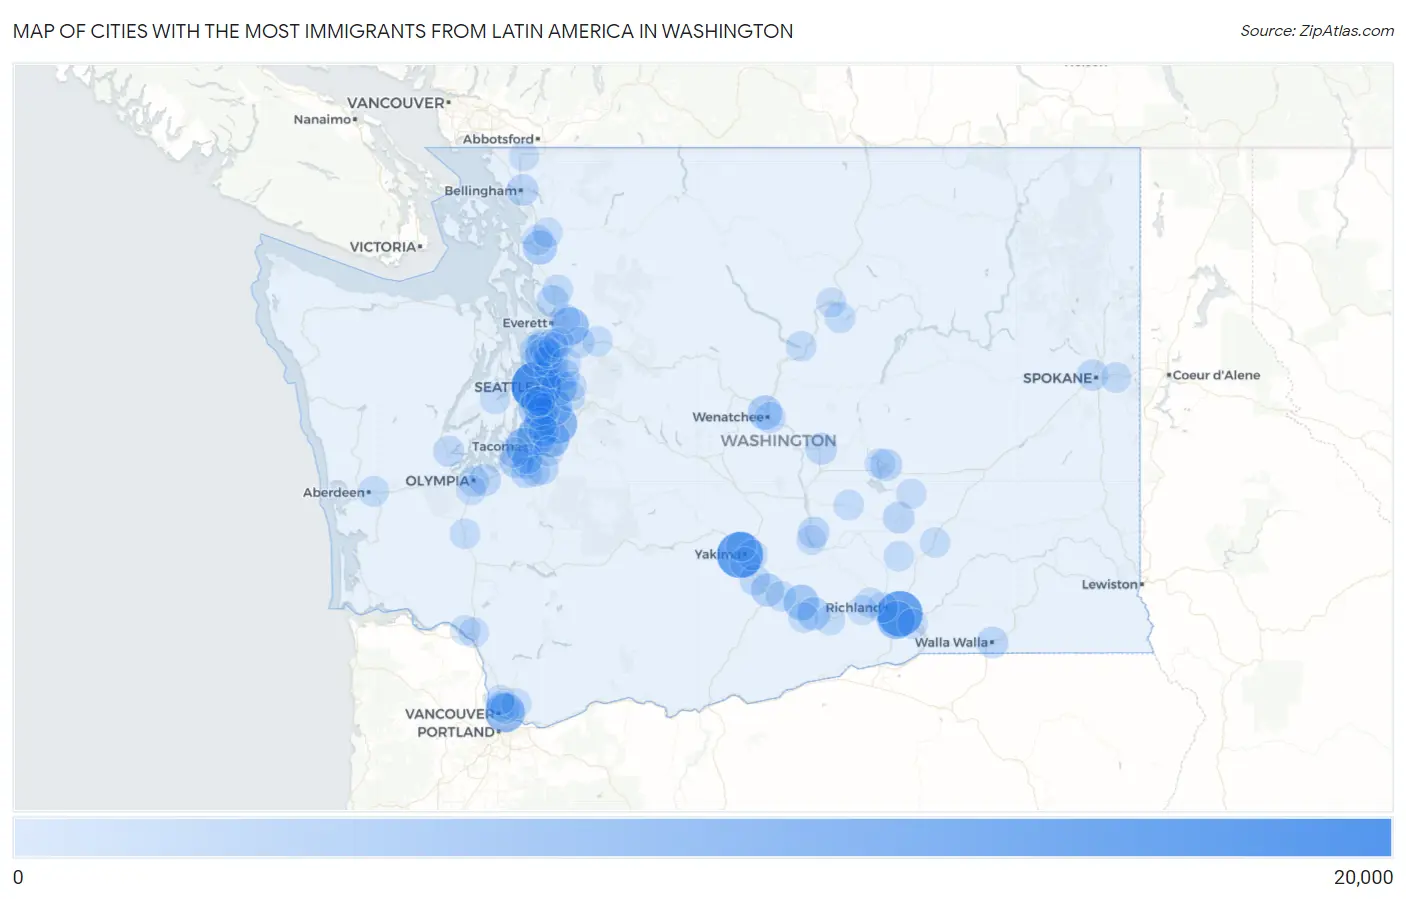
Map of Cities with the Most Immigrants from Latin America in Washington
0
20,000
Cities with the Most Immigrants from Latin America in Washington
| City | Latin America | vs State | vs National | |
| 1. | Seattle | 18,177 | 324,167(5.61%)#1 | 22,649,518(0.08%)#170 |
| 2. | Yakima | 14,954 | 324,167(4.61%)#2 | 22,649,518(0.07%)#221 |
| 3. | Pasco | 14,257 | 324,167(4.40%)#3 | 22,649,518(0.06%)#234 |
| 4. | Vancouver | 9,158 | 324,167(2.83%)#4 | 22,649,518(0.04%)#364 |
| 5. | Kent | 8,903 | 324,167(2.75%)#5 | 22,649,518(0.04%)#376 |
| 6. | Federal Way | 7,808 | 324,167(2.41%)#6 | 22,649,518(0.03%)#431 |
| 7. | Kennewick | 7,652 | 324,167(2.36%)#7 | 22,649,518(0.03%)#440 |
| 8. | Everett | 7,340 | 324,167(2.26%)#8 | 22,649,518(0.03%)#466 |
| 9. | Tacoma | 6,422 | 324,167(1.98%)#9 | 22,649,518(0.03%)#525 |
| 10. | Auburn | 6,314 | 324,167(1.95%)#10 | 22,649,518(0.03%)#535 |
| 11. | Renton | 6,036 | 324,167(1.86%)#11 | 22,649,518(0.03%)#555 |
| 12. | Bellevue | 5,627 | 324,167(1.74%)#12 | 22,649,518(0.02%)#600 |
| 13. | Sunnyside | 5,270 | 324,167(1.63%)#13 | 22,649,518(0.02%)#641 |
| 14. | Burien | 5,091 | 324,167(1.57%)#14 | 22,649,518(0.02%)#667 |
| 15. | Wenatchee | 4,285 | 324,167(1.32%)#15 | 22,649,518(0.02%)#758 |
| 16. | Mount Vernon | 4,138 | 324,167(1.28%)#16 | 22,649,518(0.02%)#776 |
| 17. | Lakewood | 3,598 | 324,167(1.11%)#17 | 22,649,518(0.02%)#872 |
| 18. | Kirkland | 3,572 | 324,167(1.10%)#18 | 22,649,518(0.02%)#880 |
| 19. | Grandview | 3,193 | 324,167(0.98%)#19 | 22,649,518(0.01%)#952 |
| 20. | Toppenish | 3,163 | 324,167(0.98%)#20 | 22,649,518(0.01%)#963 |
| 21. | Seatac | 3,048 | 324,167(0.94%)#21 | 22,649,518(0.01%)#990 |
| 22. | Des Moines | 2,886 | 324,167(0.89%)#22 | 22,649,518(0.01%)#1,036 |
| 23. | Lynnwood | 2,603 | 324,167(0.80%)#23 | 22,649,518(0.01%)#1,111 |
| 24. | North Lynnwood | 2,235 | 324,167(0.69%)#24 | 22,649,518(0.01%)#1,235 |
| 25. | Bothell | 2,191 | 324,167(0.68%)#25 | 22,649,518(0.01%)#1,249 |
| 26. | Marysville | 2,177 | 324,167(0.67%)#26 | 22,649,518(0.01%)#1,258 |
| 27. | Quincy | 2,154 | 324,167(0.66%)#27 | 22,649,518(0.01%)#1,274 |
| 28. | Tukwila | 2,149 | 324,167(0.66%)#28 | 22,649,518(0.01%)#1,279 |
| 29. | Lacey | 2,072 | 324,167(0.64%)#29 | 22,649,518(0.01%)#1,311 |
| 30. | Moses Lake | 2,068 | 324,167(0.64%)#30 | 22,649,518(0.01%)#1,313 |
| 31. | South Hill | 1,981 | 324,167(0.61%)#31 | 22,649,518(0.01%)#1,350 |
| 32. | Othello | 1,968 | 324,167(0.61%)#32 | 22,649,518(0.01%)#1,362 |
| 33. | Redmond | 1,960 | 324,167(0.60%)#33 | 22,649,518(0.01%)#1,368 |
| 34. | Walla Walla | 1,951 | 324,167(0.60%)#34 | 22,649,518(0.01%)#1,373 |
| 35. | Mattawa | 1,804 | 324,167(0.56%)#35 | 22,649,518(0.01%)#1,446 |
| 36. | Bellingham | 1,785 | 324,167(0.55%)#36 | 22,649,518(0.01%)#1,459 |
| 37. | East Wenatchee | 1,604 | 324,167(0.49%)#37 | 22,649,518(0.01%)#1,550 |
| 38. | White Center | 1,595 | 324,167(0.49%)#38 | 22,649,518(0.01%)#1,557 |
| 39. | Spokane | 1,589 | 324,167(0.49%)#39 | 22,649,518(0.01%)#1,560 |
| 40. | Shelton | 1,502 | 324,167(0.46%)#40 | 22,649,518(0.01%)#1,617 |
| 41. | Shoreline | 1,486 | 324,167(0.46%)#41 | 22,649,518(0.01%)#1,630 |
| 42. | Wapato | 1,450 | 324,167(0.45%)#42 | 22,649,518(0.01%)#1,662 |
| 43. | Spanaway | 1,423 | 324,167(0.44%)#43 | 22,649,518(0.01%)#1,687 |
| 44. | Monroe | 1,299 | 324,167(0.40%)#44 | 22,649,518(0.01%)#1,799 |
| 45. | Arlington | 1,290 | 324,167(0.40%)#45 | 22,649,518(0.01%)#1,810 |
| 46. | Parkland | 1,289 | 324,167(0.40%)#46 | 22,649,518(0.01%)#1,813 |
| 47. | Olympia | 1,272 | 324,167(0.39%)#47 | 22,649,518(0.01%)#1,826 |
| 48. | Frederickson | 1,241 | 324,167(0.38%)#48 | 22,649,518(0.01%)#1,859 |
| 49. | Bridgeport | 1,236 | 324,167(0.38%)#49 | 22,649,518(0.01%)#1,867 |
| 50. | Aberdeen | 1,104 | 324,167(0.34%)#50 | 22,649,518(0.00%)#2,014 |
| 51. | Edmonds | 1,058 | 324,167(0.33%)#51 | 22,649,518(0.00%)#2,056 |
| 52. | Terrace Heights | 1,044 | 324,167(0.32%)#52 | 22,649,518(0.00%)#2,081 |
| 53. | Union Gap | 1,027 | 324,167(0.32%)#53 | 22,649,518(0.00%)#2,100 |
| 54. | Burlington | 1,008 | 324,167(0.31%)#54 | 22,649,518(0.00%)#2,131 |
| 55. | Lakeland North | 1,004 | 324,167(0.31%)#55 | 22,649,518(0.00%)#2,135 |
| 56. | Mountlake Terrace | 999 | 324,167(0.31%)#56 | 22,649,518(0.00%)#2,143 |
| 57. | Basin City | 988 | 324,167(0.30%)#57 | 22,649,518(0.00%)#2,161 |
| 58. | Hazel Dell | 975 | 324,167(0.30%)#58 | 22,649,518(0.00%)#2,180 |
| 59. | Richland | 967 | 324,167(0.30%)#59 | 22,649,518(0.00%)#2,189 |
| 60. | Kenmore | 953 | 324,167(0.29%)#60 | 22,649,518(0.00%)#2,216 |
| 61. | Royal City | 946 | 324,167(0.29%)#61 | 22,649,518(0.00%)#2,230 |
| 62. | Bremerton | 908 | 324,167(0.28%)#62 | 22,649,518(0.00%)#2,281 |
| 63. | Spokane Valley | 907 | 324,167(0.28%)#63 | 22,649,518(0.00%)#2,283 |
| 64. | Issaquah | 904 | 324,167(0.28%)#64 | 22,649,518(0.00%)#2,286 |
| 65. | Granger | 897 | 324,167(0.28%)#65 | 22,649,518(0.00%)#2,295 |
| 66. | Prosser | 891 | 324,167(0.27%)#66 | 22,649,518(0.00%)#2,303 |
| 67. | Chelan | 870 | 324,167(0.27%)#67 | 22,649,518(0.00%)#2,331 |
| 68. | Midland | 859 | 324,167(0.26%)#68 | 22,649,518(0.00%)#2,348 |
| 69. | Mill Creek | 854 | 324,167(0.26%)#69 | 22,649,518(0.00%)#2,357 |
| 70. | Selah | 851 | 324,167(0.26%)#70 | 22,649,518(0.00%)#2,367 |
| 71. | Sultan | 848 | 324,167(0.26%)#71 | 22,649,518(0.00%)#2,370 |
| 72. | Centralia | 844 | 324,167(0.26%)#72 | 22,649,518(0.00%)#2,377 |
| 73. | Connell | 843 | 324,167(0.26%)#73 | 22,649,518(0.00%)#2,378 |
| 74. | Sammamish | 771 | 324,167(0.24%)#74 | 22,649,518(0.00%)#2,521 |
| 75. | Mabton | 770 | 324,167(0.24%)#75 | 22,649,518(0.00%)#2,527 |
| 76. | Minnehaha | 765 | 324,167(0.24%)#76 | 22,649,518(0.00%)#2,538 |
| 77. | Cascade Valley | 765 | 324,167(0.24%)#77 | 22,649,518(0.00%)#2,539 |
| 78. | University Place | 749 | 324,167(0.23%)#78 | 22,649,518(0.00%)#2,578 |
| 79. | Lake Stevens | 741 | 324,167(0.23%)#79 | 22,649,518(0.00%)#2,592 |
| 80. | Finley | 730 | 324,167(0.23%)#80 | 22,649,518(0.00%)#2,623 |
| 81. | Brewster | 726 | 324,167(0.22%)#81 | 22,649,518(0.00%)#2,629 |
| 82. | Longview | 720 | 324,167(0.22%)#82 | 22,649,518(0.00%)#2,639 |
| 83. | West Richland | 719 | 324,167(0.22%)#83 | 22,649,518(0.00%)#2,640 |
| 84. | Orchards | 701 | 324,167(0.22%)#84 | 22,649,518(0.00%)#2,687 |
| 85. | Bothell West | 687 | 324,167(0.21%)#85 | 22,649,518(0.00%)#2,714 |
| 86. | Mill Creek East | 685 | 324,167(0.21%)#86 | 22,649,518(0.00%)#2,718 |
| 87. | Alderwood Manor | 657 | 324,167(0.20%)#87 | 22,649,518(0.00%)#2,774 |
| 88. | Boulevard Park | 648 | 324,167(0.20%)#88 | 22,649,518(0.00%)#2,799 |
| 89. | Kelso | 646 | 324,167(0.20%)#89 | 22,649,518(0.00%)#2,800 |
| 90. | Sedro Woolley | 636 | 324,167(0.20%)#90 | 22,649,518(0.00%)#2,829 |
| 91. | Lynden | 627 | 324,167(0.19%)#91 | 22,649,518(0.00%)#2,851 |
| 92. | Salmon Creek | 622 | 324,167(0.19%)#92 | 22,649,518(0.00%)#2,863 |
| 93. | Tumwater | 609 | 324,167(0.19%)#93 | 22,649,518(0.00%)#2,903 |
| 94. | Sumner | 602 | 324,167(0.19%)#94 | 22,649,518(0.00%)#2,922 |
| 95. | Warden | 589 | 324,167(0.18%)#95 | 22,649,518(0.00%)#2,968 |
| 96. | Benton City | 587 | 324,167(0.18%)#96 | 22,649,518(0.00%)#2,974 |
| 97. | Fairwood Cdp King County | 546 | 324,167(0.17%)#97 | 22,649,518(0.00%)#3,113 |
| 98. | Desert Aire | 546 | 324,167(0.17%)#98 | 22,649,518(0.00%)#3,115 |
| 99. | Silver Firs | 534 | 324,167(0.16%)#99 | 22,649,518(0.00%)#3,162 |
| 100. | Cottage Lake | 529 | 324,167(0.16%)#100 | 22,649,518(0.00%)#3,181 |
Common Questions
What are the Top 10 Cities with the Most Immigrants from Latin America in Washington?
Top 10 Cities with the Most Immigrants from Latin America in Washington are:
What city has the Most Immigrants from Latin America in Washington?
Seattle has the Most Immigrants from Latin America in Washington with 18,177.
What is the Total Immigrants from Latin America in the State of Washington?
Total Immigrants from Latin America in Washington is 324,167.
What is the Total Immigrants from Latin America in the United States?
Total Immigrants from Latin America in the United States is 22,649,518.