Cities with the Highest Child Poverty Level Among Boys Under the Age of 16 in Washington
RELATED REPORTS & OPTIONS
Highest Poverty | Boys 0-16
Washington
Compare Cities
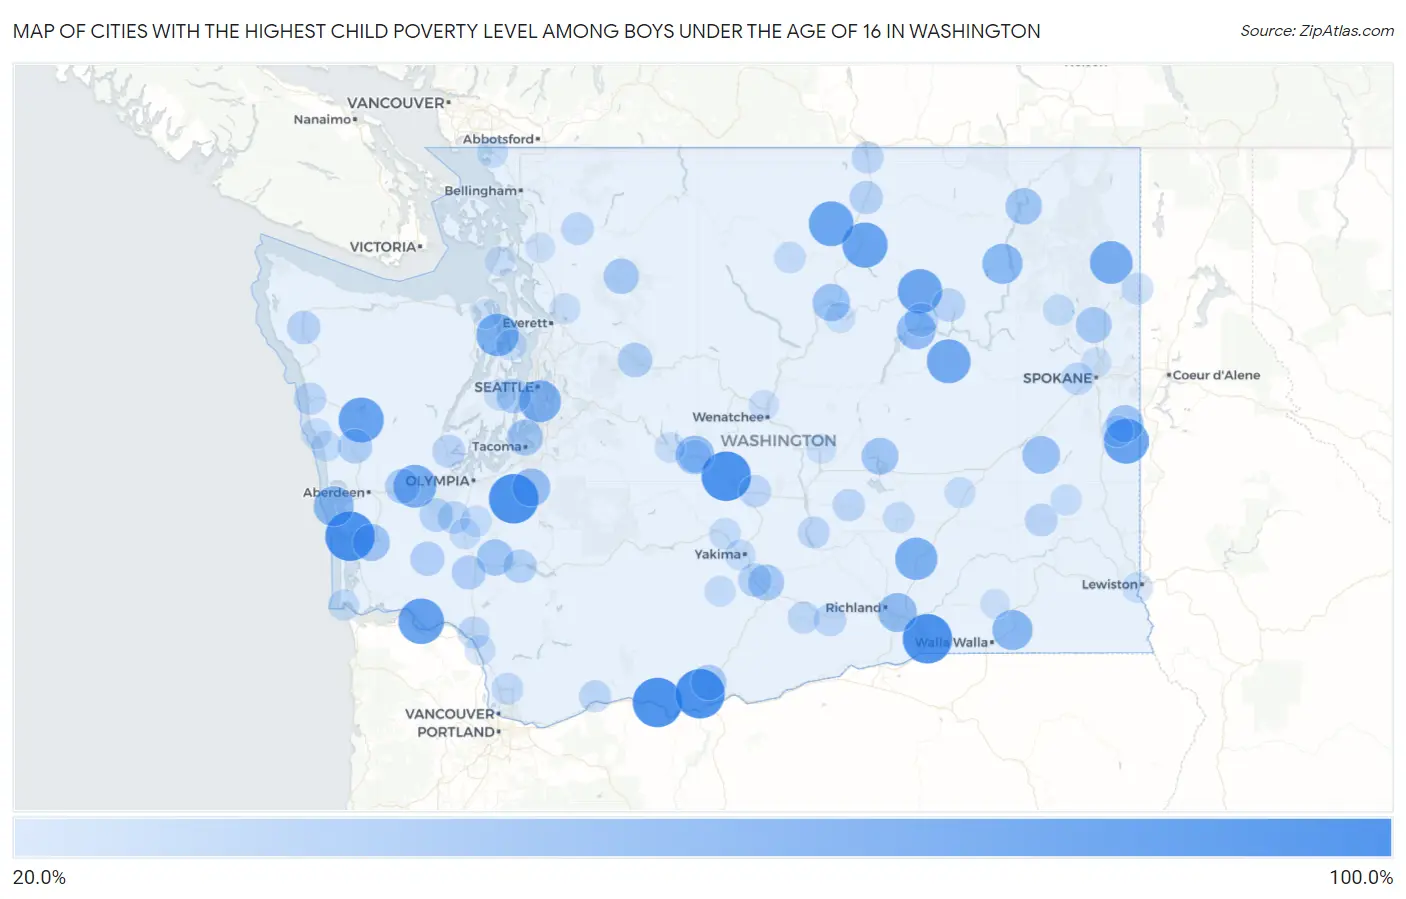
Map of Cities with the Highest Child Poverty Level Among Boys Under the Age of 16 in Washington
0.0%
100.0%
Cities with the Highest Child Poverty Level Among Boys Under the Age of 16 in Washington
| City | Child Poverty (Boys) | vs State | vs National | |
| 1. | Mckenna | 100.0% | 12.2%(+87.8)#1 | 16.9%(+83.1)#146 |
| 2. | Beverly | 100.0% | 12.2%(+87.8)#2 | 16.9%(+83.1)#242 |
| 3. | Lyle | 100.0% | 12.2%(+87.8)#3 | 16.9%(+83.1)#285 |
| 4. | Centerville | 100.0% | 12.2%(+87.8)#4 | 16.9%(+83.1)#474 |
| 5. | Tokeland | 100.0% | 12.2%(+87.8)#5 | 16.9%(+83.1)#491 |
| 6. | Thorp | 100.0% | 12.2%(+87.8)#6 | 16.9%(+83.1)#517 |
| 7. | Wallula | 100.0% | 12.2%(+87.8)#7 | 16.9%(+83.1)#522 |
| 8. | East Cathlamet | 85.2% | 12.2%(+73.1)#8 | 16.9%(+68.3)#836 |
| 9. | North Omak | 83.3% | 12.2%(+71.1)#9 | 16.9%(+66.4)#891 |
| 10. | Neilton | 83.0% | 12.2%(+70.8)#10 | 16.9%(+66.1)#911 |
| 11. | Latah | 82.4% | 12.2%(+70.2)#11 | 16.9%(+65.4)#929 |
| 12. | Conconully | 81.8% | 12.2%(+69.6)#12 | 16.9%(+64.9)#944 |
| 13. | Nespelem | 80.0% | 12.2%(+67.8)#13 | 16.9%(+63.1)#1,007 |
| 14. | Wilbur | 78.1% | 12.2%(+65.9)#14 | 16.9%(+61.2)#1,082 |
| 15. | Elma | 74.6% | 12.2%(+62.4)#15 | 16.9%(+57.7)#1,210 |
| 16. | Cusick | 73.9% | 12.2%(+61.7)#16 | 16.9%(+57.0)#1,238 |
| 17. | Mesa | 72.4% | 12.2%(+60.2)#17 | 16.9%(+55.5)#1,303 |
| 18. | Port Ludlow | 72.4% | 12.2%(+60.2)#18 | 16.9%(+55.5)#1,307 |
| 19. | Boulevard Park | 71.1% | 12.2%(+58.9)#19 | 16.9%(+54.2)#1,369 |
| 20. | Dixie | 64.3% | 12.2%(+52.1)#20 | 16.9%(+47.4)#1,735 |
| 21. | Inchelium | 64.0% | 12.2%(+51.8)#21 | 16.9%(+47.1)#1,744 |
| 22. | Westport | 63.9% | 12.2%(+51.7)#22 | 16.9%(+47.0)#1,747 |
| 23. | West Pasco | 59.7% | 12.2%(+47.5)#23 | 16.9%(+42.8)#2,032 |
| 24. | Grand Coulee | 59.0% | 12.2%(+46.8)#24 | 16.9%(+42.1)#2,072 |
| 25. | Cle Elum | 58.1% | 12.2%(+45.9)#25 | 16.9%(+41.2)#2,148 |
| 26. | South Creek | 55.9% | 12.2%(+43.7)#26 | 16.9%(+39.0)#2,326 |
| 27. | Lamont | 55.0% | 12.2%(+42.8)#27 | 16.9%(+38.1)#2,399 |
| 28. | Brewster | 53.5% | 12.2%(+41.3)#28 | 16.9%(+36.6)#2,537 |
| 29. | Fairfield | 52.9% | 12.2%(+40.7)#29 | 16.9%(+36.0)#2,584 |
| 30. | South Bend | 52.2% | 12.2%(+40.0)#30 | 16.9%(+35.3)#2,667 |
| 31. | Moses Lake North | 51.7% | 12.2%(+39.5)#31 | 16.9%(+34.8)#2,712 |
| 32. | Onalaska | 50.0% | 12.2%(+37.8)#32 | 16.9%(+33.1)#2,881 |
| 33. | Marcus | 50.0% | 12.2%(+37.8)#33 | 16.9%(+33.1)#2,935 |
| 34. | Browns Point | 48.3% | 12.2%(+36.1)#34 | 16.9%(+31.4)#3,140 |
| 35. | Clear Lake Cdp Skagit County | 48.2% | 12.2%(+36.0)#35 | 16.9%(+31.3)#3,150 |
| 36. | Deer Park | 48.0% | 12.2%(+35.8)#36 | 16.9%(+31.1)#3,190 |
| 37. | Buena | 47.9% | 12.2%(+35.7)#37 | 16.9%(+31.0)#3,195 |
| 38. | Goldendale | 46.6% | 12.2%(+34.4)#38 | 16.9%(+29.7)#3,349 |
| 39. | Darrington | 46.2% | 12.2%(+34.0)#39 | 16.9%(+29.3)#3,388 |
| 40. | Brady | 43.8% | 12.2%(+31.7)#40 | 16.9%(+26.9)#3,709 |
| 41. | Manchester | 42.9% | 12.2%(+30.7)#41 | 16.9%(+26.0)#3,846 |
| 42. | Humptulips | 42.9% | 12.2%(+30.7)#42 | 16.9%(+26.0)#3,880 |
| 43. | Baring | 42.9% | 12.2%(+30.7)#43 | 16.9%(+26.0)#3,885 |
| 44. | Pe Ell | 41.5% | 12.2%(+29.3)#44 | 16.9%(+24.6)#4,094 |
| 45. | Winlock | 41.2% | 12.2%(+29.0)#45 | 16.9%(+24.3)#4,123 |
| 46. | Elmer City | 40.0% | 12.2%(+27.8)#46 | 16.9%(+23.1)#4,323 |
| 47. | Mossyrock | 39.8% | 12.2%(+27.6)#47 | 16.9%(+22.9)#4,368 |
| 48. | Wapato | 39.6% | 12.2%(+27.5)#48 | 16.9%(+22.7)#4,393 |
| 49. | Oakville | 39.6% | 12.2%(+27.4)#49 | 16.9%(+22.7)#4,405 |
| 50. | Forks | 38.8% | 12.2%(+26.6)#50 | 16.9%(+21.9)#4,533 |
| 51. | Tonasket | 38.8% | 12.2%(+26.6)#51 | 16.9%(+21.9)#4,534 |
| 52. | Keller | 38.5% | 12.2%(+26.3)#52 | 16.9%(+21.6)#4,583 |
| 53. | Beacon Hill | 37.7% | 12.2%(+25.5)#53 | 16.9%(+20.8)#4,734 |
| 54. | Shelton | 37.1% | 12.2%(+24.9)#54 | 16.9%(+20.2)#4,841 |
| 55. | Lacrosse | 37.0% | 12.2%(+24.8)#55 | 16.9%(+20.1)#4,850 |
| 56. | South Cle Elum | 36.2% | 12.2%(+24.0)#56 | 16.9%(+19.3)#5,028 |
| 57. | Hamilton | 36.0% | 12.2%(+23.8)#57 | 16.9%(+19.1)#5,063 |
| 58. | Rochester | 35.8% | 12.2%(+23.6)#58 | 16.9%(+18.9)#5,101 |
| 59. | Airway Heights | 35.5% | 12.2%(+23.4)#59 | 16.9%(+18.6)#5,162 |
| 60. | Prosser | 35.4% | 12.2%(+23.3)#60 | 16.9%(+18.5)#5,188 |
| 61. | Royal City | 35.4% | 12.2%(+23.2)#61 | 16.9%(+18.5)#5,213 |
| 62. | Kittitas | 35.2% | 12.2%(+23.0)#62 | 16.9%(+18.3)#5,254 |
| 63. | Kitsap Lake | 35.1% | 12.2%(+22.9)#63 | 16.9%(+18.2)#5,267 |
| 64. | Queets | 35.0% | 12.2%(+22.8)#64 | 16.9%(+18.1)#5,294 |
| 65. | Mabton | 34.4% | 12.2%(+22.2)#65 | 16.9%(+17.5)#5,423 |
| 66. | Mattawa | 34.1% | 12.2%(+21.9)#66 | 16.9%(+17.2)#5,478 |
| 67. | Carson | 34.1% | 12.2%(+21.9)#67 | 16.9%(+17.2)#5,482 |
| 68. | Oroville | 33.9% | 12.2%(+21.7)#68 | 16.9%(+17.0)#5,514 |
| 69. | Kelso | 33.8% | 12.2%(+21.6)#69 | 16.9%(+16.9)#5,546 |
| 70. | Dollars Corner | 33.3% | 12.2%(+21.1)#70 | 16.9%(+16.4)#5,634 |
| 71. | Waverly | 33.3% | 12.2%(+21.1)#71 | 16.9%(+16.4)#5,713 |
| 72. | Newport | 33.2% | 12.2%(+21.0)#72 | 16.9%(+16.3)#5,770 |
| 73. | Navy Yard City | 32.3% | 12.2%(+20.1)#73 | 16.9%(+15.4)#5,963 |
| 74. | Twisp | 32.0% | 12.2%(+19.8)#74 | 16.9%(+15.1)#6,042 |
| 75. | Ilwaco | 31.6% | 12.2%(+19.4)#75 | 16.9%(+14.7)#6,132 |
| 76. | Naches | 31.5% | 12.2%(+19.3)#76 | 16.9%(+14.6)#6,170 |
| 77. | Othello | 31.4% | 12.2%(+19.2)#77 | 16.9%(+14.5)#6,188 |
| 78. | Springdale | 31.3% | 12.2%(+19.2)#78 | 16.9%(+14.4)#6,206 |
| 79. | Bucoda | 31.0% | 12.2%(+18.8)#79 | 16.9%(+14.1)#6,286 |
| 80. | Centralia | 30.8% | 12.2%(+18.6)#80 | 16.9%(+13.9)#6,341 |
| 81. | Lind | 30.4% | 12.2%(+18.2)#81 | 16.9%(+13.5)#6,457 |
| 82. | Endicott | 30.4% | 12.2%(+18.2)#82 | 16.9%(+13.5)#6,458 |
| 83. | White Swan | 30.4% | 12.2%(+18.2)#83 | 16.9%(+13.5)#6,484 |
| 84. | Yakima | 30.3% | 12.2%(+18.1)#84 | 16.9%(+13.4)#6,494 |
| 85. | Blaine | 30.1% | 12.2%(+17.9)#85 | 16.9%(+13.2)#6,545 |
| 86. | Port Gamble Tribal Community | 30.0% | 12.2%(+17.8)#86 | 16.9%(+13.1)#6,561 |
| 87. | Qui Nai Elt Village | 30.0% | 12.2%(+17.8)#87 | 16.9%(+13.1)#6,591 |
| 88. | Taholah | 29.9% | 12.2%(+17.7)#88 | 16.9%(+13.0)#6,611 |
| 89. | Lake Cassidy | 29.7% | 12.2%(+17.5)#89 | 16.9%(+12.8)#6,630 |
| 90. | Bridgeport | 29.6% | 12.2%(+17.4)#90 | 16.9%(+12.7)#6,655 |
| 91. | West Clarkston Highland | 29.5% | 12.2%(+17.3)#91 | 16.9%(+12.6)#6,683 |
| 92. | Kalama | 29.4% | 12.2%(+17.2)#92 | 16.9%(+12.5)#6,727 |
| 93. | Easton | 29.0% | 12.2%(+16.8)#93 | 16.9%(+12.1)#6,813 |
| 94. | Sunnyslope | 28.2% | 12.2%(+16.0)#94 | 16.9%(+11.3)#7,055 |
| 95. | Quincy | 27.8% | 12.2%(+15.6)#95 | 16.9%(+10.9)#7,150 |
| 96. | Country Homes | 27.7% | 12.2%(+15.5)#96 | 16.9%(+10.8)#7,205 |
| 97. | Port Hadlock Irondale | 27.5% | 12.2%(+15.3)#97 | 16.9%(+10.6)#7,276 |
| 98. | Whidbey Island Station | 27.3% | 12.2%(+15.1)#98 | 16.9%(+10.4)#7,322 |
| 99. | Mount Vernon | 27.1% | 12.2%(+14.9)#99 | 16.9%(+10.2)#7,390 |
| 100. | Prescott | 26.9% | 12.2%(+14.7)#100 | 16.9%(+10.0)#7,437 |
Common Questions
What are the Top 10 Cities with the Highest Child Poverty Level Among Boys Under the Age of 16 in Washington?
Top 10 Cities with the Highest Child Poverty Level Among Boys Under the Age of 16 in Washington are:
#1
100.0%
#2
100.0%
#3
100.0%
#4
100.0%
#5
100.0%
#6
100.0%
#7
85.2%
#8
83.3%
#9
83.0%
#10
82.4%
What city has the Highest Child Poverty Level Among Boys Under the Age of 16 in Washington?
Mckenna has the Highest Child Poverty Level Among Boys Under the Age of 16 in Washington with 100.0%.
What is the Poverty Level Among Boys Under the Age of 16 in the State of Washington?
Poverty Level Among Boys Under the Age of 16 in Washington is 12.2%.
What is the Poverty Level Among Boys Under the Age of 16 in the United States?
Poverty Level Among Boys Under the Age of 16 in the United States is 16.9%.