Cities with the Highest Percentage of Immigrants from Taiwan in Washington
RELATED REPORTS & OPTIONS
Taiwan
Washington
Compare Cities
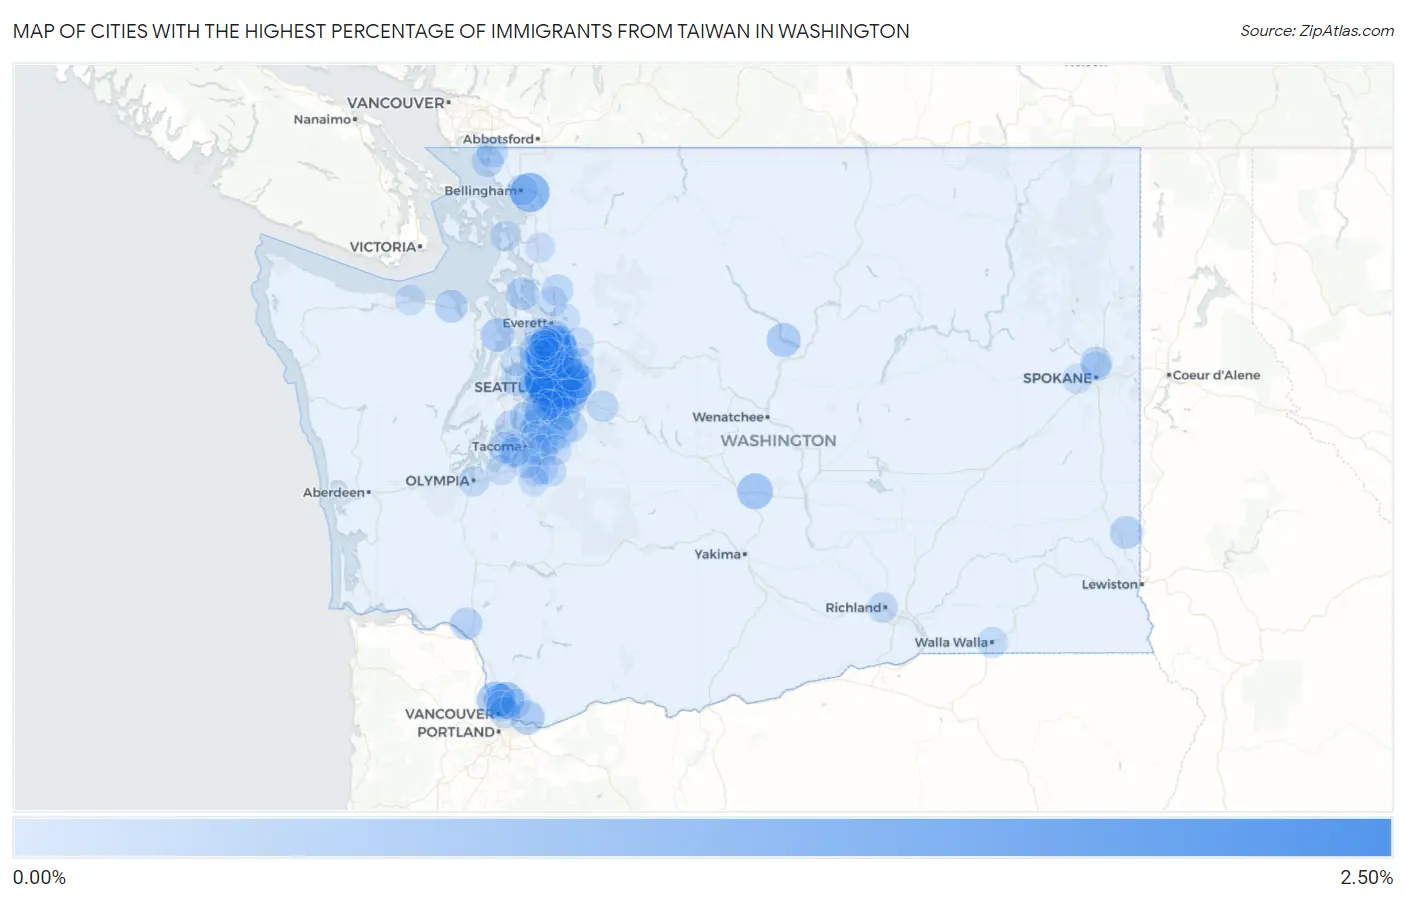
Map of Cities with the Highest Percentage of Immigrants from Taiwan in Washington
0.00%
2.50%
Cities with the Highest Percentage of Immigrants from Taiwan in Washington
| City | Taiwan | vs State | vs National | |
| 1. | Yarrow Point | 2.34% | 0.22%(+2.13)#1 | 0.11%(+2.23)#68 |
| 2. | Hunts Point | 2.17% | 0.22%(+1.95)#2 | 0.11%(+2.05)#79 |
| 3. | Bellevue | 1.48% | 0.22%(+1.27)#3 | 0.11%(+1.37)#143 |
| 4. | Clyde Hill | 1.45% | 0.22%(+1.23)#4 | 0.11%(+1.33)#146 |
| 5. | Medina | 1.37% | 0.22%(+1.15)#5 | 0.11%(+1.25)#153 |
| 6. | Redmond | 1.37% | 0.22%(+1.15)#6 | 0.11%(+1.25)#155 |
| 7. | Kenmore | 1.36% | 0.22%(+1.14)#7 | 0.11%(+1.25)#156 |
| 8. | Sammamish | 1.26% | 0.22%(+1.05)#8 | 0.11%(+1.15)#171 |
| 9. | Mercer Island | 1.18% | 0.22%(+0.966)#9 | 0.11%(+1.07)#186 |
| 10. | Geneva | 1.10% | 0.22%(+0.881)#10 | 0.11%(+0.984)#206 |
| 11. | Newcastle | 1.00% | 0.22%(+0.782)#11 | 0.11%(+0.884)#237 |
| 12. | Bothell East | 0.95% | 0.22%(+0.730)#12 | 0.11%(+0.833)#256 |
| 13. | Clearview | 0.90% | 0.22%(+0.688)#13 | 0.11%(+0.790)#277 |
| 14. | Mill Creek | 0.89% | 0.22%(+0.678)#14 | 0.11%(+0.781)#279 |
| 15. | Larch Way | 0.80% | 0.22%(+0.580)#15 | 0.11%(+0.682)#325 |
| 16. | Brier | 0.80% | 0.22%(+0.579)#16 | 0.11%(+0.682)#326 |
| 17. | Clear Lake Cdp Pierce County | 0.78% | 0.22%(+0.562)#17 | 0.11%(+0.664)#336 |
| 18. | Felida | 0.76% | 0.22%(+0.544)#18 | 0.11%(+0.647)#345 |
| 19. | Barberton | 0.73% | 0.22%(+0.514)#19 | 0.11%(+0.616)#360 |
| 20. | Kirkland | 0.71% | 0.22%(+0.490)#20 | 0.11%(+0.593)#374 |
| 21. | Kittitas | 0.70% | 0.22%(+0.487)#21 | 0.11%(+0.589)#377 |
| 22. | Fairwood Cdp King County | 0.69% | 0.22%(+0.472)#22 | 0.11%(+0.574)#382 |
| 23. | Mill Creek East | 0.67% | 0.22%(+0.452)#23 | 0.11%(+0.554)#395 |
| 24. | Issaquah | 0.61% | 0.22%(+0.398)#24 | 0.11%(+0.501)#443 |
| 25. | Seattle | 0.59% | 0.22%(+0.372)#25 | 0.11%(+0.474)#461 |
| 26. | Des Moines | 0.55% | 0.22%(+0.332)#26 | 0.11%(+0.434)#507 |
| 27. | Ames Lake | 0.54% | 0.22%(+0.326)#27 | 0.11%(+0.428)#512 |
| 28. | Camas | 0.52% | 0.22%(+0.303)#28 | 0.11%(+0.406)#529 |
| 29. | Manson | 0.51% | 0.22%(+0.289)#29 | 0.11%(+0.392)#550 |
| 30. | Renton | 0.50% | 0.22%(+0.279)#30 | 0.11%(+0.382)#559 |
| 31. | Union Hill Novelty Hill | 0.47% | 0.22%(+0.254)#31 | 0.11%(+0.357)#592 |
| 32. | Port Ludlow | 0.45% | 0.22%(+0.236)#32 | 0.11%(+0.339)#617 |
| 33. | Silver Firs | 0.45% | 0.22%(+0.234)#33 | 0.11%(+0.336)#621 |
| 34. | Woodinville | 0.44% | 0.22%(+0.220)#34 | 0.11%(+0.322)#632 |
| 35. | Lynnwood | 0.41% | 0.22%(+0.198)#35 | 0.11%(+0.300)#668 |
| 36. | Bothell | 0.39% | 0.22%(+0.178)#36 | 0.11%(+0.281)#695 |
| 37. | Camano | 0.39% | 0.22%(+0.175)#37 | 0.11%(+0.277)#703 |
| 38. | Shoreline | 0.39% | 0.22%(+0.173)#38 | 0.11%(+0.275)#710 |
| 39. | Maple Heights Lake Desire | 0.38% | 0.22%(+0.162)#39 | 0.11%(+0.265)#725 |
| 40. | Salmon Creek | 0.37% | 0.22%(+0.158)#40 | 0.11%(+0.261)#733 |
| 41. | Sequim | 0.36% | 0.22%(+0.143)#41 | 0.11%(+0.246)#757 |
| 42. | Pullman | 0.35% | 0.22%(+0.134)#42 | 0.11%(+0.237)#774 |
| 43. | Cottage Lake | 0.35% | 0.22%(+0.133)#43 | 0.11%(+0.235)#776 |
| 44. | Fircrest | 0.32% | 0.22%(+0.108)#44 | 0.11%(+0.210)#819 |
| 45. | Longview Heights | 0.31% | 0.22%(+0.094)#45 | 0.11%(+0.196)#848 |
| 46. | Lake Forest Park | 0.30% | 0.22%(+0.089)#46 | 0.11%(+0.191)#869 |
| 47. | Seatac | 0.29% | 0.22%(+0.075)#47 | 0.11%(+0.177)#906 |
| 48. | Martha Lake | 0.27% | 0.22%(+0.055)#48 | 0.11%(+0.157)#953 |
| 49. | Mukilteo | 0.26% | 0.22%(+0.046)#49 | 0.11%(+0.148)#973 |
| 50. | Maplewood | 0.25% | 0.22%(+0.038)#50 | 0.11%(+0.140)#1,002 |
| 51. | Fox Island | 0.25% | 0.22%(+0.031)#51 | 0.11%(+0.133)#1,023 |
| 52. | Country Homes | 0.24% | 0.22%(+0.024)#52 | 0.11%(+0.126)#1,040 |
| 53. | Vancouver | 0.22% | 0.22%(+0.007)#53 | 0.11%(+0.110)#1,089 |
| 54. | Birch Bay | 0.22% | 0.22%(-0.001)#54 | 0.11%(+0.102)#1,112 |
| 55. | Arlington | 0.21% | 0.22%(-0.004)#55 | 0.11%(+0.099)#1,119 |
| 56. | Maple Valley | 0.21% | 0.22%(-0.004)#56 | 0.11%(+0.098)#1,121 |
| 57. | Edmonds | 0.20% | 0.22%(-0.015)#57 | 0.11%(+0.088)#1,156 |
| 58. | North Bend | 0.20% | 0.22%(-0.017)#58 | 0.11%(+0.085)#1,165 |
| 59. | Duvall | 0.20% | 0.22%(-0.019)#59 | 0.11%(+0.083)#1,169 |
| 60. | Bainbridge Island | 0.19% | 0.22%(-0.026)#60 | 0.11%(+0.077)#1,204 |
| 61. | Alderwood Manor | 0.19% | 0.22%(-0.026)#61 | 0.11%(+0.076)#1,208 |
| 62. | Fife | 0.18% | 0.22%(-0.032)#62 | 0.11%(+0.070)#1,232 |
| 63. | Eastmont | 0.17% | 0.22%(-0.043)#63 | 0.11%(+0.059)#1,283 |
| 64. | Blaine | 0.17% | 0.22%(-0.045)#64 | 0.11%(+0.057)#1,290 |
| 65. | Lakeland South | 0.17% | 0.22%(-0.049)#65 | 0.11%(+0.053)#1,299 |
| 66. | Vashon | 0.16% | 0.22%(-0.051)#66 | 0.11%(+0.051)#1,307 |
| 67. | Walla Walla | 0.16% | 0.22%(-0.053)#67 | 0.11%(+0.049)#1,319 |
| 68. | Bellingham | 0.15% | 0.22%(-0.063)#68 | 0.11%(+0.040)#1,370 |
| 69. | Kent | 0.15% | 0.22%(-0.071)#69 | 0.11%(+0.031)#1,421 |
| 70. | Richland | 0.13% | 0.22%(-0.088)#70 | 0.11%(+0.014)#1,503 |
| 71. | Olympia | 0.12% | 0.22%(-0.093)#71 | 0.11%(+0.010)#1,533 |
| 72. | Hazel Dell | 0.12% | 0.22%(-0.093)#72 | 0.11%(+0.010)#1,534 |
| 73. | Mountlake Terrace | 0.12% | 0.22%(-0.094)#73 | 0.11%(+0.008)#1,537 |
| 74. | Lake Stickney | 0.12% | 0.22%(-0.100)#74 | 0.11%(+0.002)#1,568 |
| 75. | Auburn | 0.11% | 0.22%(-0.103)#75 | 0.11%(-0.000)#1,588 |
| 76. | South Hill | 0.11% | 0.22%(-0.104)#76 | 0.11%(-0.002)#1,601 |
| 77. | Federal Way | 0.11% | 0.22%(-0.106)#77 | 0.11%(-0.003)#1,610 |
| 78. | Bothell West | 0.097% | 0.22%(-0.119)#78 | 0.11%(-0.016)#1,685 |
| 79. | Edgewood | 0.097% | 0.22%(-0.119)#79 | 0.11%(-0.017)#1,688 |
| 80. | Monroe | 0.097% | 0.22%(-0.119)#80 | 0.11%(-0.017)#1,689 |
| 81. | Lake Morton Berrydale | 0.096% | 0.22%(-0.120)#81 | 0.11%(-0.018)#1,700 |
| 82. | Dupont | 0.090% | 0.22%(-0.126)#82 | 0.11%(-0.023)#1,740 |
| 83. | Lake Tapps | 0.090% | 0.22%(-0.126)#83 | 0.11%(-0.023)#1,743 |
| 84. | Airway Heights | 0.085% | 0.22%(-0.131)#84 | 0.11%(-0.029)#1,780 |
| 85. | Port Angeles | 0.085% | 0.22%(-0.131)#85 | 0.11%(-0.029)#1,782 |
| 86. | Frederickson | 0.085% | 0.22%(-0.131)#86 | 0.11%(-0.029)#1,784 |
| 87. | University Place | 0.081% | 0.22%(-0.135)#87 | 0.11%(-0.033)#1,820 |
| 88. | Anacortes | 0.079% | 0.22%(-0.137)#88 | 0.11%(-0.034)#1,827 |
| 89. | Orting | 0.079% | 0.22%(-0.137)#89 | 0.11%(-0.035)#1,831 |
| 90. | Bryn Mawr Skyway | 0.078% | 0.22%(-0.138)#90 | 0.11%(-0.036)#1,844 |
| 91. | Town And Country | 0.076% | 0.22%(-0.140)#91 | 0.11%(-0.037)#1,850 |
| 92. | Marysville | 0.064% | 0.22%(-0.152)#92 | 0.11%(-0.050)#1,948 |
| 93. | Lake Stevens | 0.057% | 0.22%(-0.159)#93 | 0.11%(-0.057)#2,027 |
| 94. | Indianola | 0.056% | 0.22%(-0.160)#94 | 0.11%(-0.057)#2,030 |
| 95. | Elk Plain | 0.056% | 0.22%(-0.160)#95 | 0.11%(-0.057)#2,031 |
| 96. | Orchards | 0.055% | 0.22%(-0.161)#96 | 0.11%(-0.059)#2,050 |
| 97. | Mount Vernon | 0.054% | 0.22%(-0.162)#97 | 0.11%(-0.060)#2,064 |
| 98. | North Lynnwood | 0.054% | 0.22%(-0.162)#98 | 0.11%(-0.060)#2,070 |
| 99. | Burien | 0.049% | 0.22%(-0.167)#99 | 0.11%(-0.065)#2,135 |
| 100. | Parkland | 0.048% | 0.22%(-0.168)#100 | 0.11%(-0.065)#2,139 |
Common Questions
What are the Top 10 Cities with the Highest Percentage of Immigrants from Taiwan in Washington?
Top 10 Cities with the Highest Percentage of Immigrants from Taiwan in Washington are:
#1
2.34%
#2
2.17%
#3
1.48%
#4
1.45%
#5
1.37%
#6
1.37%
#7
1.36%
#8
1.26%
#9
1.18%
#10
1.10%
What city has the Highest Percentage of Immigrants from Taiwan in Washington?
Yarrow Point has the Highest Percentage of Immigrants from Taiwan in Washington with 2.34%.
What is the Percentage of Immigrants from Taiwan in the State of Washington?
Percentage of Immigrants from Taiwan in Washington is 0.22%.
What is the Percentage of Immigrants from Taiwan in the United States?
Percentage of Immigrants from Taiwan in the United States is 0.11%.